If you want to learn how to read Level 2 market data — the live order book under every stock chart — this is the field guide. Level 2 (the “tape”) shows every resting bid and ask across exchanges, the size sitting at each price, and how fast that liquidity is moving. Used well, it’s one of the only edges retail traders have over slower money. Used poorly, it’s a fast way to overtrade.
This guide covers what Level 2 actually shows, how to read the depth chart, when the tape is signal and when it’s noise, and how I pair it with volume analysis and VWAP at the open. We’ll walk through real examples and where Level 2 lies to you.
What You’ll Learn
What Level 2 quotes are and how they differ from Level 1.
How to read the bid/ask, size, and depth columns.
When the tape is useful — and when it’s a trap.
How spoofing, dark pools, and algos distort the picture.
Market depth charts are often a confusing and misunderstood part of trading. Besides just learning to read stock charts, level 2 quotes and order books are a lot like trying to read the matrix.
Numbers flash on the screen and then disappear quickly, especially during volatile trading moments. Also, it can be hard to tell what order are buy order, and what orders are sell orders. That being said, may seasoned traders use L2 data to predict support and resistance levels and liquidity zones.
In this post, we’ll discuss what level 2 trading is, and how to understand a stock depth chart to aid in your trading.
What is Level 2 Trading?
The Level 2 trading window provides data for pending orders in the market. [1]
Level 2 quotes display the size of the best bids and offers with their respective depths. Day traders use Level 2 stock data to gauge the direction of the stock market over the short-term. And, by short-term, we mean seconds to minutes.
How to Read a Level 2 Depth Chart
To read a level 2 depth chart, you need to understand the L2 data window structure. It is comprised of three key components: (1) bid/ask window, (2) size of orders, and (3) depth.
Level 2 Bid/Ask Prices
The bid/ask data contains the current bid and ask prices for the security across various exchanges. These could be from the NASDAQ, ARCA, BATS, or many more exchanges.
The L2 data is displayed in rows of what is known as the order flow. This order flow is also referred to as market depth and displays the best bids.
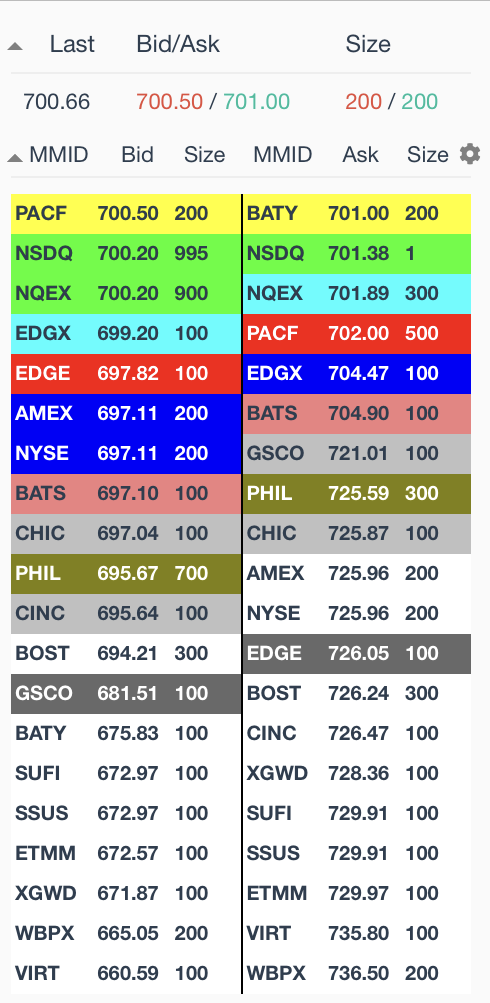
Here is an example of what this might look like in a professional day trading Level 2 window:
Level 2 market depth window
As you can see, the spread or distance between the bid and ask are close or near the top of the order book. You can also see which exchange is facilitating the orders.
Size of the Orders
The next key element is the size of the order which is displayed directly after the bid and the ask prices. This provides you with an idea of where traders are placing their orders,
which gives you some indication of their intent.
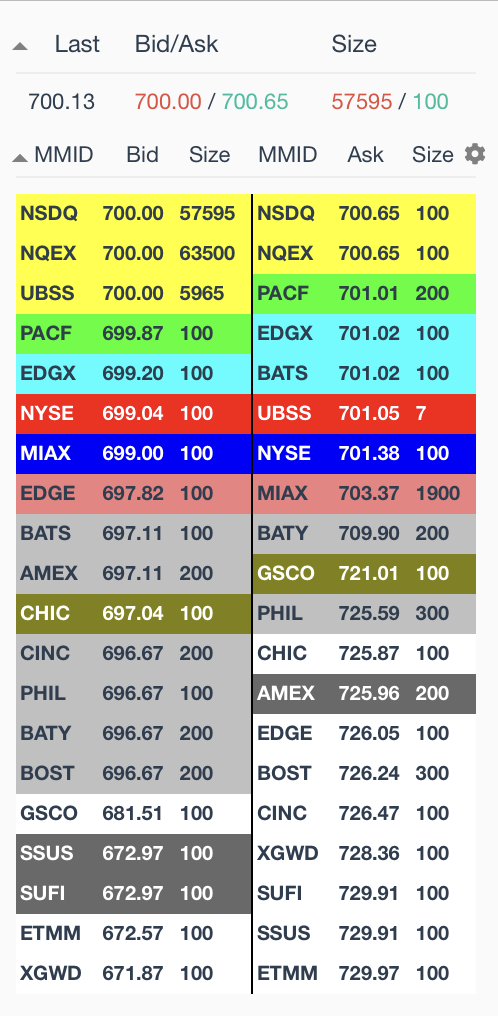
Order size in Level 2 order book
In the above image of a TSLA stock depth chart, the level 0 depth which is the first row, has 57595 buy orders at $700 and 100 sell orders at $700.65. That’s for the NSDQ exchange only. As you can see there are 63500 and 5965 shares sitting on the bid at the same price, $700.
This could mean one of two things, depending on the context. One, there are more traders looking to buy at lower prices, or two, there are more traders looking to sell on the bid. If you see the buy orders being gobbled up and the price is moving higher, this flow tells you that the shorts are in control and are able to push the stock lower.
In contrast, the orders are filled and the stock moves higher, it could be a key support level where buyers stepped in to move the price upward. This is benefit of watching level II market data.
Level 2 Depth Chart
The market depth chart is the visual representation of the orders and their respective size. The color of the graph in the market depth chart will match the color of the bid/ask data.
In TradingSim the depth is represented with histograms within the Level 2 window. This provides you a clear view of the order size without having to review the numbers of the Level 2 table.
For many, it’s just much easier to see the red and green charts to gauge which way the market is moving. However, color coding the depth chart allows you to see just how many exchanges have similar bids or offers sitting at a single price.
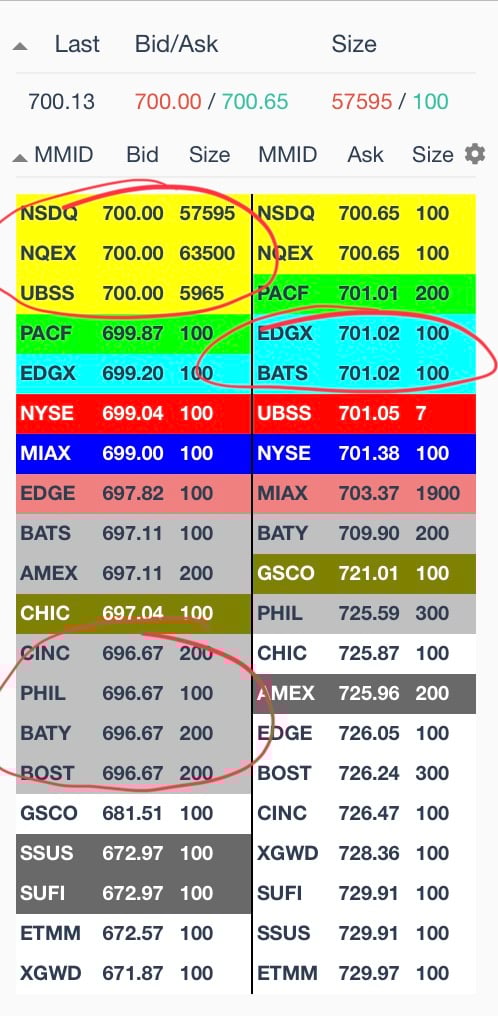
How to use level 2 market data
Notice the blocks we have circled. This gives you an idea of the depth of market in the level 2. This gives you an indication of how many orders may be stacking up at certain levels. This L2 data can then be used to make informed trading decisions based upon key levels.
Speed of Order Flow
At this point, we have discussed the structure of Level 2 data, but now it’s time to see it in action. In the below video we have taken a one-minute snapshot view of the order flow for the QQQ.
The QQQ is a popular security for day traders, so this will give you a good feel for the speed of the tape (a.k.a. Level 2).
Keep in mind that the speed of the order flow may increase during times of volatility, especially near the market open. The best way to study this is to have a replay service like TradingSim to slow things down in case you missed quick orders getting filled.
When to Read the Level 2 Tape
If you stare at Level 2 screens all day, you are going to get a headache. However, the best time to use L2 is at critical price levels. [2]
For example, if you are looking to buy a stock on a breakout, you can look at Level 2 to see the quality of the order flow to determine if a breakout has legs.
On that token, a key point to remember is that a stock can show a sign of strength for a brief moment in on a market depth chart, but ultimately fail.
This is where you have to really watch the order flow in the level 2 order book to begin to “feel” the market. This, my friend, takes time and is not something that you can just pick up after watching the market for a few days.
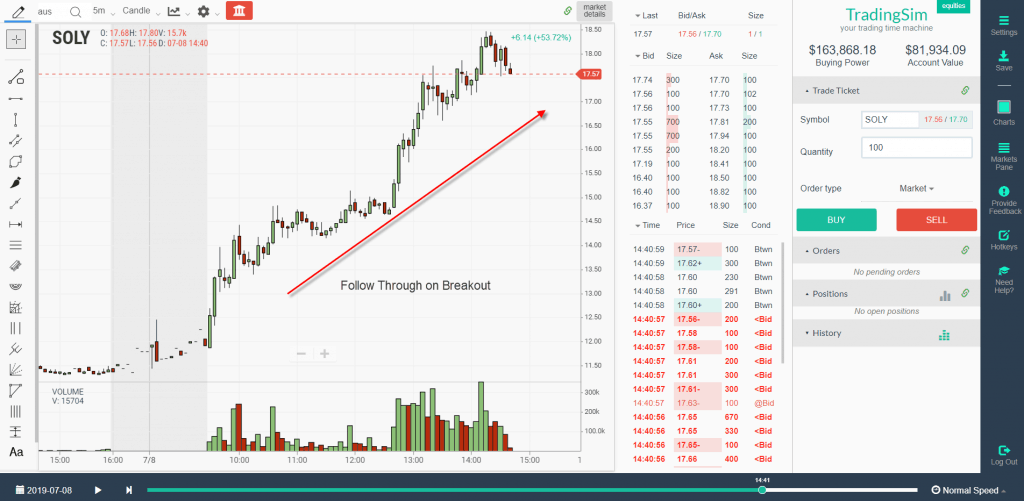
Breakout Example
Check out this video of a breakout as a stock approaches a key resistance level. The video is short, but you can see that the level 2 order flow at the resistance level picks up and the asking price continues to spike higher as sellers look for higher prices to execute trades.
Also, you will notice how the order flow accelerates at the breakout level and most importantly the price is able to hold this key level. Often, it is the price reaction coupled with the level 2 stock data that gives you the best picture.
So, what was the result of this positive level 2 trading action at the breakout point? You guessed it, higher prices.
Follow Through on Breakout
Do not look at this and assume all trades will work in this fashion. The key point from observing Level 2 is to gauge if the move is sustainable.
There is no exact method for making this observation. Anyone telling you that is oversimplifying the process of trading with L2 data. You will need to put in the hard work of observing market depth to assess signals from this off-chart indicator.
Where Level 2 Gets Tricky
Learning how to use Level 2 market data can prove challenging for the untrained eye. You see the orders flying, time and sales streaming, and green and red histogram bars sliding in and out.
It’s honestly a lot to absorb and make sense of.
The other thing is large institutions are now using AI to send buy and sell orders. [3] Not to mention, dark pools and other hidden orders can show up on charts when they don’t show up in the Level 2 data.
This can make it tricky to know if the orders in the depth are “real”. This practice of placing fake orders is spoofing and is illegal. Here is a link from the CFTC that highlights a case where a firm was found guilty of spoofing. These regulations have helped, but there still is a bit of grey area around how to read level 2 market data orders.
How to Combat the Robots
Ultimately, there is nothing you can do to stop these fake orders. The best thing you can do is to not solely rely on the tape for your trading strategy.
As with any strategy, you need to compliment your level 2 trading with chart reading skills. We have a lot of great articles on this site that teaches volume and price action trading.
In addition, check out this great piece from tradingshools.org which touches on this subject of spoofing.
Level II Order Flow with Thinly Traded Stocks
L2 is an awesome tool for stocks that trade with volume. However, stocks with light volume or wide spreads inform you very little about where a stock is likely to trend.
This is because the L2 window will have little to no order flow. So, it becomes extremely difficult to use L2 as an effective forecasting tool.
If you’re inclined to trade thinly traded stocks, keep in mind the issues associated with liquidity and potential liquidity traps. Often it is better look at higher time frame key volume levels rather than focus on the intraday level 2 data.
How Can TradingSim Help?
TradingSim offers a full Level 2 montage as part of it’s trading application. As we mentioned before, there is no better way to learn reading a depth chart by using level 2 data than by recording your screen or watching a replay.
With TradingSim, you don’t have to worry about recording. There is no need to store all that data on your hard drive. Not to mention, there are thousands of stocks in the market. We make it easy to replay every single one of them for up to 3 years worth of intraday data.
This will allow you to develop the muscle memory to master order flow to improve your trading results.
Level 2 is a tool, not gospel. Here are the situations where I stop relying on it:
Thinly traded stocks. With light volume, the L2 ladder looks empty. Use higher-timeframe levels and check RVOL first.
Pre-market and after-hours. Spreads widen, and a single market maker can swing the appearance of depth. See our pre-market trading guide for the right read.
Halt resumes. The initial print is often misleading; let the auction settle.
Major news. Algos pull and re-post orders in milliseconds. Trust price more than depth.
Earnings overnight. Hidden orders from institutions distort the visible ladder.
How to Combine Level 2 with Chart Patterns
The L2 tape is most useful as a confirmation tool layered on top of a setup you already trust:
Webull — one of the better free L2 implementations.
Interactive Brokers, thinkorswim, and other professional platforms offer deeper exchange-level data.
If you can’t pay for L2 yet, practice reading the tape inside TradingSim’s replay simulator.
Frequently Asked Questions
What is Level 2 trading data?
Level 2 trading data is the full order book for a stock — every bid and ask order resting at each exchange, with size and depth. It shows where buyers and sellers are stacking liquidity, beyond just the best bid/offer that a Level 1 quote shows.
How do you read a Level 2 depth chart?
Read the bid side (buyers) on one side and the ask side (sellers) on the other. Each row shows price, size, and exchange. Watch which side is getting eaten through and where larger resting orders sit — those are your near-term support and resistance levels.
Is Level 2 data worth it for day traders?
Yes, but only at the price levels that matter — breakouts, breakdowns, gap fills, and the open. Staring at Level 2 all session is exhausting and noisy. The traders who get real value out of it use it as a confirmation tool at decision points, not as a primary signal.
Can Level 2 quotes be faked?
Yes. Spoofing — placing large orders with no intent to fill — is illegal but still happens. Hidden orders and dark-pool prints also distort the picture. Always pair Level 2 with price action and volume, never trust the tape alone.
Where can I get free Level 2 quotes?
Most retail brokers (Webull, TradingView, Interactive Brokers, Schwab/thinkorswim) offer Level 2 data, sometimes free and sometimes for a monthly exchange fee. For risk-free practice, you can use TradingSim's replay simulator to see Level 2-style order flow on historical sessions.
Practice Reading Level 2 Risk-Free
The only way to actually develop a feel for the tape is reps. TradingSim’s day trading simulator lets you replay any historical session tick-by-tick, including the order book, so you can build pattern recognition without risking real capital. Start a free trial and run today’s session before tomorrow opens.
Alton Hill is the Co-Founder of TradingSim with over 18 years of trading experience. He completed the Design Thinking Bootcamp at Stanford’s D.School and brings expertise in Product Development to create the best trading simulation experience. His strategy focuses on trend-following systems, targeting high-volatility stocks with strong primary trends using the 15-minute chart.
Learn How to Day Trade a Stock with a News Catalyst [Video]
Do you want to learn how to day trade a stock with a news catalyst. In this example, we are covering a buyout or takeover rumor on HOG: Harley Davidson. On Friday, July 1, it was rumored that KKR was...
We have all enjoyed it, and later suffered from it. Yes, the experience of placing the first order in the market has been often like the first kiss. You do not know what to expect, yet you believe...
What are trade alerts? Trade alerts provide the active trader or investor an alert when a specific event occurs. Trading alerts are a basic component of most brokerage firms and trading applications....


 Awesome Day Trading Strategies


