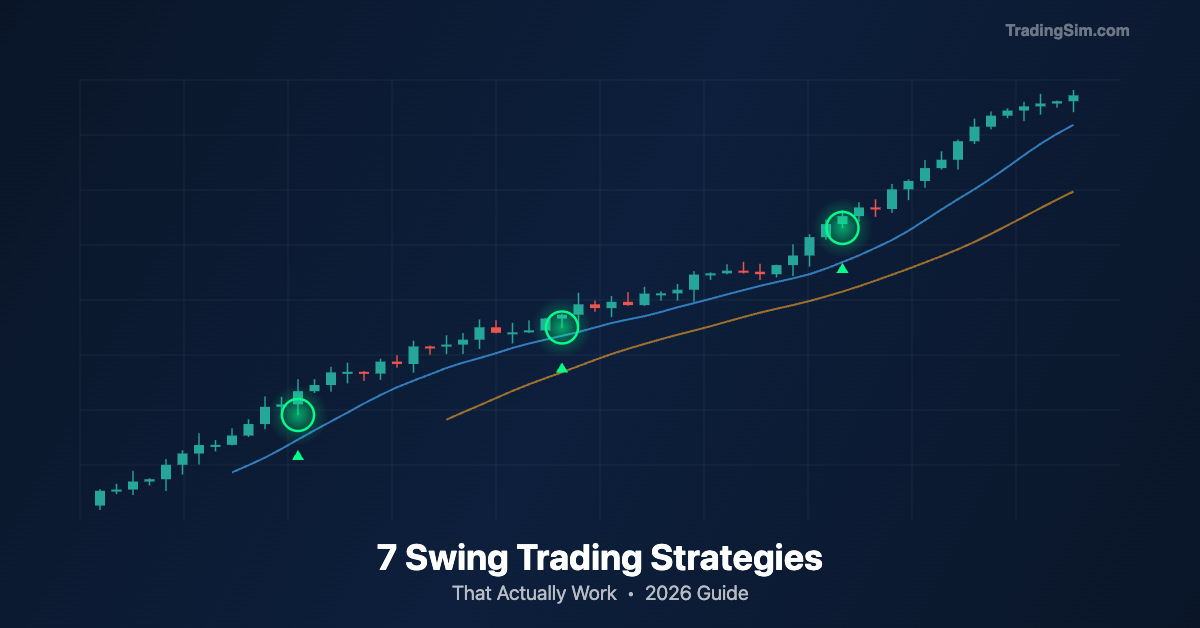
How to Trade with the ADX – (Average Directional Index) | TradingSim
Day Trading Indicators

How to Trade with the ADX – (Average Directional Index)

Table of Contents ADX Overview Contents Chapter 1: ADX Components Chapter 2: How to Interpret the ADX Determining Trend Direction Strength of Trend Chapter 3: Trading with the ADX Setup Types Find...

Day Trading Indicators

Level 2 Quotes – How to Read Market Depth Chart [Videos]

Market depth charts are often a confusing and misunderstood part of trading. Besides just learning to read stock charts, level 2 quotes and order books are a lot like trying to read the matrix....

Chart Patterns

The Head and Shoulders Pattern: How to Trade Tops and Bottoms

The Head and shoulders pattern is a reversal trading strategy, which can develop at the end of bullish or bearish trends. It is often referred to as an inverted head and shoulders pattern in...

Chart Patterns

Rising and Falling Wedge Patterns: How to Trade Them

Rising and falling wedges are a technical chart pattern used to predict trend continuations and trend reversals. In many cases, when the market is trending, a wedge pattern will develop on the chart....

Day Trading Basics

How to Find the Most Active Stocks to Day Trade + Free Video Tutorials!

Table of Contents Finding the Most Active Stocks to Day Trade [Video] Start Your Day Early Searching Pre-Market Gainers #1   Find the Best Stocks to Day Trade with Biggest Pre-market Movers Setting...

Candlesticks

The Stick Sandwich Candlestick Pattern + Chart Examples

Candlestick patterns have been around for centuries. They are very useful in finding reversals and continuation patterns on charts. While we discuss them in detail in other posts, in this post we...

Day Trading Indicators

Gann Square of Nine – How to Trade Using This Forecasting Tool

Considered one of the “titans of technical analysis,” Gann and his Gann Square have gone down in trading history with the likes of Dow, Wyckoff, and others. In this post, we’ll give you a brief...

Prev 1 2 3 4 5