Volume Analysis — 4 Simple Trading Strategies Using Chart Patterns [Updated April 2026]
Apr 22, 2026
Written by: Al Hill
✓ Reviewed by Kunal Vakil, Co-Founder of TradingSim · Updated Apr 22, 2026
Volume analysis is the technique of assessing the health of a trend based on volume activity. In fact, volume is one of the oldest day trading indicators in the market. The volume indicator is the most popular indicator used by market technicians as well. Trading platforms may lack certain other indicators; however, you would be hard-pressed to find a platform that does not include volume.
Why is Volume Analysis Important?
In addition to technicians, fundamental investors also analyze volume — taking notice of the number of shares traded for a given security. This gives them a sense of the supply and demand present.
Regardless of your preferred volume trading strategy or investing style, volume analysis [1] is one of the simplest methods for observing buying and selling activity of a stock at key levels.
However, not all volume readings are straightforward. Many times volume can provide conflicting messages. To that end, your ability to assess what volume is telling you in conjunction with price action can be a key factor in your ability to turn a profit in the market.
In this article, we will cover how to assess the volume indicator to help us determine the market’s intentions across four common day trading setups:
In addition, we will discuss advanced volume analysis techniques and apply these methods to assess the strength of the equities and bitcoin markets. But before we do, take a few minutes to prime yourself for the content below by watching this video on volume analysis:
What is Volume?
Very simply, volume represents all the recorded trades for a security during a specified period. This specified period can range from monthly charts to 1-minute charts and everything in between.
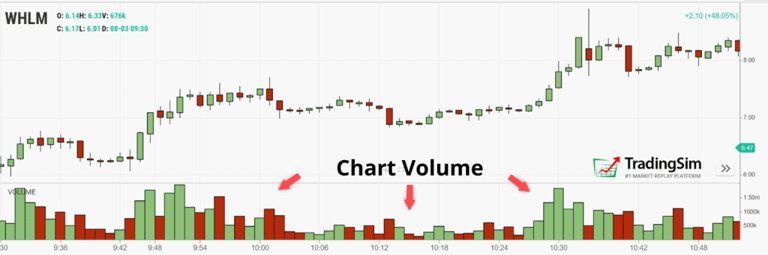
Most trading platforms, Tradingsim included, print each volume bar as either green or red. Green bars are printed if the stock closes up in price for a period and red bars indicate a stock closed lower for a given period.
Volume Indicator
This color-coding need not mean there was more “down or up” volume for the period; it just represents how the stock closed.
One benefit of volume analysis is that it cuts through much of the noise in the Level 2 montage. It does so by giving you a visual representation of where traders are actually placing their money.
Strategy 1: Breakouts and Volume
Breakout trades are arguably the most recognizable strategy in all of trading. Every retail and professional trader knows from day one how to anticipate them. The strategy is simple.
There are two key components to confirm a breakout: price and volume [2]. Along those lines, when stocks break critical levels without volume, you should consider the breakout suspect and prime for a reversal off the highs/lows.
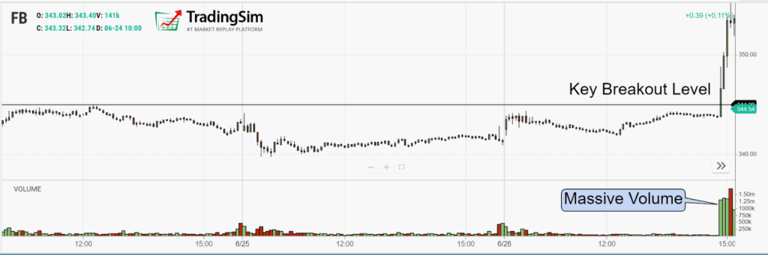
Breakout Example 1:
The below chart is of Facebook on a 5-minute time interval. You will notice that Facebook was up ~15% throughout the day after a significant gap up. Can you tell me what happened to Netflix after the breakout of the early 2015 swing high?
Breakout of Swing High
It just so happens that FB was making a new high on the daily chart, an all-time high to be exact. When you look for stocks that are breaking highs, just look for heavy volume. Volume that exceeds 100% or more of the average volume over the prior 30-90 days would be ideal.
However, a stock making a new a high with 50% or 70% less volume might still work. If we are within the margins, please do not beat yourself up over a few thousand shares.
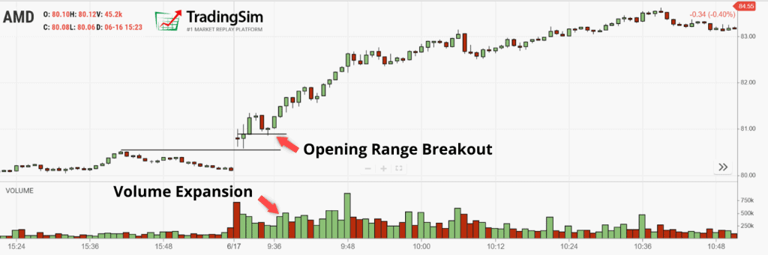
Breakout Example 2:
In a perfect world, the volume will expand on the breakout and allow you to bag most of the gains on the impulsive move higher. Below is an example of this scenario on an AMD breakout using the 1m chart.
Valid Breakout
Hopefully this helps visualize what is happening intraday on these breakouts.
Test Example
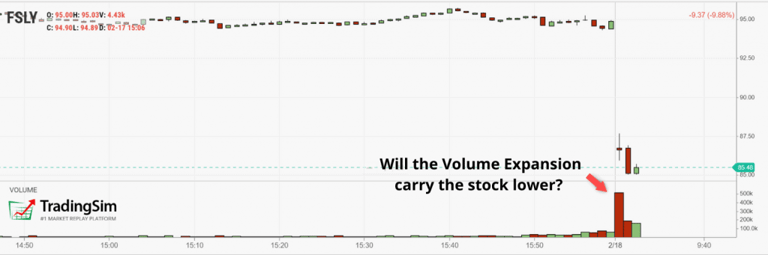
On that token, let’s test to see if you are picking up the concepts of breakouts/breakdowns with volume. Take a look at the below chart without scrolling too far. Can you predict if the stock will continue in the direction of the trend or reverse?
Breakdown or not?
Come on, don’t cheat!
Ok, now you can look:
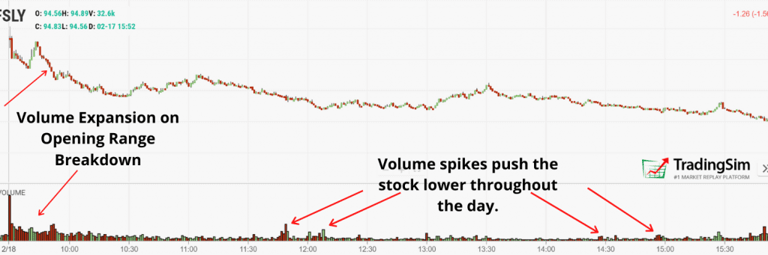
Volume analysis of a breakdown
The correct answer to the question is this: you really have no idea if the stock will have a valid breakout.
However, from the chart you could see that the stock had nice downward pressure on high volume and only one green candle before the breakdown started taking place. This is where experience and money management comes into play, because you have to take a chance on the trade.
You would have known you were in a winner once you saw the volume pick up on the breakdown as illustrated in the chart and the price action began to break down with ease.
Quick Summary
This concept of increasing volume on a breakout was also stated in the book Mastering Technical Analysis. In one excerpt, author Alan Northcott discusses how “[Charles] Dow recognized the importance of volume in confirming the strength of a trend. While a secondary indication, if the volume did not increase in the direction of the trend, this was a warning sign that the trend may not be valid.” [3]
As always, if you take a breakout trade, be sure to place your stops slightly below the high to ensure you are not caught in a trap. This strategy works for both long and short positions. The key is looking for the expansion in volume prior to entering the trade.
Keep these in mind:
The stock has volatile price action with most of the candle color mirroring the direction of the primary trend (i.e. red candles for a breakdown and green candles for a breakout).
On the breakout, volume should pick up.
The price action after the breakout should move swiftly in your favor.
Strategy 2: Trending Stocks and Volume
Trending Stocks
When a stock is moving higher in a stair-step approach, you will want to see volume increase on each successive high and decrease on each pullback. The underlying message is that there is more positive volume as the stock is moving higher, thus confirming the health of the trend.
This sort of confirmation in the volume activity is usually a result of a stock in an impulsive phase of a trend.
Trending Example 1:
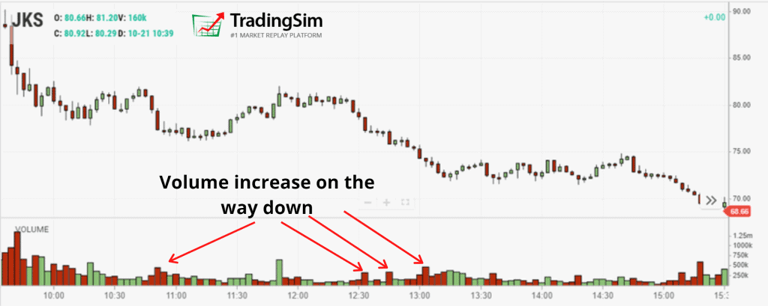
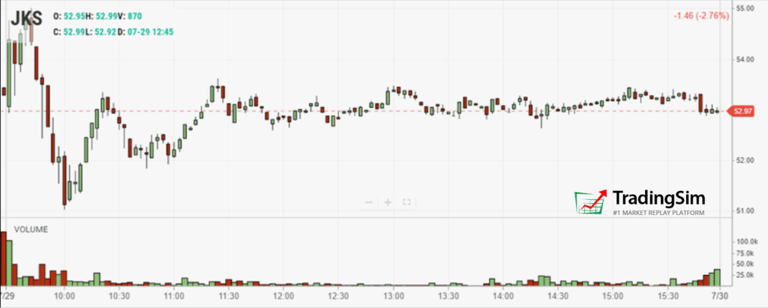
JKS volume analysis – supply increasing
The volume increase in the direction of the primary trend is something you will generally see as stocks progress throughout the day. You will see the strong move into the 10 am time frame, a consolidation period and then acceleration from noon until the close.
For this strategy, you will want to wait for the trade to develop in the morning and look to take a position after 11 am. The idea is to wait for the trend to form, and then follow it with a low risk entry point.
As the stock moves in your favor, you should continuously monitor the volume activity to see if the move is in jeopardy of reversing. The speed of this setup is much slower versus the other strategies discussed in this article; however, the difficulty reveals itself in the increased number of false moves, which can be commonplace in the afternoon.
Failed Examples
To help train your chart eye, here are a few examples of “joining the trend” that didn’t work very well. Along these lines, it’s always best to have stops in play. It never pays to force a trade.
Here, JKS failed to continue breaking down and simply went sideways into the close:
JKS failed breakdown
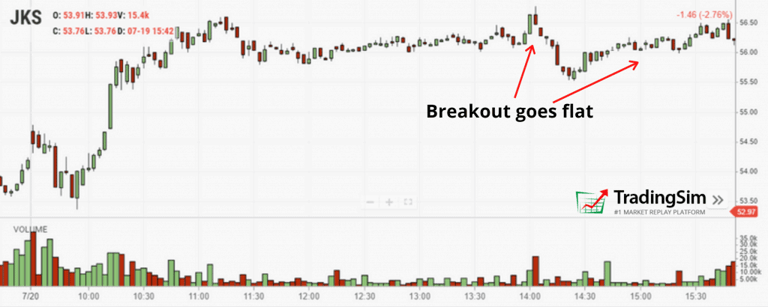
And here is another example of a breakout that simply goes sideways as well.
JKS breakout goes flat
These charts are just a sample of what happens far too often when it comes to afternoon trading. Not all stocks will continue trending all day. It’s just a risk you must accept when trading late day setups. There are some exceptions to this with low float stocks, which we touch on in our vwap boulevard article.
In Summary
Look for volume to push the stock in the direction of the primary trend
You need to be prepared to hold a stock for multiple hours to reap the real rewards
Instead of using volume to predict which stocks will trend all day, simply use volume as an indicator that keeps you in a winning position
Strategy 3: Volume Spikes as a Volume Trading Strategy
Volume Spike
Volume spikes are often the result of news-driven events. But regardless of the cause, the spike is worthy of studying in relation to price action
For all intents and purposes, we define a spike as an increase of 500% or more in volume over the recent volume average. This volume spike will often lead to sharp reversals since the moves are unsustainable due to the imbalance of supply and demand. Trading counter to volume spikes can be profitable, but it requires enormous skill and mastery of volume analysis.
These volume spikes can also be an opportunity for you as a trader to take a counter move position. You need to know what you are doing if you are going to trade volume spikes. The action is swift and you have to keep your stops tight, but if you time it right, you can capture some nice gains.
Let’s walk through a few volume spike examples, which resulted in a reversal off the spike high or low.
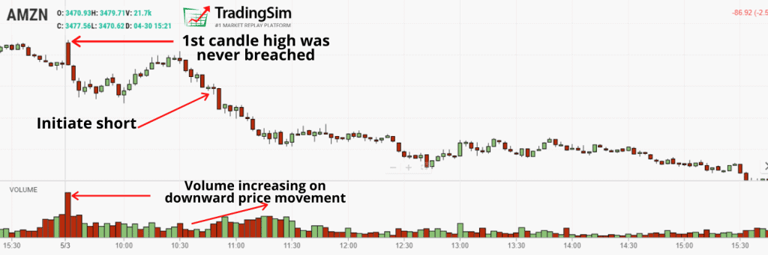
In the below example we will cover the stock Amazon. The stock had a significant gap $20.
Volume Spike Reversal
Notice how the stock never made a new high even though the volume and price action was present. This is a key sign that the bears are in control.
In Summary
The high or low of the first candle is not breached
The first candle has significant volume
The subsequent heavy volume events further establish the reversal in trend from the initial spike after the opening range
Place your stops directly above the high or low of the first candle
Volume Spikes with Long Wicks
Another setup based upon volume spikes candlesticks with extremely long wicks.
In this scenario, stocks will often retest the low or high of the spike. You can take a position in the direction of the primary trend after the stock has had a nice retreat from the initial volume and price spike.
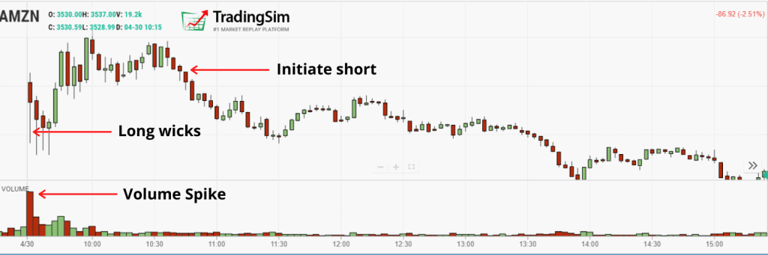
Below is an another example from a 3-minute chart of the stock Amazon, ticker AMZN. You will notice how the stock had a significant gap down and then recovered nicely. Once the recovery began to flatline and the volume dried up, you will want to establish a short position.
AMZN long wicks setup
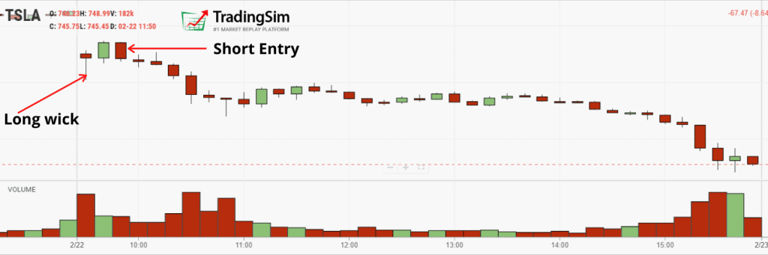
Let’s take another look at a long wick setup. The below chart is of Tesla, ticker TSLA with a long wick down. The stock then recovered and flattened out, which was an excellent time to enter a short position.
Another Long Wick
In Summary
Identify a high volume gap with a long candlestick on the first bar
Wait for the stock to eat into the morning gap and volume to drop off
Take a position in the direction of the primary trend with a price target of the low or high of the wick
Strategy 4: Trading the Failed Breakout
Trading the Failed Breakout
We’d be remiss if we didn’t touch on the topic of failed breakouts. As a day trader, you’re going to have your fair share of trades that just don’t work out. It’s just part of the game.
So, how do you know when a trade is failing? Simple answer – you can see the warning signs in the volume.
Let’s dig into the charts a bit.
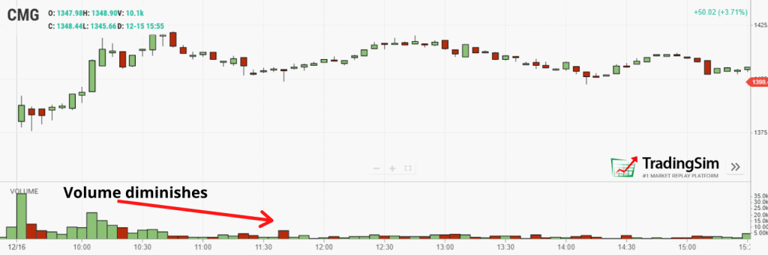
False Breakout 1
Above is the chart of Chipotle Mexican Grill. You can see the stock attempted to break out in the first hour of trading.
Notice how the volume on the breakout attempt started with good effort, but then faded off. With this signature, you shouldn’t be surprised when the stock begins to float sideways with no real purpose. While this would have been a break even trade, more or less, your money is idle. At least you wouldn’t have taken a loss on this one.
The next example was worse.
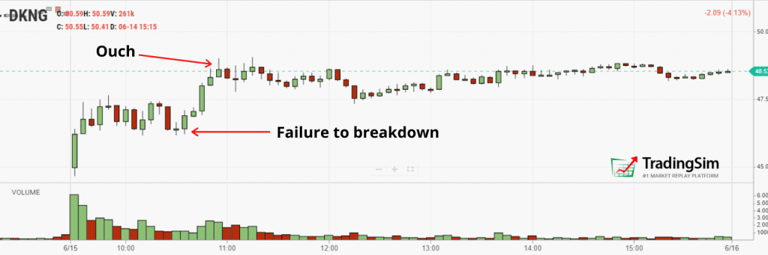
False Breakout 2
The above example of DKNG failed to follow through to the downside, despite gapping down on considerable volume.
Notice how the volume dries up as the stock attempts to make a lower low on the day and break the first bar. The key is to get out if the price action begins to chop sideways for many candles.
When you sit in a stock hoping things will go your way, you are better off making a donation to charity. At least the money will go to a worthy cause.
In Summary
Breakouts often fail
If the volume dries up on the breakout, look to get out within a few candles if things don’t turn around
If you want to play the reversal, wait for a few candles to see if the peak holds and enter a trade counter to the morning gap
You can use the peak of the first candlestick as a logical point to exit the trade
4 Strategies Conclusion
The strategies discussed in this article can be used with any stock and on any time frame. The most important point to remember is you want to see volume expand in the direction of your trade. Keep this in the back of your mind and you will do just fine.
Bonus Content – Bitcoin Volume Analysis
So far in this article, we have covered how to apply volume analysis to identify trading opportunities for day trading.
However, volume can be and is so much more.
To demonstrate the ability to analyze long-term trends, we will use volume to unpack the roaring cryptocurrency market.
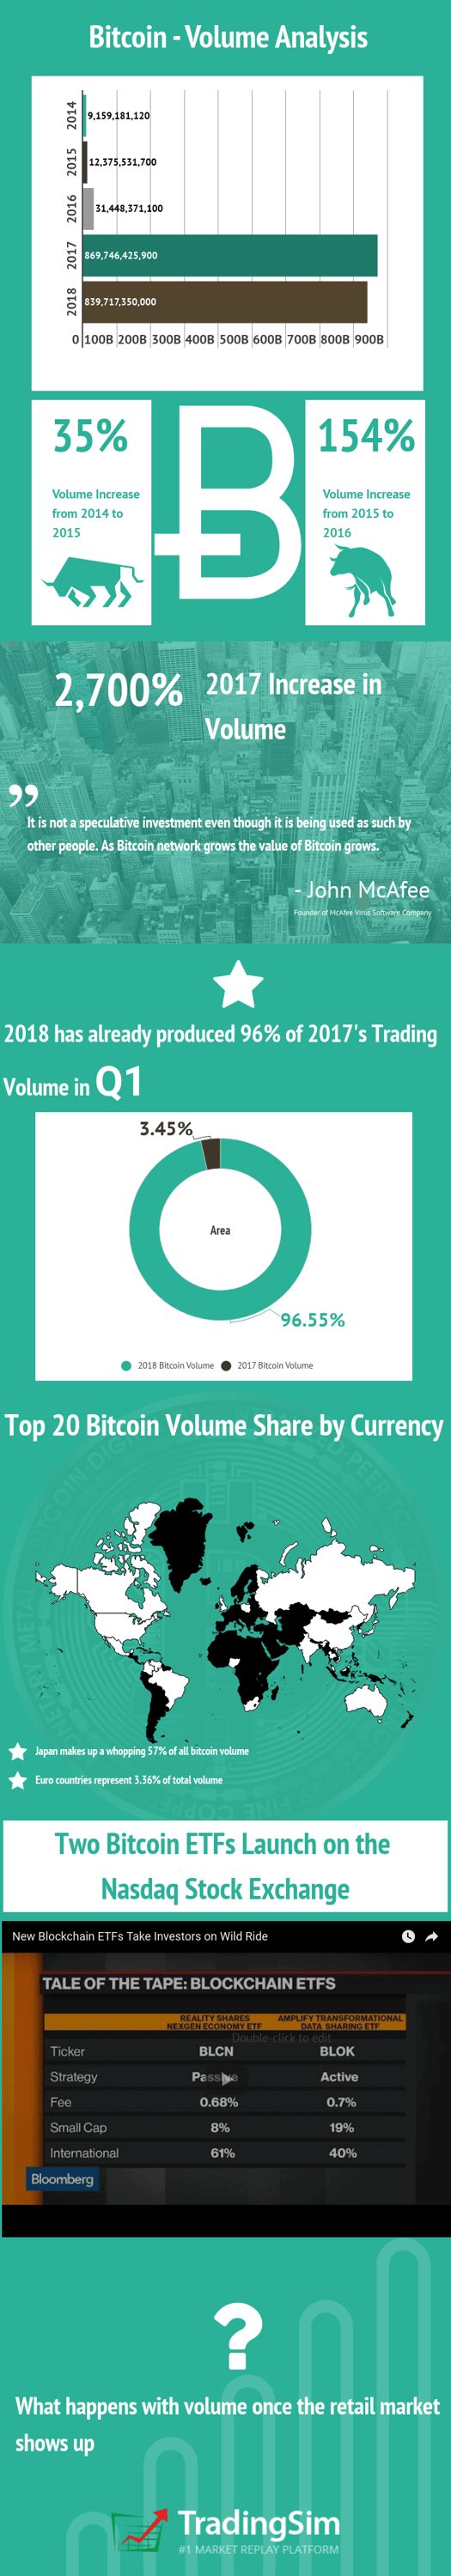
Take a look at the infographic below where we have done some extensive research on volume trends across a four-year period of Bitcoin.
The answer to the question in the infographic has obviously been answered. In 2021 Bitcoin hit a record price of $64900. However, the real story in the infographic, which may not have jumped out is Japan makes up 57% of all the trading volume for Bitcoin, while only accounting for 1.7% of the global population.
Granted, wealth is largely concentrated in the G8 countries, but this sort of multiple is a bit ridiculous.
Early indications show that Japanese retail investors, mostly in their 30s and 40s are using leveraged accounts to trade cryptocurrencies.
This surge of cash inflows into the cryptocurrency market has resulted in the bitcoin blowing out record after record. While there is significant speculative trading going on to drive up the price, we cannot ignore the enormous value bitcoin may have in a global economy.
Volume Analysis for Two Blockchain ETFs
Shifting our focus back on the charts. Let’s take a look at the trading performance of two Blockchain ETFs.
The tickers for these ETFs are BLOK and BLCN. Do not be confused in thinking you are buying into the actual cryptocurrency market if you buy these ETFs.
In case you missed the video in the above infographic, the SEC has not approved ETFs that invest directly in the cryptocurrency market. Sounds a bit confusing right seeing how one of the ETF’s name is BLOK.
The two ETFs have stocks that are directly connected to the crypto industry. In both ETFs, you will find familiar names like Overstock, IBM, Square, and Nvidia.
Enough rambling about the makeup, let’s take it to the charts.
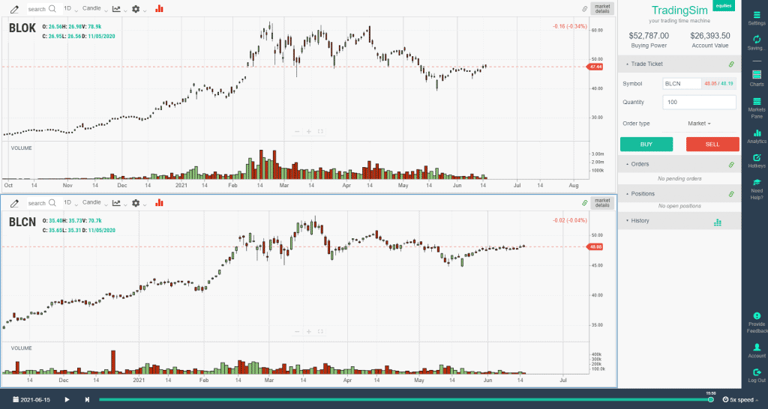
BLOK and BLCN daily charts
From the looks of things, there is little value in buying both ETFs for diversification as they are mirror images of one another. These similarities are still relevant in the realm of volume.
Notice how both BLOK and BLCN have enormous volume into the climactic push to new highs back in March. This coincides with Bitcoins highs as well.
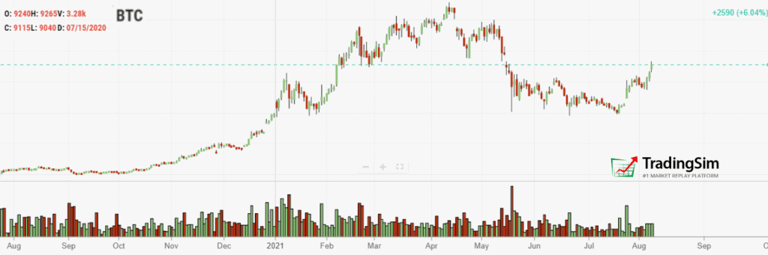
BTC Futures
ETFs can be a good way for someone to get involved in the world of crypto, without buying an actual cryptocurrency.
Now, with that said, if you are looking to take a long shot over the next 5 to 10 years, these ETFs are not going to give you the desired home run affect you are looking for.
Overlay of Volume on Price
Shifting gears back into volume analysis with stocks, the next bonus technique we would like to cover is using a volume overlay with the price.
The overlay is slightly different from printing volume on the x-axis by allowing you to see where the concentration of orders took place.
This can provide you with a clear view into where there are many traders and you can then use this to validate a particular support or resistance level.
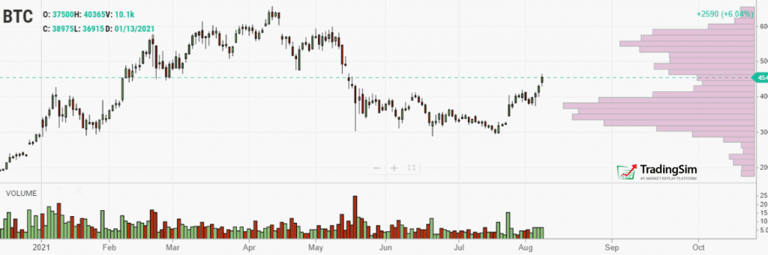
BTC futures with Volume Overlay on Price
The simple way of determining where to focus your attention is on the longest volume bar. Do you see how this view lets you know where all the trades were made for a given security? This layer of information is invisible with volume underneath the chart.
One slight twist to this indicator that you might want to try out is to combine these key volume levels with Fibonacci.
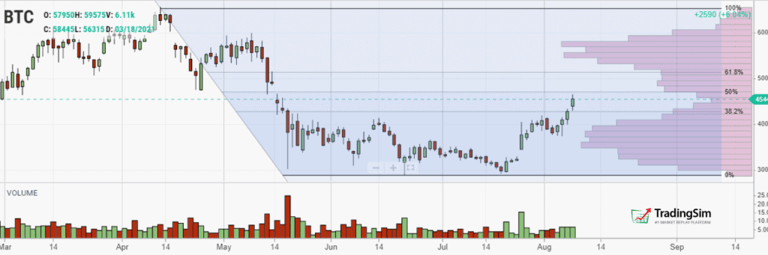
BTC futures with Fibonacci retracement
Notice in the above chart of Bitcoin futures that there was significant support around $30,000 recently.
This coincided with a 100% retracement off the highs. You can also see that significant support and resistance are occurring around the 38.2%, 50%, and 61.8% levels.
The point is you do not only want to use volume and price action. It is also great to add another validation technique like Fibonacci to the chart to gain clues of where the price is likely to break.
3-Year Dow Jones Analysis
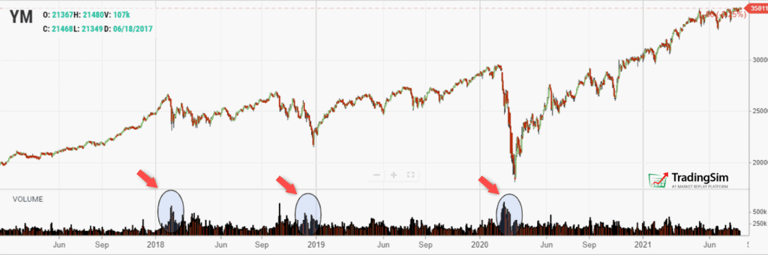
3-Year Dow Analysis
These, folks, are not natural price movements for the index in historical terms.
On the slow run-up, there are many price swings, some of which might have thrown you for a loop in the last 3 years. Meaning, it would have taken serious self-control to stay in the trade.
However, once you overlay the volume you will see there are three key levels: 25,500, 27,000, and 30,000.
The 25,000 level has the most volume over the last 3 years. The index formed a nice triple bottom over a 24-month period leading up to the break of 27,000. For all the Wyckoff traders, the back and forth at the 25,000 level created a ton of cause, which ultimately fueled the rally.
The next level is 27000. Notice how the volume at the 27,000 level is high, but in relative terms over the last 3 years, the volume is light.
This is because the run-up to the high over 26,000 was done on light volume.
Once 27,000 was broken, the Dow then ran up to over 30,000. The Dow is now bouncing around the 35,000 level. In relative terms, the 35,000 level is now the high-level volume zone which may act as resistance.
Are you now able to see how volume on top of price allows you to cut through all the head fakes to see the same levels the smart money cares about?
In Summary
Volume alone cannot provide you buy and sell signals. Volume can, however, provide you with further insights into the internal health of a trend.
Remember, you can look at the volume on the x-axis (time) and on the y-axis (price) to identify potential changes in trend and support/resistance levels.
Tradingsim accelerates the steep learning curve of becoming a consistently profitable trader by allowing you to replay the market as if you were trading live on any day from the last 3 years. It’s really a trading time machine!
To see how Tradingsim can help improve your bottom-line, please visit our homepage.
What is volume analysis? Volume analysis is the practice of reading the number of shares (or contracts) traded during a given period to validate or invalidate price action. Volume is the oldest confirmation tool on the chart, predating every oscillator ever invented. The rule is simple: a price move on high volume is credible; the same move on thin volume is suspect.
The four core signals:
Volume confirming trend: higher highs in price accompanied by rising volume = healthy trend.
Volume divergence: price prints new highs on falling volume — exhaustion warning.
Volume climax: one bar prints 3x to 10x the average volume at the end of a move — often marks a short-term top or bottom.
Volume dry-up: a consolidation prints very low volume — often precedes a breakout.
Indicators that quantify volume:
OBV (On Balance Volume): running total — adds volume on up-days, subtracts on down-days.
VWAP: the session's volume-weighted average price — the benchmark institutional traders watch.
A/D Line (Accumulation / Distribution): weights volume by where price closes in the bar's range.
Volume Profile: plots volume traded at each price level instead of across time — reveals HVNs and LVNs.
When volume analysis wins
Breakouts: a breakout on 2x-3x average volume sticks. A breakout on normal volume gets faded.
Reversals: a volume climax bar after a long trend is the tape's loudest reversal signal.
Gap fills: if a gap fills on heavy volume, expect continuation. If it fills on light volume, fade the move.
Practice Volume Setups in the TradingSim Simulator
Volume is the single most underused tool in most beginner traders' stacks. Open the TradingSim day trading simulator, load a month of market data, and mark every single bar that prints 3x or more its 20-bar average volume. Then check what price did over the next 5 bars. You will start seeing patterns — volume climaxes, dry-ups, and confirmation bars — that no indicator can fake. Repeat the study on 50 bars per ticker and you will trust volume the same way Al Hill does.
The definition is relative. A bar printing 2x to 3x its 20-bar average volume is typically labeled "high volume." A bar printing 5x to 10x is a volume spike. Beginners should compare against the ticker's own average, not a fixed number.
Which is more important — price or volume?
Price is primary — it tells you where the market is. Volume is secondary — it tells you how much conviction is behind the move. The two read together are more informative than either alone.
What is a volume climax?
A volume climax is a single bar (or short cluster of bars) that prints far above average volume — typically 3x to 10x — at the end of an extended move. It often marks exhaustion and a short-term reversal.
What is OBV (On Balance Volume)?
On Balance Volume is a cumulative line that adds the bar's volume on up-days and subtracts it on down-days. Rising OBV while price is flat or falling is a bullish divergence; falling OBV while price is flat or rising is a bearish divergence.
What is Volume Profile?
Volume Profile plots volume traded at each price level over a specified period, rather than over time. It highlights high-volume nodes (HVN), which tend to act as magnets, and low-volume nodes (LVN), which tend to be traversed quickly.
Alton Hill is the Co-Founder of TradingSim with over 18 years of trading experience. He completed the Design Thinking Bootcamp at Stanford’s D.School and brings expertise in Product Development to create the best trading simulation experience. His strategy focuses on trend-following systems, targeting high-volatility stocks with strong primary trends using the 15-minute chart.
Volume at Price Overview Have you just heard about the volume at price and are wondering what’s the big deal? Well, you have landed at the right place. In this post, I will discuss how to interpret...
For a beginner to futures trading and sometimes even professional futures traders, keeping track of the trading hours for the various futures contracts can get a bit overwhelming especially when it...
Volume Profile Trading Strategies for Day Traders [Updated April 2026]
What Is Volume Profile? A Volume Profile is a volume-by-price trading indicator that shows the total trading activity or volume traded at each price level over a specified period. This contrasts the...


 Volume Indicators


