Price Action Trading Strategies 6 Patterns that Work [video tutorial] [Updated July 2026]
Jul 21, 2026
Written by: Al Hill
✓ Reviewed by Kunal Vakil, Co-Founder of TradingSim · Updated Jul 22, 2026
Key Takeaways
Price action trading reads raw price movement and candlestick structure instead of relying on lagging indicators.
The six core patterns covered here give you repeatable entry, stop, and target rules.
Support, resistance, and trend context determine whether a price action signal is worth taking.
Combining a clean chart with volume confirmation filters out most low-quality setups.
Backtesting price action patterns on the TradingSim simulator builds pattern recognition faster than live trading alone.
Price action trading strategies are dependent solely upon the interpretation of candles, candlestick patterns, support, and resistance, pivot point analysis, Elliott Wave Theory, and chart patterns[1]. It is often confused with Volume and Price Analysis (VPA), where volume is interpreted with the price action to paint a clearer picture of the stock’s story.
In this post, we’ll examine a handful of the best price action strategies and patterns to help you develop your “chart eye”. We’ve also put together a short video to help with some of the advanced concepts we discuss. Please have a watch as a primer for the content below.
Click for sound
18:25
Overview of Price Action Charts
When looking at some traders’ charts, it can be difficult to determine if you are looking at a stock chart or hieroglyphics. When you see a chart with too many indicators and trend lines, it is likely a trader trying to overcompensate for lack of certainty. In other words, they may not understand price action.
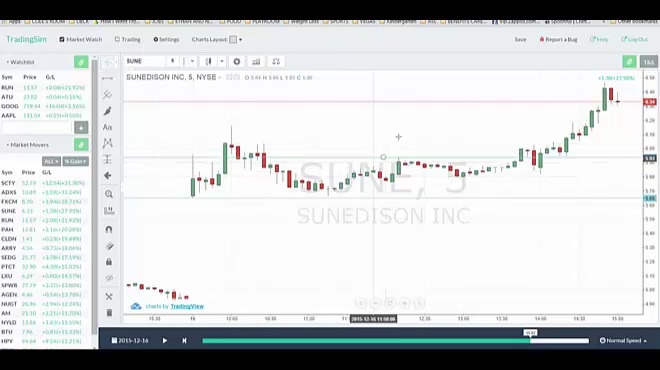
Here’s an example of some traders’ charts that look something like the picture below.
Too Many Indicators
There are some traders that will have four or more monitors with charts this busy on each monitor. When you see this sort of setup, you hope at some point the trader will release themselves from this burden of proof.
Every trader has their own style, for sure. But at the end of the day, price is the final arbiter. And it would behoove all traders to learn how to read the tape.
Clean Charts
What if we lived in a world where we just traded price action strategies? A world where traders picked simplicity over the complex world of technical indicators and automated trading strategies.
When you remove all the clutter from the trades, all that remains is the price.
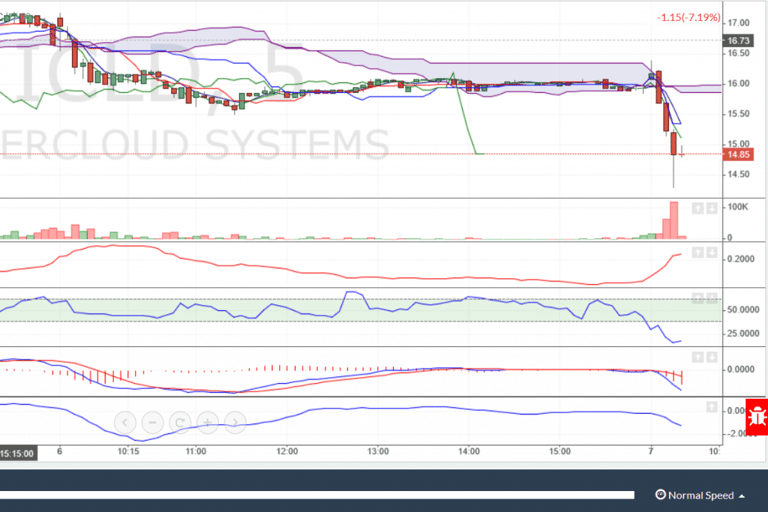
To see a chart minus all the indicators, take a look at the following image and compare it to the previous one:
Price Action Trading Charts
At first glance, it can almost be as intimidating as a chart full of indicators. Like anything in life, we build dependencies and handicaps from the pain of real-life experiences. If you have been trading with your favorite indicator for years, going down to a bare chart can be somewhat traumatic.
While price action trading is simplistic in nature, there are various disciplines. As mentioned above, the disciplines can range from Japanese candlestick patterns, support & resistance, pivot point analysis, Elliott Wave Theory, and chart patterns[1].
From here on, we will explore the six best price action trading strategies and what it means to be a price action trader.
Price Action Trading Strategy Basics
Before we dive into the price action trading strategies, you need to understand the four pillars of the price action indicator.
Candlesticks
Bullish Trend
Bearish Trend
Flat Market
If you can recognize and understand these four concepts and how they are related to one another, you’re well on your way.
Pillar 1 – Candlesticks
Candlesticks are the most popular form of charting in today’s trading world. Historically, point and figure charts, line graphs and bar graphs were more important.
Not to make things too open-ended at the start, but you can use the charting method of your choice. There is no hard line here.
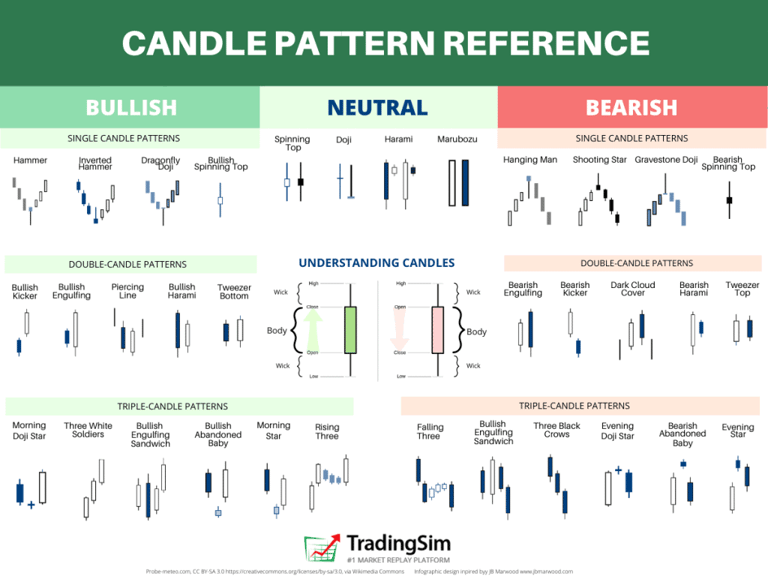
However, for the sake of not turning this into a thesis paper, we will focus on candlesticks. The below image gives you the structure of a candlestick. To learn more about candlesticks, please visit this article that goes into detail about specific formations and techniques.
Feel free to download our candlestick reference guide:
The key point to remember with candlesticks is that each candle is relaying information, and each cluster or grouping of candles is also conveying a message. You have to begin to think of the market in layers.
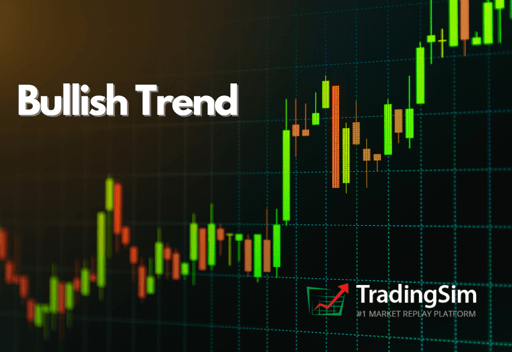
Pillar 2 – Bullish Trend
This is a simple item to identify on the chart, and as a retail investor, you are likely most familiar with this formation.
A bullish trend develops when there is a grouping of candlesticks that extend up and to the right.
Think of a squiggly line on a 45-degree angle.
The key thing to look for is that as the stock goes on to make a new high, the subsequent retracement should never overlap with the prior high. This ensures the stock is trending and moving in the right direction. In other words, higher highs and higher lows.
Make sense?
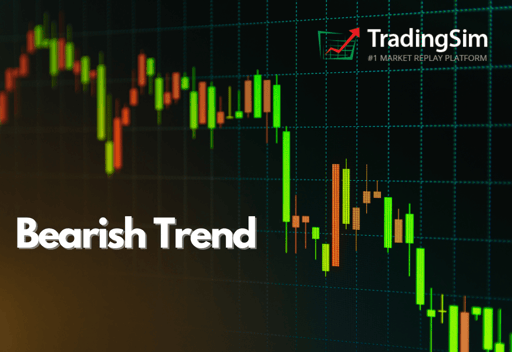
Pillar 3 – Bearish Trend
Bearish trends are not fun for most retail traders. Shorting (selling a stock you do not own) is something many new traders are not familiar with or have any interest in doing. However, if you are trading, this is something you will need to learn to be comfortable with doing.
This formation is the opposite of the bullish trend. The trend is right the opposite: lower highs and lower lows.
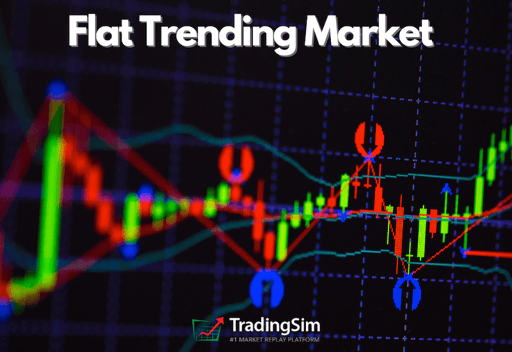
Pillar 4 – Flat Market
Get ready for this statement, because it is big. In general terms, the market is in a flat trading range approximately 70% [2] of the time according to author Heikin Ashi Trader, which is the pen name of a trader with over 15 years of futures and forex experience.
Rarely will securities trend all day in one direction. You will set your morning range within the first hour, then the rest of the day is just a series of head fakes.
If you can re-imagine the charts in these more abstract terms, it is easy to size up a security’s next move quickly.
Flat markets are the ones where you can lose the most money as well. Your expectations and what the market can produce will not be in alignment. When the market is in a tight range, big gains are unlikely. The main thing you need to focus on in tight ranges is to buy low and sell high.
6 Price Action Trading Strategies
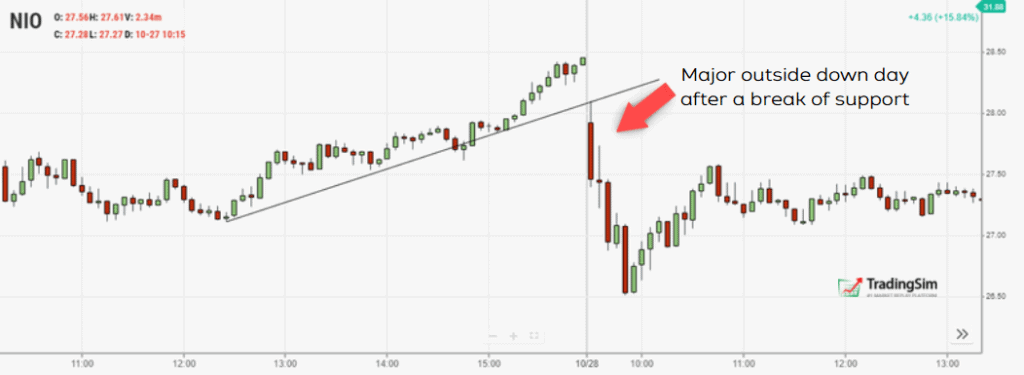
#1 – Outside Bar at Support or Resistance
For those unfamiliar with an outside bar, an example of a bullish outside bar is when the low of the current day exceeds the previous day’s low, but the stock rallies and closes above the previous day’s high.
The bearish example of this would be the same setup, just the opposite price action.
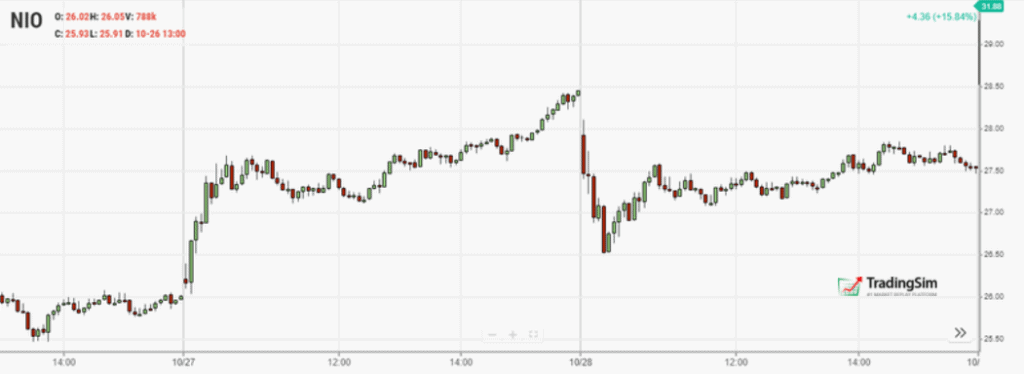
Outside down day price action
Therefore, it’s not just about finding an outside candlestick and placing a trade. As you can see in the above chart of NIO, it’s best to find an outside day after a major break of a trend. In the NIO example, there was an uptrend for almost 3 hours on a 5-minute chart prior to the start of the breakdown.
After the break, NIO finished with an outside down day, which then led to a nice sell-off into the early afternoon.
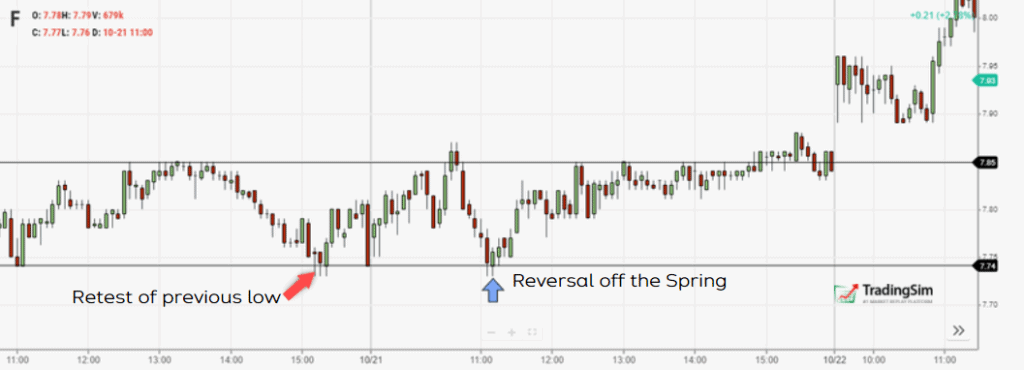
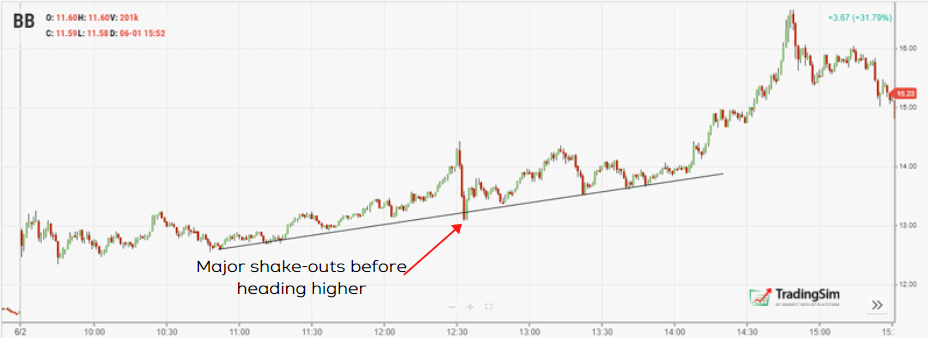
#2 – Spring at Support
A spring occurs when a stock tests the low of a trading range, only to quickly come back into the range and kick off a new trend. According to Jim Forte, “springs, shakeouts, and tests usually occur late within the trading range and allow the market and its dominant players to make a definitive test of available supply before a markup campaign will unfold.”1.
Volume can help when confirming a spring; however, the focus of this article is to explore price action trading strategies, so we will zone in on the candlesticks alone.
The one common misinterpretation of springs among traders is the need to wait for the last swing low to be breached. Just to be clear, a spring can occur if the stock comes within 1% to 2% of the swing low.
Trading setups rarely fit your exact requirement, so there is no point in obsessing over a few cents. To illustrate this point, please have a look at the below example of a spring setup.
Spring reversal
Notice how the previous low was never completely breached, but you could tell from the price action that the stock reversed nicely off the low. Thus, a long trade was in play.
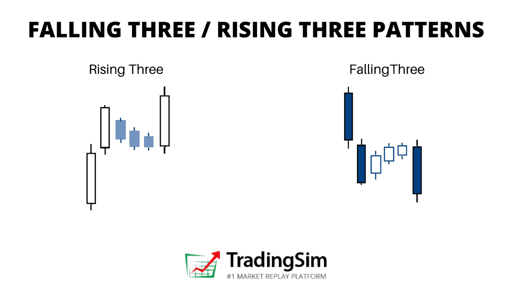
#3 – Inside Bars after a Breakout
Inside bars occur when you have many candlesticks clumped together as the price action starts to coil into resistance or support. The candlesticks will fit inside of the high and low of a recent swing point as the dominant traders suppress the stock to accumulate more shares.
In theory, it looks something like this:
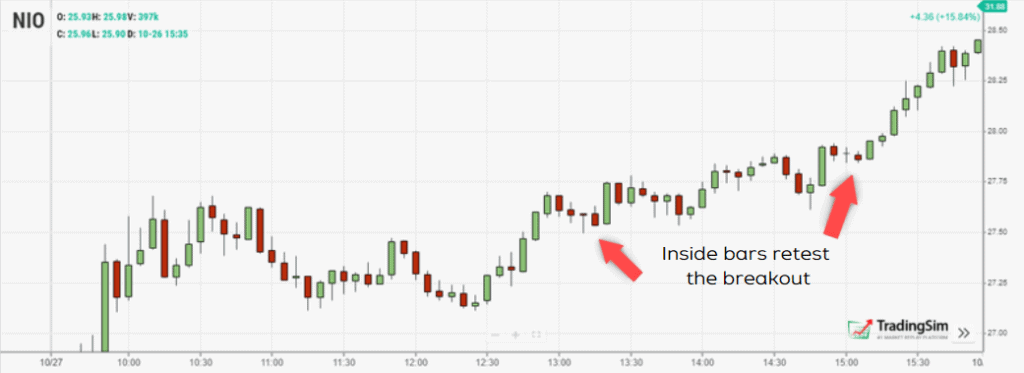
To illustrate a series of inside bars after a breakout, please take a look at the following intraday chart of NIO.
This chart of NIO is truly unique because the stock had a breakout after the fourth or fifth attempt at busting the high. Then there were inside bars that refused to give back any of the breakout gains. NIO then went on to rally the rest of the day.
Please note inside bars can also occur prior to a breakout, which may strengthen the odds the stock will eventually breakthrough resistance.
The other benefit of inside bars is that gives you a clean area of support to place your stops under. This way you are not basing your stop on one indicator or the low of one candlestick.
This is popular strategy, and for good reason. These quick pullbacks often forecast higher price movements.
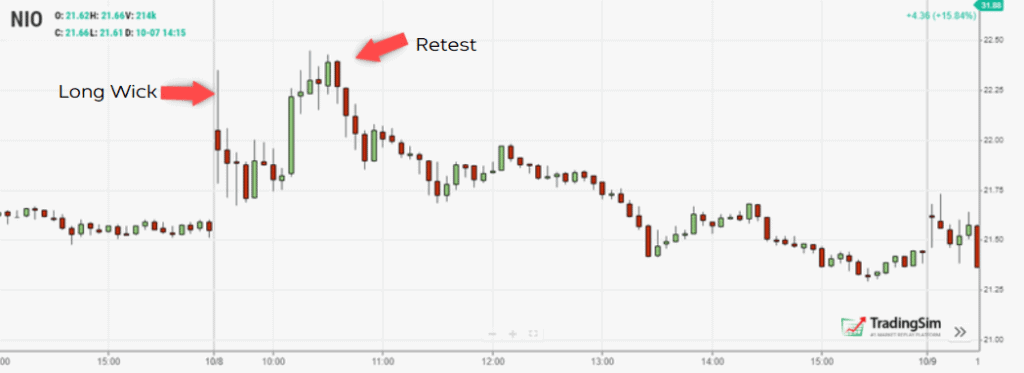
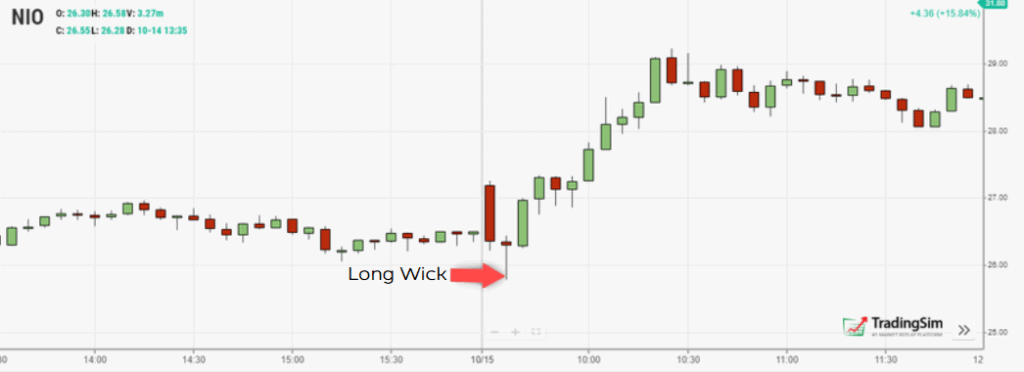
The setup consists of a major gap up or down in the morning, followed by a significant push, which then retreats. This price action produces a long wick. Often times, this price action is likely to be re-tested.
The reason for this is that many traders will enter these positions late, which leaves them all holding the bag upon reversal. Once they are shaken out, the counter pressure will be weak comparatively, and the stock typically goes up again. This usually leads to a push back to the high.
Let’s look at a few examples:
Long wick price action trading example 1
Long wick price action trading example 2
Are you able to see the consistent price action in these charts?
Notice after the long wicks NIO printed a handful of insider bars in either direction before breaking out or breaking down. After this break, the stock proceeded in the direction of the new trend.
#5 – Measuring Length of Intraday Swings
Have you ever heard the phrase, “history has a habit of repeating itself”? Well, trading is no different.
As a trader, it’s easy to let your emotions, and more specifically – hope, take over your sense of logic. We tend to look at a price chart and see riches right before our eyes.
Well, that my friend is not always the reality. Let’s build on this thought.
In the world of trading there are often dominant players that consistently trade very specific securities?
These traders live and breathe their favorite stock. Given the right level of capitalization, these select traders can also control the price movement of these securities.
Knowing this, what can you do to better understand the price action of securities you are not intimately acquainted with on a daily basis?
A good place to start is by measuring the price swings of prior days.
As you perform your analysis, you will notice common percentage moves will appear right on the chart. For example, you may notice that the last 5 moves of a stock were all 5% to 6%.
If you are swing trading, you may see a range of 18% to 20%. Bottom line, you shouldn’t expect stocks to all of a sudden double or triple the size of their previous swings.
Sure, the market is limitless and can produce outlier days. However, it’s better to play the odds with the greatest chance versus swinging for the fences. Over the long haul, slow and steady always wins the race.
Example
To further illustrate this point, let’s go to the charts.
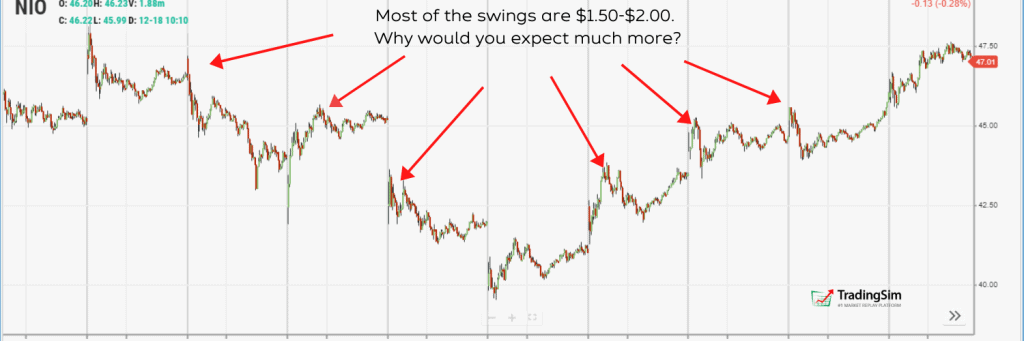
Measure the Swings
Notice how NIO over a 2-week period experienced many swings. However, each swing was on average $1-$2. While this is a 5-minute view of NIO, you’ll see the same relationship of price on any time frame.
As a trader, do you think it would make sense to expect $5, $10, or $15 dollars of profit on a day trade? At some point, the stock will make that sort of run, but there will likely be more $1-2 moves before that occurs.
To that point, if you can trade each of these swings successfully, you get the same effect of landing that home run trade without all the risk and headache.
#6 – Little to No Price Retracement
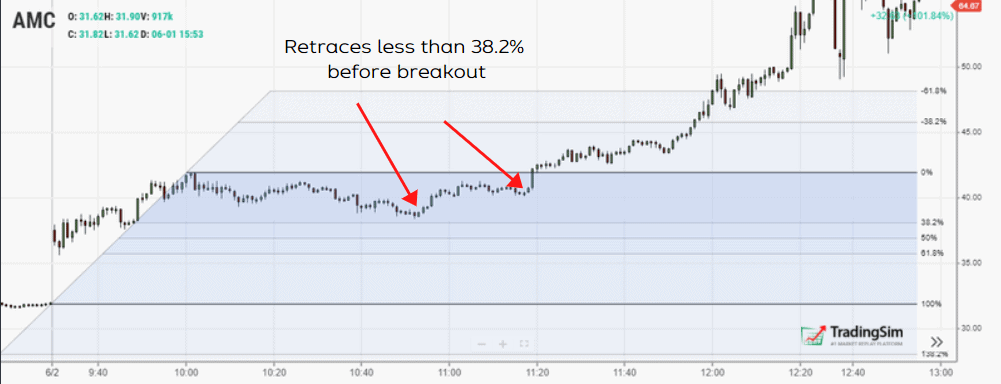
Without going to deep on Fibonacci (we’ve saved that for another post), it can be a useful tool with price action trading. At its simplest form, less retracement is proof positive that the primary trend is strong and likely to continue.
Smaller retracement
The key takeaway is you want the retracement to be less than 38.2%. If so, when the stock attempts to test the previous swing high or low, there is a greater chance the breakout will hold and continue in the direction of the primary trend.
This is especially true once you go beyond the 11 am time frame. This is because breakouts after the morning tend to fail. So, in order to filter out these results, you will want to focus on the stocks that have consistently trended in the right direction with smaller pullbacks.
Using Time to Your Advantage
Trading comes down to who can realize profits from their edge in the market. While it is easy to scroll through charts and see all the winners in hindsight, it is much more difficult in real time. The market is one big game of cat and mouse.
Between the quants and smart money, false setups show up everywhere.
As a price action trader, you cannot rely on other off-chart indicators to provide you clues that a formation is false. However, since you live in the “now” and are reacting to directly what is in front of you, you must have strict rules to know when to get out.
With this in mind, in lieu of a technical indicator, one helpful tool you can use is time.
Just to be clear, the chart formation is always your first signal, but if the charts are unclear, time is always the deciding factor.
On a personal note, in a recent study of all my winning trades, over 85% of them paid in full within 5 minutes.
If you have been trading for a while, go back and take a look at how long it takes for your average winner to play out.
How to Protect Against the Head Fakes (False Setups)
Let’s review a few head fake examples to get a feel for what we are up against in terms of false setups.
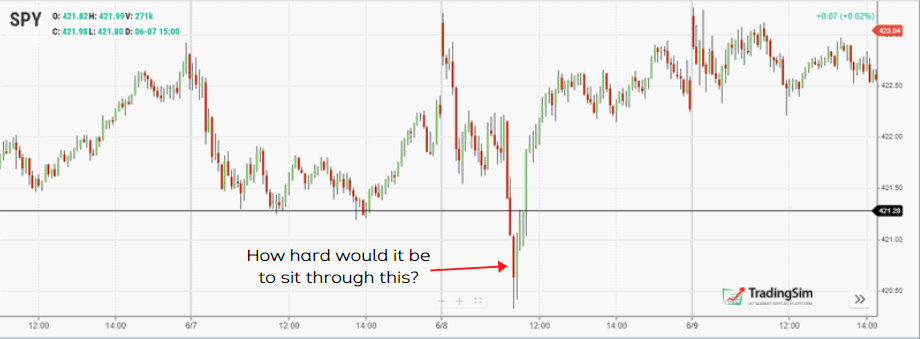
In each example, the break of support likely felt like a sure move, only to have your trade validation ripped out from under you in a matter of minutes.
Protection
There are many ways you can protect yourself against these head fakes.
For starters, don’t go hog wild with your capital in one position. Make sure you leave yourself enough cushion. This way you don’t get antsy with every bar that prints.
Also, let time play to your favor. There is an urge in this business to act quickly. However, there is some merit in seeing how a stock will trade after hitting a key support or resistance level for a few minutes.
If you think back to the examples we just reviewed, the security bounced back the other way within minutes of raiding stop losses and trapping traders.
Where to Place Your Stops
One thing to consider is placing your stop above or below key levels. Since you are using price as your means to measure the market, these levels are easy to identify.
Another easy way to do this as mentioned previously in this article is to use swing points. A more advanced method is to use daily pivot points.
You are probably thinking, “but this is an indicator.” Well yes and no. Unlike other indicators, pivot points do not move regardless of what happens with the price action. They are essentially support and resistance lines.
So, let’s see how you can use pivot points to avoid getting caught in false signals.
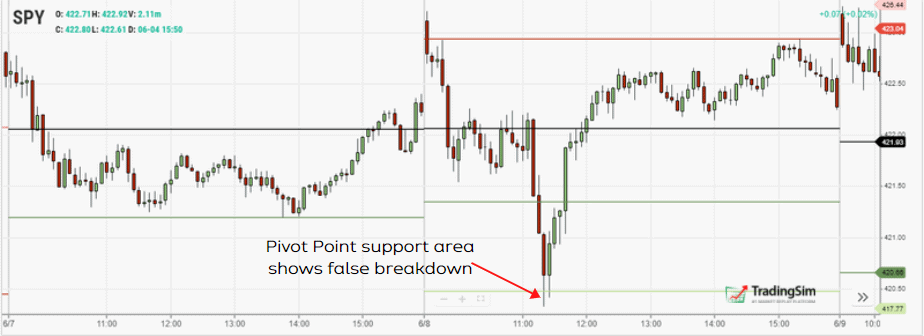
Using Pivot Points to avoid false breakdowns
Notice how the price barely peaked below the key pivot point and then rallied back above the resistance level. In order to protect yourself, you can place your stop below the break down level to avoid a blow-up trade.
Another option is to place your stop below the low of the breakout candle. Some traders such as Peters Andrew even recommends placing your stop two pivot points below. [4] This may not work for the risk averse trader, but it can work for some.
This is honestly the most important thing for you to take away from this article – protect your money by using stops. Do not let ego or arrogance get in your way.
Benefits of Price Action Trading
Price action traders are the Zen traders in the active trading world.
These people believe the human brain is more powerful than any machine.
Please do not mistake their Zen state for not having a system. The price action trader can interpret the charts and price action to make their next move.
Processing Data
For starters, there isn’t as much information to process, so you can focus on the chart action.
Secondly, you have no one else to blame for getting caught in a trap. Don’t bother emailing the guru with the proprietary trade signal that had you on the wrong side of the market.
The biggest benefit is that price action traders are processing data as it happens. There is no lag in their process for interpreting trade data.
Chart Patterns
By relying solely on price, you will learn to recognize winning chart patterns. The key is to identify which setups work and to commit yourself to memorizing these setups.
The next key thing for you to do is to track how much the stock moves for and against you. This will allow you to set realistic price objectives for each trade. You will ultimately get to a point where you will be able to not only see the setup but also when to exit the trade.
Some Challenges
Price action traders will need to resist the urge to add additional indicators to your system. You will have to stay away from the latest holy grail indicator that will solve all your problems when you are going through a downturn.
The real challenge is that it’s extremely difficult to trade purely on price. It’s not something you can just pick up and start doing right away.
You need to think about the patterns listed in this article and additional setups you will uncover on your own as stages in your trading career.
First, learn to master one or two setups at a time. Learn how they move and when the setup is likely to fail.
This, my friend, takes time; however, get past this hurdle and you have achieved trading mastery.
To further your research on price action trading, you may want to look into some courses like the ones offered at Wyckoff Analytics.
In Summary
Price action trading strategies can be as simple or as complicated as you make them. While we have covered 6 common patterns in the market, take a look at your previous trades to see if you can identify tradeable patterns. The key thing for you is getting to a point where you can pinpoint one or two strategies.
To start, focus on the morning setups. The morning is where you are likely to have the most success. Avoid the lunchtime and end of day setups until you are able to turn a profit trading before 11 or 11:30 am.
To test drive trading with price action, please take a look at the Tradingsim platform to see how we can help.
Price action trading is a method of making decisions based on the movement of price itself, including candlesticks, support and resistance, and chart patterns, rather than lagging technical indicators. The goal is to read what buyers and sellers are actually doing in real time.
Do price action strategies work for day trading?
Yes. Because price action reacts immediately to order flow, it suits the fast pace of day trading. Intraday traders use it to time entries at support and resistance and to spot reversals before indicators confirm them.
What are the best price action patterns?
Reliable price action patterns include inside bars, pin bars, engulfing candles, breakouts and retests, trend pullbacks, and range reversals. Each works best in the right market context, which is why reading trend and structure comes first.
Do I need indicators for price action trading?
No. Pure price action uses only price, candlesticks, and horizontal levels. Many traders still add a moving average or volume as a secondary filter, but the chart stays clean by design.
How can I practice price action trading?
Use the TradingSim market replay simulator to replay real historical sessions candle by candle. You can rehearse each pattern hundreds of times against live-like stock and futures data without risking money.
Alton Hill is the Co-Founder of TradingSim with over 18 years of trading experience. He completed the Design Thinking Bootcamp at Stanford’s D.School and brings expertise in Product Development to create the best trading simulation experience. His strategy focuses on trend-following systems, targeting high-volatility stocks with strong primary trends using the 15-minute chart.
What is the Kicker Candlestick Pattern? The kicker formation is a reversal pattern that starts with a candle in the direction of the primary trend, followed by a gap contrary to the trend. Talk about...
Volume Candlesticks – How to Trade with this Powerful Indicator
Volume candlesticks may sound a bit odd at first. After all, most of us are used to seeing price candlesticks separate from volume bars below on a chart. Perhaps you’ve even tried Volume Profile...
The Head and Shoulders Pattern: How to Trade Tops and Bottoms
The Head and shoulders pattern is a reversal trading strategy, which can develop at the end of bullish or bearish trends. It is often referred to as an inverted head and shoulders pattern in...


 Candlesticks


