One of the most recognizable trading patterns in the world is the head and shoulders pattern. However, this pattern is mostly associated with shorting strategies based on a massive distribution pattern that looks like a head and shoulders. There is a mirror image of this pattern for long-biased traders, however. It is simply called the inverse head and shoulders pattern and is an accumulation pattern.
In this tutorial, we'll go into detail on what the inverse head and shoulders is, what happens after an inverse head and shoulders, and how to trade this pattern.

What is an inverse head and shoulders pattern?
The inverse head and shoulders pattern is a reversal pattern in stock trading. It gets its name from the visual representation it makes on the chart -- two higher lows on either side of a lower peak in price action in the middle. It is also the same as a head and shoulders pattern that flipped on its horizontal axis. Hence the "inverse."
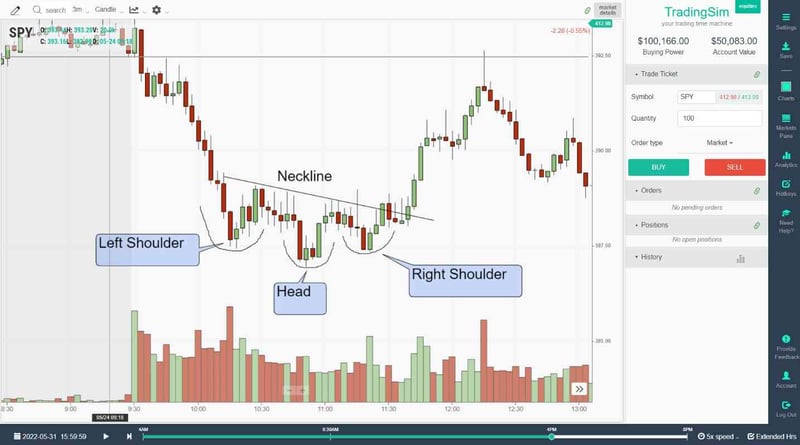
What is an inverse head and shoulders pattern? An inverse head and shoulders is a bullish reversal chart pattern that forms at the end of a downtrend. It consists of three troughs: a left shoulder, a deeper head (the lowest point), and a right shoulder that is higher than the head. The neckline connects the highs between the three troughs. A breakout above the neckline with increased volume confirms the pattern and signals a trend reversal from bearish to bullish.
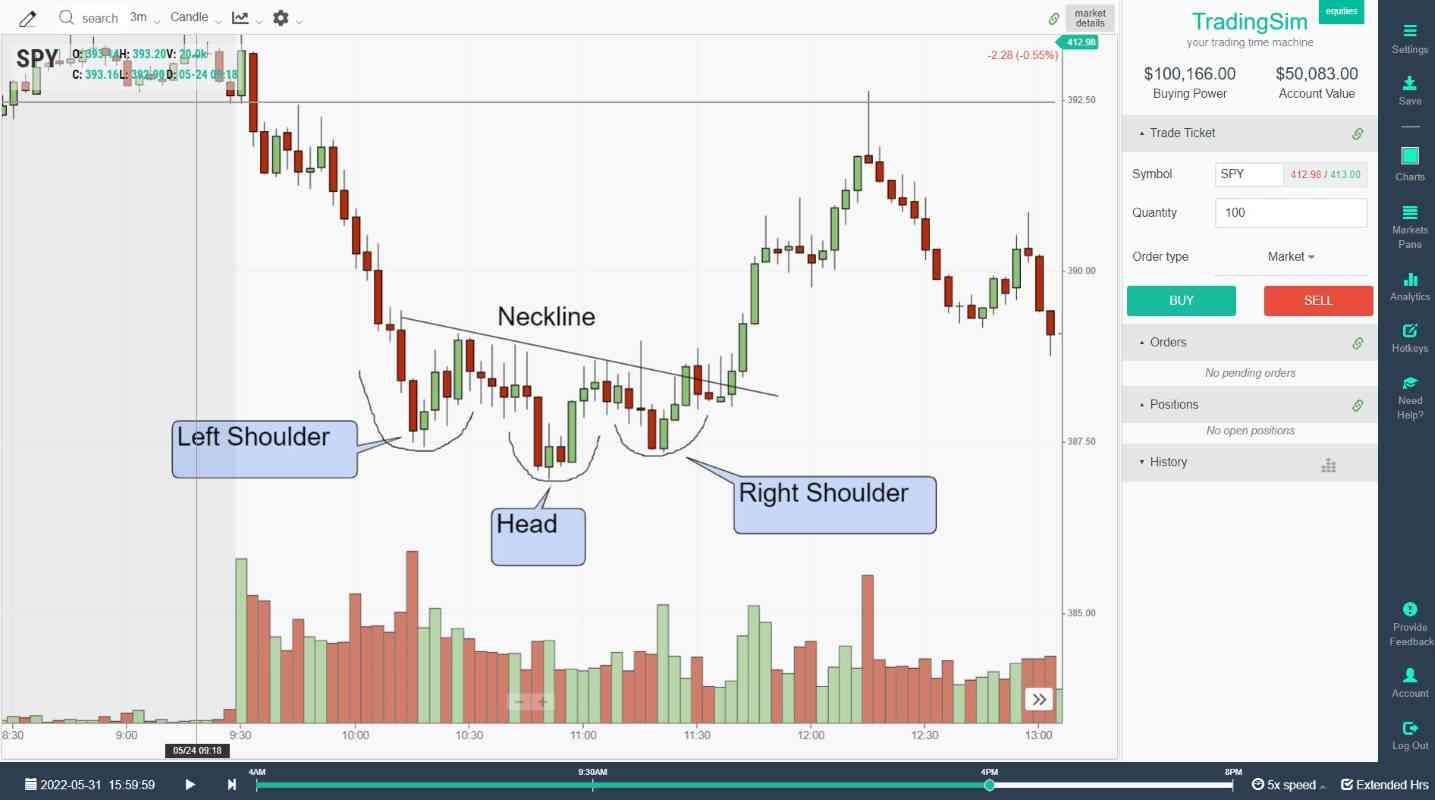
The inverse head and shoulders typically comes at the end of a downtrend in price movement on a chart. As the first shoulder forms, you begin to see the downward momentum slowing. Then the head is formed when the price action breaks through the left shoulder and goes lower. Lastly, there is a rally and then a retest of the lows on the right shoulder that should not make a lower low.
What does inverse head and shoulders indicate?
The inverse head and shoulders pattern typically indicates that a stock, cryptocurrency, future, or other asset is about to reverse a downtrend. There is a possibility that an inverse head and shoulders can form during a pause in an uptrend, but these are typically called cups, or cupst with handles.
The reason the inverse head and shoulders indicates a reversal is because it is an accumulation pattern. As you can see in the image shared above, the downward momentum of the stock is diminishing. With each successive move down, it get harder to make new lows. In fact, the right shoulder of the pattern indicates a new "higher low," something considered very bullish when trading.
As short sellers are taking profits into the lows of the pattern, bulls begin speculating on the oversold condition of the stock -- taking advantage of lower prices. While the pattern matures, short sellers begin to see a potential reversal. This may lead to more short covering, which creates demand for the stock.
Despite any added supply, the downward pressure eventually recedes and is absorbed by demand. Thus, the inverse head and shoulders results in a reversal of the original downtrend.
Is inverse head and shoulders bullish?
Generally speaking the inverse head and shoulders is bullish. This does not mean that every inverse head and shoulders will result in a successful long trade. We'll discuss what a failed inverse head and shoulders pattern looks like in a moment.
Suffice it to say that because this pattern is seen as a reversal pattern in a downtrend, traders are looking to trade it as a bullish pattern. In order to trade it successfully, you must adhere to some strict entry and risk management criteria.
Inverse head and shoulders pattern rules
In order for an inverse head and shoulders to qualify as such, it must create two "shoulders" and a "head". In other words, the second low in the pattern must be lower than the first and third low. Without this, it is merely a triple-bottom or some other pattern.
How to calculate an inverse head and shoulders price target: Measure the vertical distance from the head (lowest trough) to the neckline. Add this distance to the neckline breakout point to find the minimum price target. For example, if the head is at $40 and the neckline is at $50, the measured move is $10, giving a minimum target of $60 above the neckline breakout. Success rates improve with volume confirmation on the breakout candle.
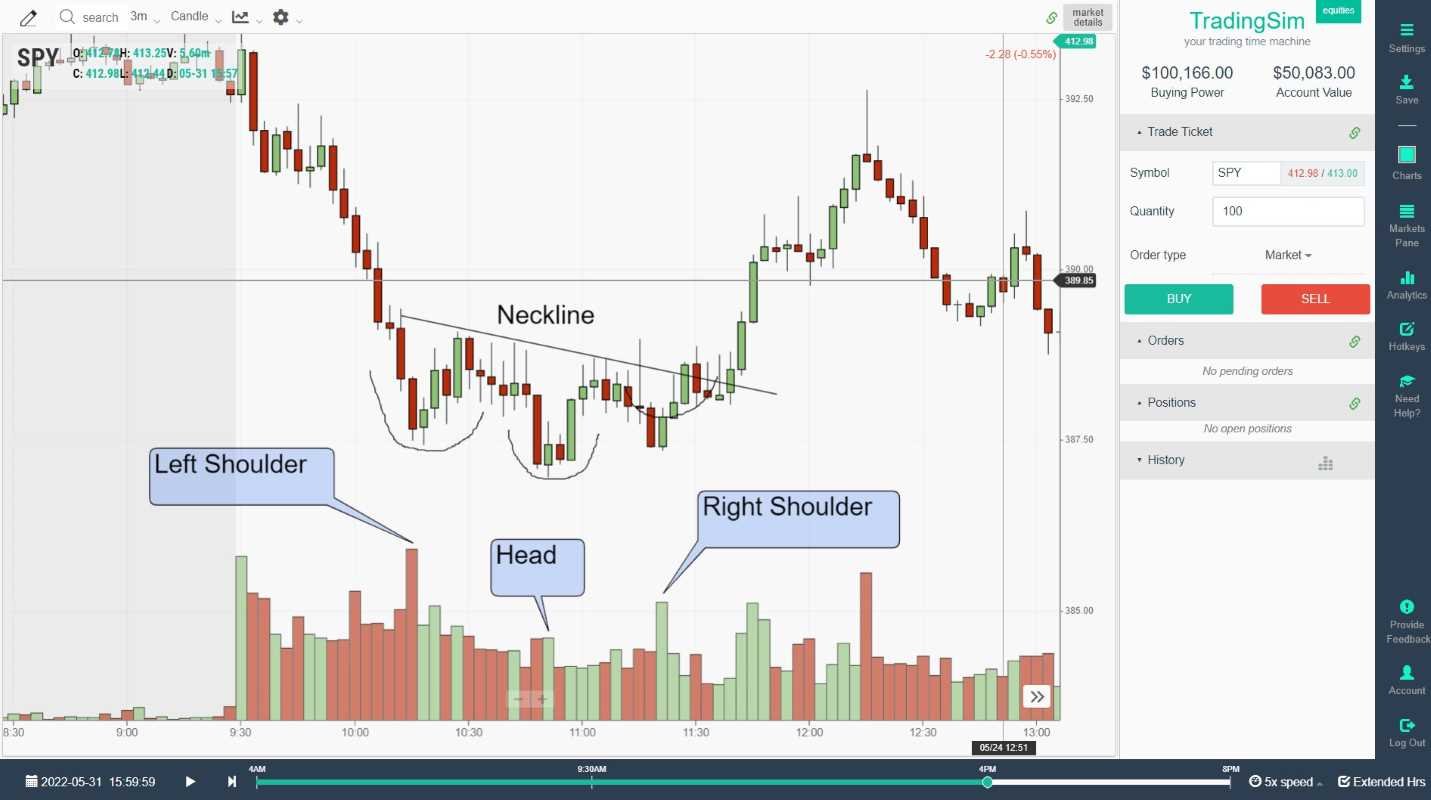
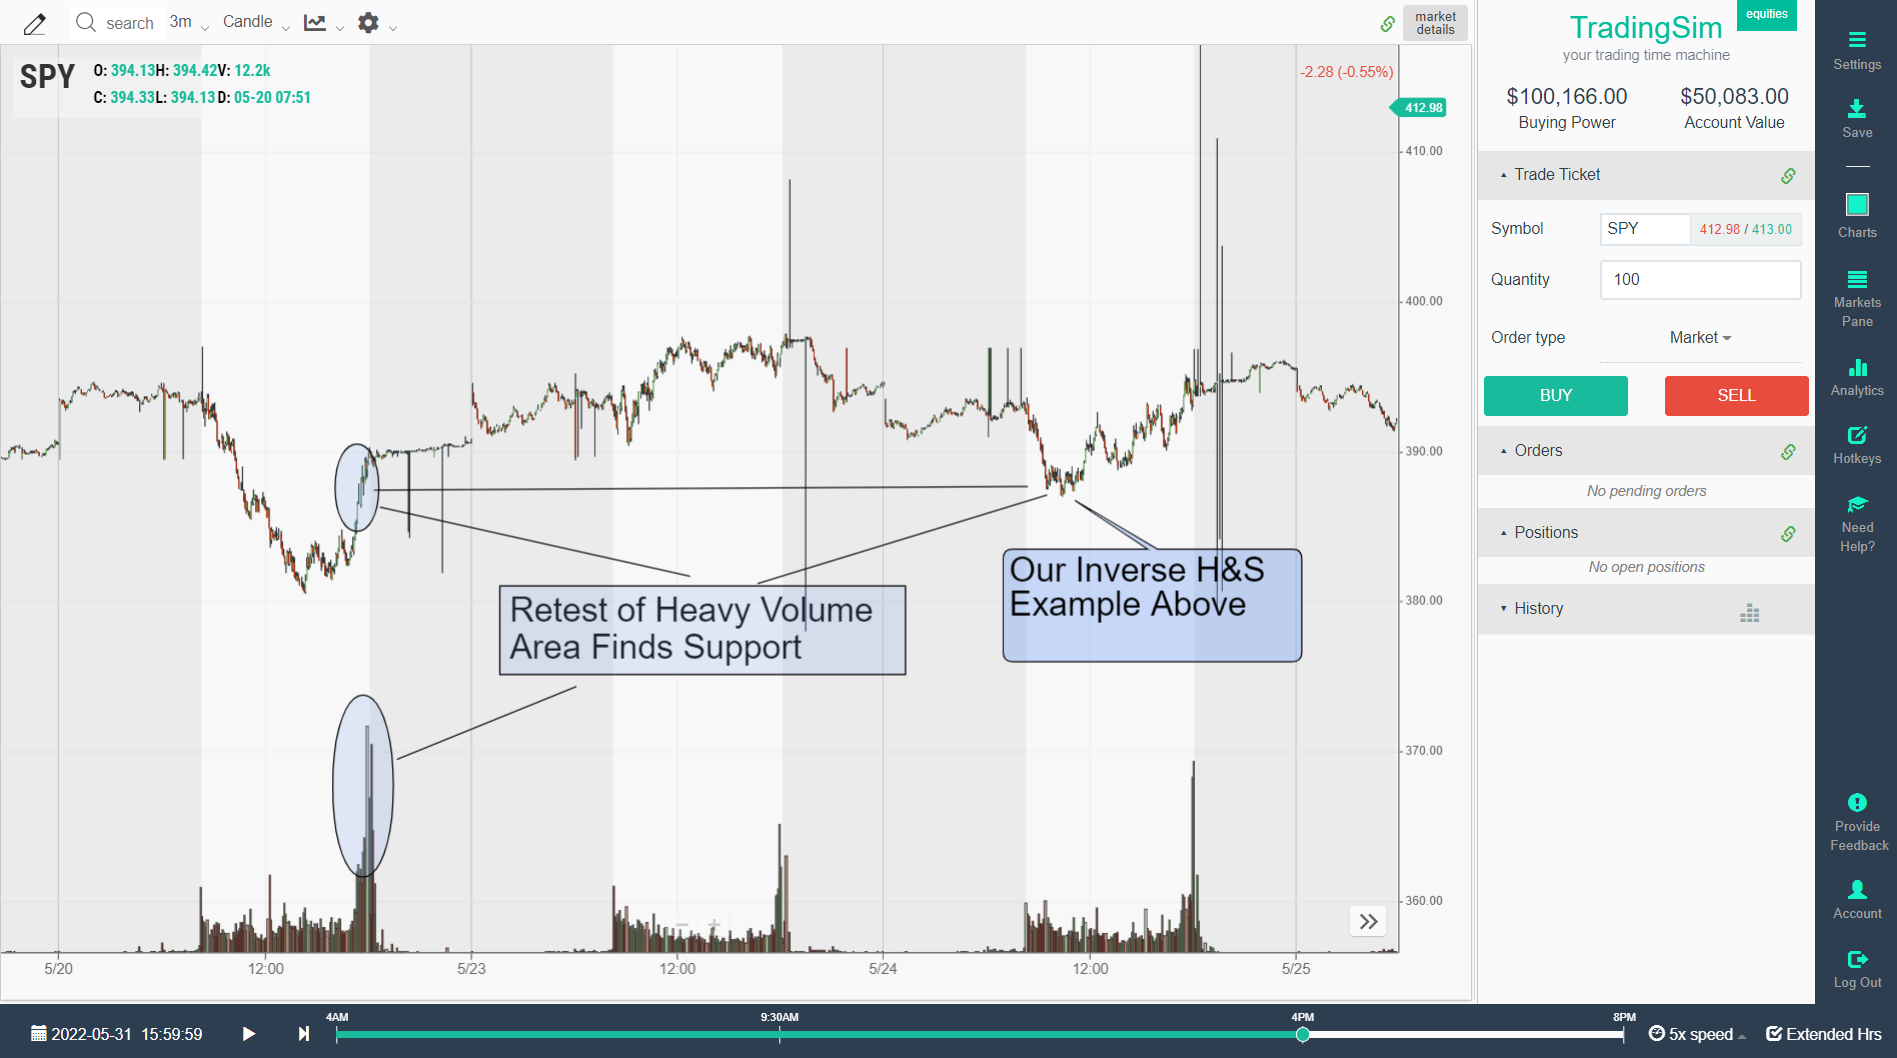
Likewise, there must be climactic price action associated with the pattern. Ideally, you'll want to see heavy volume along the lows of the pattern, indicating that someone is capitulating their shares, which are being absorbed by buyers. Notice in the image below that the volume spikes each time the price action reaches a low in the pattern:
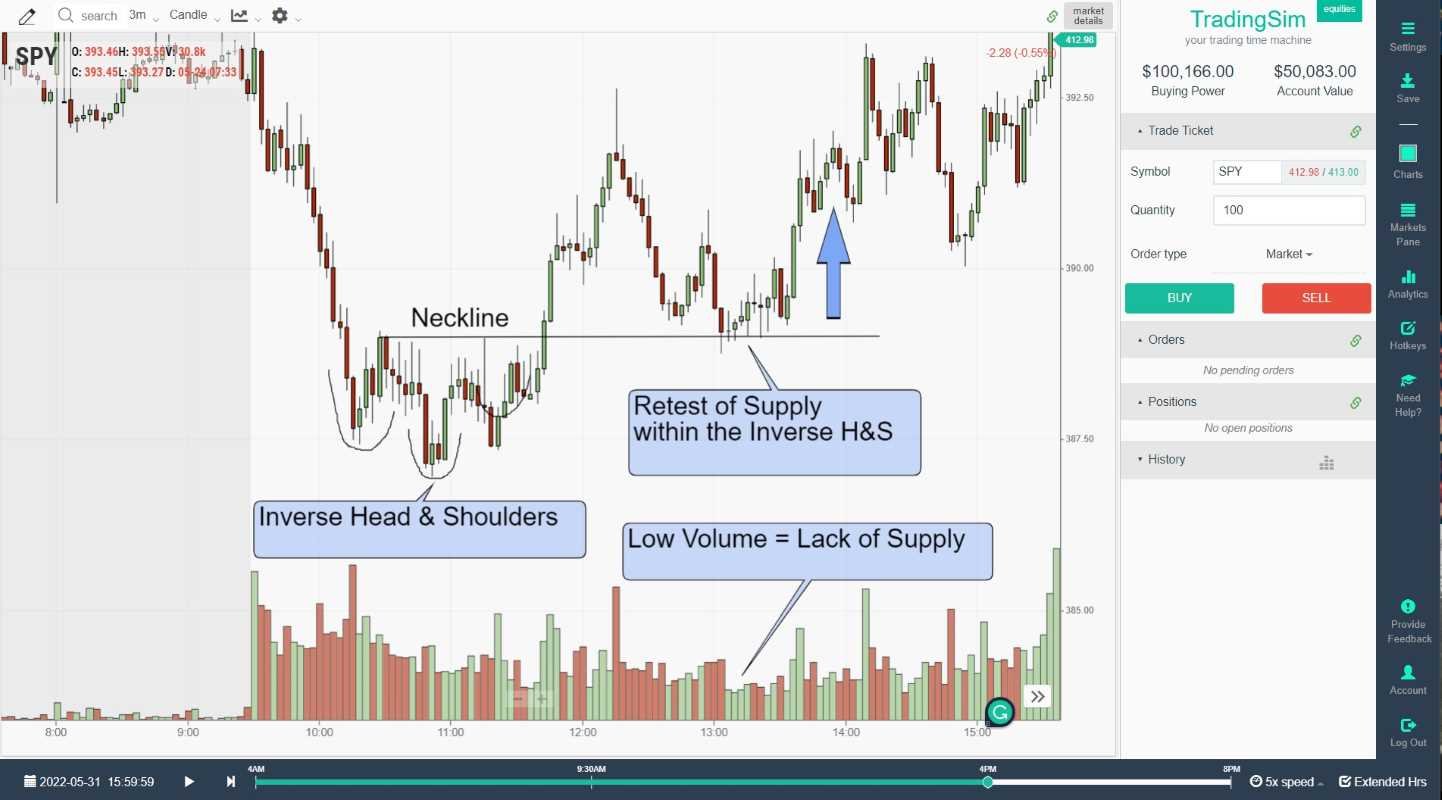
Lastly, the pattern isn't complete until the neckline is broken and a breakout from the pattern occurs. Ideally, you'll want a move higher that is at least as high as the pattern was deep. Often, you'll get a retest of the pattern neckline area later before price moves higher or fails.
So to recap the rules for an inverse head and shoulders pattern:
- A left shoulder that displays a stopping action of the downtrend
- A lower low than the first shoulder
- A third low that is higher than the second low
- Increased volume signature along the lows of the pattern
- A solid breakout of the neckline on increasing volume
Stick to these rules and manage your risk levels accordingly, and you should find a successful outcome with the pattern over time.

what happens after inverse head and shoulders pattern?
While anything can happen after an inverse head and shoulders pattern, for the pattern to be a success you must see a solid rise in prices for the stock you are trading. Ideally, volume will increase as the price of the stock breaks out from the neckline and moves upward on momentum.
That being said, it is possible to see a retest of the upper range of the head and shoulders pattern. It is not uncommon for stocks to return to an area of consolidation in order to retest the supply levels and check for demand. As long as the demand is still present and stronger than supply, you will likely see another move higher in prices.
If you are scalping the pattern, you might simply measure the move according to the depth of the original pattern. Once you reach your target on the breakout, you can take profits. However, if you want to hold for a larger move, you might wait for the retest of the pattern to add back any sells you might have made for a bigger move.
How to trade inverse head and shoulderS Chart
The inverse head and shoulders chart is a very basic, but popular chart pattern to trade. In order to trade it properly, you need to understand the basics of the trading strategy and the pattern. Many traders will try to anticipate the trade before the pattern is complete. While we don't recommend this, we'll offer a few cheat entries for consideration.
Inverse head and shoulders vs. head and shoulders: The standard head and shoulders pattern is a bearish reversal that forms at the top of an uptrend with three peaks. The inverse head and shoulders is its mirror image — a bullish reversal forming at the bottom of a downtrend with three troughs. Both use the same neckline breakout and measured-move target methodology, but signal opposite directional changes.
In order to trade the head and shoulders pattern properly, you can do a few things to time your entry.
- Buy the "head" of the pattern as it rallies back through the first shoulder's low (but you will have to wait out the right shoulder formation and set your stop below the head of the pattern)
- Buy the right shoulder if it finds support along the same area as the first shoulder, but doesn't make a new low below the "head".
- Place your stop below the second shoulder or below the head.
- Buy the break out of the neckline - which could result in a higher success rate, but makes it difficult to define where your stop out will be.
Let's look at these examples on the chart, now:
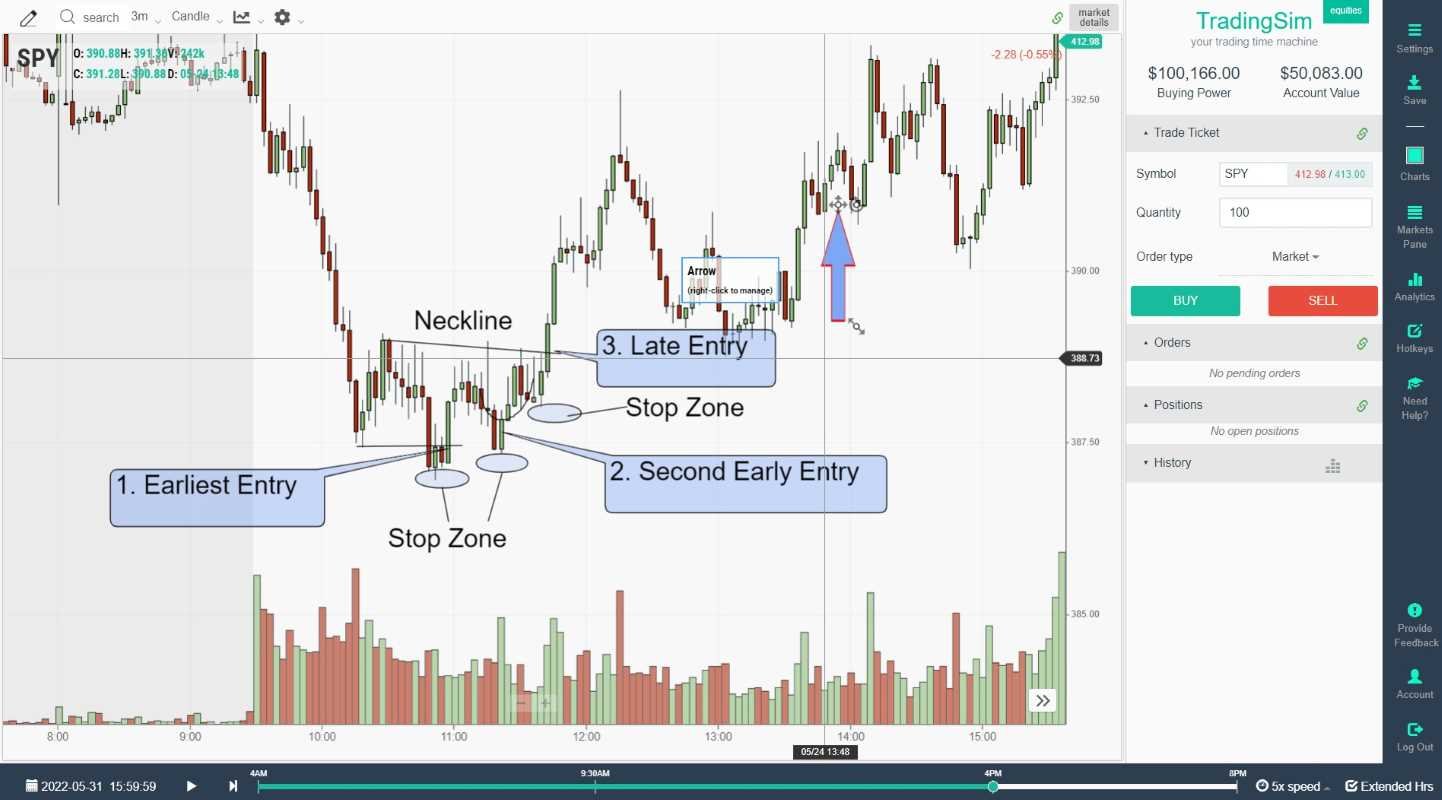
As you can see, a proper head and shoulders can offer multiple "cheat entries" if you are trying to layer into a position in anticipation. Just understand that if you trade this way, you can easily get stopped out if the pattern fails. Always be sure to respect your stop-outs.
Inverse head and shoulders failure
Not all inverse head and shoulders pattern will work like a charm. In the event of a failure, you need to be disciplined in order to stop out and cut your losses. Here are a few things that can cause an inverse H&S pattern to fail:
- Lack of demand along the lows of the pattern or the breakout
- Not oversold enough
- Redistribution and heavy supply
We always encourage traders to find as many reasons for the trade to work as possible. For a head and shoulders pattern to work, you might want to consider any longer-term support and resistance levels, or multiple time-frame charts, like an hourly, daily, or weekly chart. If you can find that a stock is getting supported along the lows of a daily chart, then it retests on a selloff only to present an inverse head and shoulders, you might be in for a bonafide rally.
Conversely, if you are in the beginning of a new downtrend, you might find that the supply levels are too heavy and the stock fails.
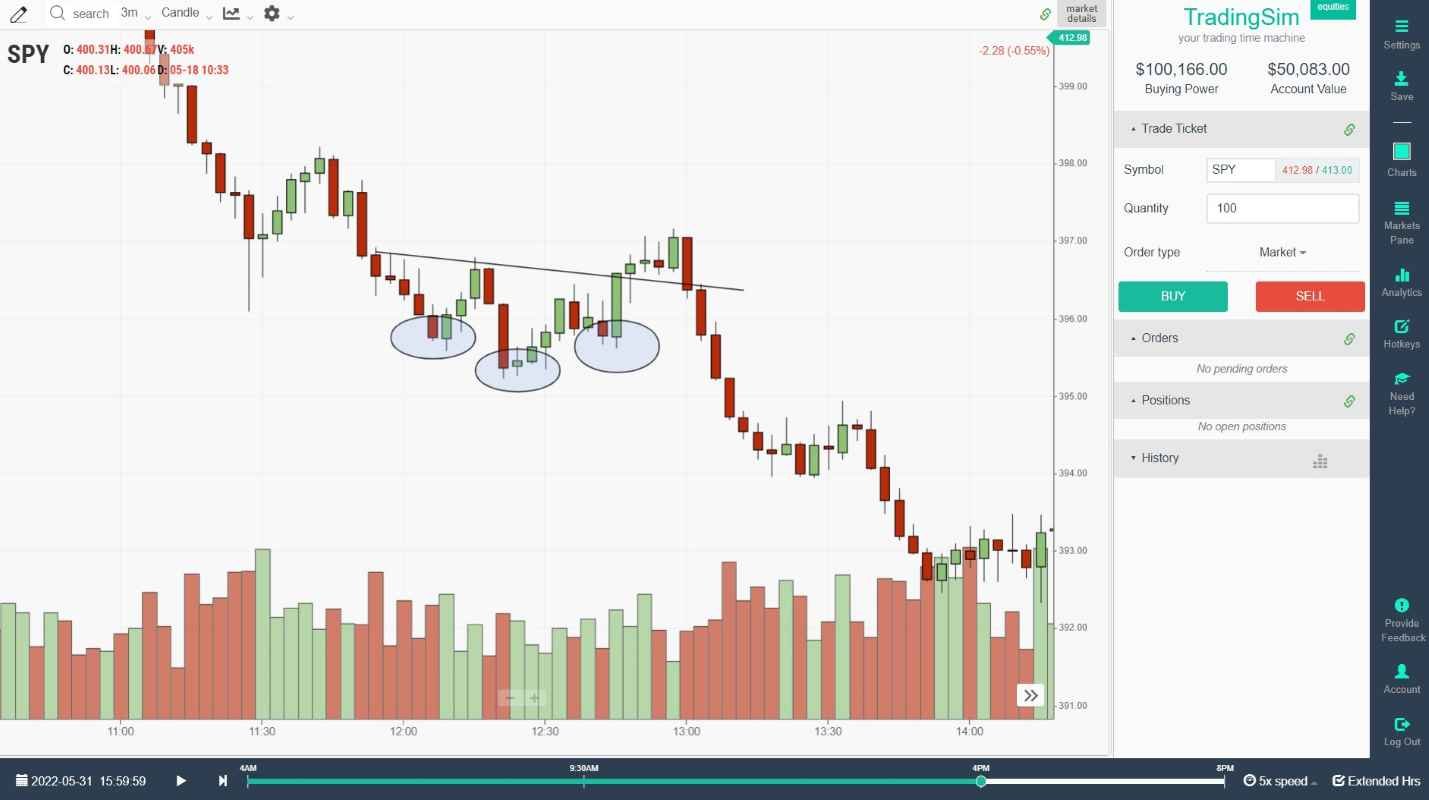
Notice in this example below that the SPY was trending downward strongly. We never saw the heavy volume signatures that we saw in the successful example above. Consequently, this head and shoulders failed as prices continued lower.
Inverse Head and Shoulders: Key Statistics and Success Rates
Historical data shows the inverse head and shoulders pattern has a breakout success rate of approximately 89% when volume confirms the neckline breakout. The pattern performs best when the right shoulder forms above the left shoulder, indicating strengthening buying pressure. Patterns that take 3 to 6 months to complete tend to produce larger measured moves than patterns forming over days or weeks.
Traders should watch for relative volume (RVOL) spikes above 2.0 on the breakout candle. Low-volume neckline breaks are more likely to be false breakouts, which is why the volume profile around the neckline area is critical to analyze before entering a position.
Common Inverse Head and Shoulders Mistakes to Avoid
The most common mistake traders make with this pattern is entering before the neckline breakout is confirmed. Pre-breakout entries offer better risk/reward but carry significantly higher failure rates. Another frequent error is using the pattern in isolation without confirming the broader market context through tools like moving averages and chart patterns.
Asymmetric shoulders are acceptable — the pattern does not require perfectly symmetrical shoulders. However, a right shoulder that dips below the head invalidates the pattern entirely. Always place stops below the right shoulder, not below the head, to manage risk efficiently.
Practice Inverse Head and Shoulders Trading in a Simulator
Before trading inverse head and shoulders patterns with real capital, practice identifying and executing these setups in a stock trading simulator. This allows you to develop the discipline to wait for confirmed neckline breakouts and volume confirmation without the emotional pressure of risking real money.
In the simulator, track metrics like your win rate on confirmed vs. unconfirmed breakouts, average measured-move achievement, and how different stop-loss placements affect your risk/reward. This data-driven approach helps you refine your strategy for ABCD pattern combinations and doji confirmation entries that complement the inverse head and shoulders setup. You can also compare how the pattern performs alongside bull flag patterns and volatility contraction patterns in your trading journal.
Inverse head and shoulders summary
As with any strategy, you want to practice, practice, and practice some more. We are huge proponents of backtesting and outcome testing so that you know the odds you're stacked up against before you ever put your hard-earned cash at risk in the market. Be sure to test out the inverse head and shoulders in our simulator and trade as many examples as you can find while studying your analytics in our analytics page.
Keep in mind that not every inverse H&S will work. Write up your criteria and find the best way to find a confluence of variables that will give you success while trading it.
Here's to good fills!

Frequently Asked Questions
What is an inverse head and shoulders pattern?
An inverse head and shoulders is a bullish reversal chart pattern that forms at the end of a downtrend. It consists of three troughs — a left shoulder, a deeper head (the lowest point), and a right shoulder that is higher than the head. A breakout above the neckline with increased volume confirms the reversal from bearish to bullish.
Is the inverse head and shoulders pattern bullish or bearish?
The inverse head and shoulders pattern is bullish. It signals the end of a downtrend and the beginning of a potential upward move. Traders look for volume confirmation on the neckline breakout to validate the bullish reversal signal.
How do you calculate the price target for an inverse head and shoulders?
Measure the vertical distance from the head (lowest trough) to the neckline. Add this distance to the neckline breakout point. For example, if the head is at $40 and the neckline is at $50, the measured move target is $60 ($50 + $10).
What causes an inverse head and shoulders pattern to fail?
Common failure causes include lack of buying demand at the lows, insufficient oversold conditions before the pattern forms, heavy selling pressure (redistribution), and low volume on the neckline breakout. Always use a stop-loss below the right shoulder to manage risk.
How reliable is the inverse head and shoulders pattern?
The inverse head and shoulders is one of the more reliable reversal patterns when confirmed by volume. Success rates improve significantly when the breakout candle shows above-average relative volume (RVOL above 2.0) and when the pattern forms over weeks to months rather than intraday.
Related Trading Resources
Continue your trading education with these related guides:
How long should an inverse head and shoulders take to form? Most reliable inverse head and shoulders patterns develop over several weeks to several months. Intraday versions exist but tend to break out and fade more often than multi-week structures, where institutional accumulation has time to build.
What volume profile confirms the breakout? Look for relative volume (RVOL) of at least 1.5x to 2.0x average on the neckline breakout candle. A break with thin volume often retraces back below the neckline within one to three sessions.
Last reviewed and updated by Al Hill — May 2026.


 Day Trading


