Day Trading Breakouts – 4 Simple, Explosive Strategies + Video
Dec 22, 2021
Written by: Al Hill
Are you a day trader? If yes, then you will definitely find this article helpful as you begin to navigate the world of day trading breakouts.
Today we are going to discuss 4 strategies for how to trade intra-day breakouts. But, before we jump into the meat of the article, let’s first align on the definition of breakouts and some of their key characteristics in this short video.
What are Breakouts?
A breakout occurs when price clears a key level on your chart.
These levels could be a trend line, support, resistance, a prior high, or a key Fibonacci level. Remember, levels on your chart are psychological and represent the sentiments of day traders at a respective price level.
When you think of day trading breakouts, what comes to mind? Stocks making daily highs, two-day highs, weekly highs, all-time highs? As you see, breakout means a lot of things to a lot of people.
So, why do so many people lose money day trading? Why are traders constantly buying stocks when they hit intra-day highs, only to have them roll over within minutes. How many times have you shorted a stock on a breakdown through a critical support level, go get coffee, come back and see the stock has bounced and you just bought a five-thousand dollar no foam, soy latte?
Well, in this article we’ll give you the “secret” that so many breakout day trading professionals use every day to take themselves from ordinary to extraordinary.
Day Trading Breakouts Misconceptions
If you buy a breakout or sell a breakdown, you’ll make money, right?
Do you believe this statement? If so, immediately contact your broker, withdraw your funds and put them in a savings account.
If you follow this system, you will lose money. [1] Often times, professional floor traders and the like will wait for stocks to break new lows, look for large buy orders in the tape, and then start scooping up every share in sight.
This will leave you, the novice trader, looking at your screen scratching your head and asking yourself the question, how did this happen? My technical indicators were in alignment. The stock has been below its simple moving average the last 10 bars. The last 15 bars have been down, now when I put on my short position, the stock has the bounce of its life.
If you are ready to end your streak of tough trading days, continue reading.
Avoid Trading Breakouts During Lunch
In the morning, there is news, earnings, gossip, and a multitude of other reasons that cause stocks to move swiftly with heavy volume. Then around lunch, traders take a step back and begin to digest all of the events from the opening bell.
This does not mean there are no good breakouts in the market, but the odds of finding the stocks that will move are not in your favor. It’s a known fact on the street that lunchtime trading is for accumulating sizeable positions that you can then unload at some point in the future.
That is why, during the middle of the day, stocks go through an endless process of breaking out and failing, over and over again. This process is known as intraday accumulation. Think for a second, if you are attempting to accumulate 200,000 shares of a stock. Could you just run out there and put one large order in the market without anyone seeing you?
Maybe on a stock like Apple, but this is a much harder task in a stock that is not traded heavily.
Well, if the trading is light, You just put the trade on in the morning. Wrong.
When Momentum Stops
If you put the trade on after the morning gap, you can easily get caught up in the morning volatility and may not get the best price. However, if you wait until the afternoon, you can quietly accumulate shares, 10,000 or so each time you buy, without many noticing.
So, if you were doing this, would you want the stock to breakout? Of course not, this would mean you would have to pay more per share.
So, instead you keep things quiet and by 2 pm, you’ll have been able to acquire your 200,000 shares, over the last 3 hours, under the radar. If you are a smaller trader, why get trapped taking on positions during the accumulation period?
Why put yourself through the emotional stress of watching your stock breakout and fail, over and over again? If you only remember one thing from this article, the middle of the day is for hedge funds and large institutions to build sizeable positions, not for you to day trade breakouts.
If you’re not convinced to avoid lunchtime trading, at least do yourself the favor of putting on no more than 2 trades per day. The trick about the midday breakouts is that you have to be extremely patient.
Example of a Midday Day Trading Breakout that Works
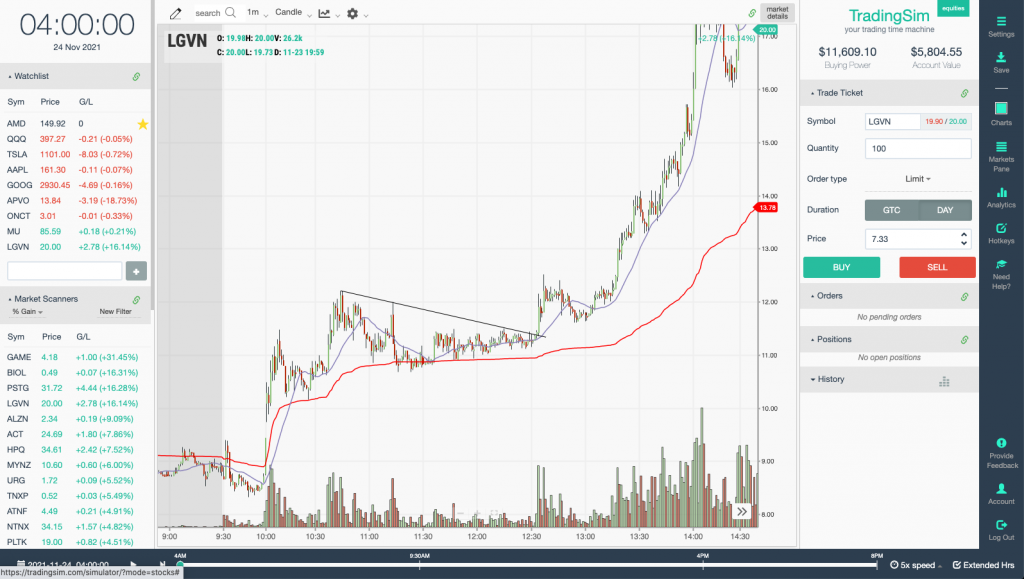
Below is an example of a midday breakout.
Midday Breakout
The one thing you will notice here is that the breakout took place right before 1:30pm. From about 11 am to 2 pm the stock drifted lower. If you were trading during this timeframe you would likely lose money and rack up more commissions. It was nothing but choppy action.
The real breakout finally brought an expansion in both price and volume around 12:30pm, with a second breakout at 1pm.
Now, what was the secret sauce that lets us know the breakout was real? Do you think the expansion in price was enough? Is it how high the stock is trading above its 200-day moving average? Nope.
Do you get a feel now for what it takes? You have to exercise extreme patience and wait for the right setups. It also helps to have a bigger picture idea. This LGVN was a classic example of a liquidity trap.
When to Make Money Day Trading Breakouts
The “secret” for day trading breakouts is knowing when to trade them.
There are typically only 2 to 3 hours per trading session you can day trade breakouts on an intraday basis. That’s right. If you are day trading breakouts, you only have about 2 hours a day where you can make money easily, quickly, and without much effort. This time frame is usually between 10am and 12pm, with some exceptions.
In addition, there are two indicators you ought to have on your chart. Those are Fibonacci (retracements and extensions) and pivot points.
These provide you the support and resistance levels for where to enter and exit trades.
The other key point, assuming you are not scalping, is that you should only look to place 1 to 4 trades per day. There is no need to overtrade. If you play it right, the plays will more than pay for themselves.
What Times Work for Day Trading Breakouts
The optimum times to day trade breakouts by scalping are during the first 30 minutes and the last 30 minutes of the day. The volume during these time windows makes them ripe for entering and exiting trades. [2]
For smaller cap, bigger-picture ideas, 10 am to 12 pm is usually best for a base to build, with a late morning breakout. These are usually squeezes in the smaller float stocks like the LGVN example above.
Most traders say stay away from the morning and late afternoon trading because it’s too volatile, right? Well, that is partially a true statement, if you just go out into the market putting on trades without any defined rules or systems in place. We like the 1 Minute ORB for trading off the open.
Identifying Winning Breakouts
Avoid stocks that have extreme volatility
Trading low float stocks looks really cool when you are watching YouTube videos of your latest start-up millionaire. However, trading them is a completely different story. We’re not saying there aren’t those crushing them on a daily basis – You just have to wait for a proper setup like the volatility contraction pattern. As stated by Peter Leeds, author of Penny Stocks for Dummies, “Rapid and sudden price spikes typicallydon’t last.” [3]
Do not fade gaps
Yes, gaps get filled. The question is, will it get filled in the timeframe you need it to. If you are day trading breakouts, you need things to happen quickly and precisely. You do not have time to wait around for the stock to act appropriately. Remember, it is always easier to go with the trend.
Avoid thinly traded stocks
If the stock has awful spreads, this will only eat into your profit margin. Also, when it comes time for you to exit the trade, you will likely get horrible pricing and have a tough time exiting your trade.
Only trade stocks that have a sizeable price range
Remember, the goal here is to day trade breakouts. The greater the recent trading range, the greater your odds are of being in a stock that has room to trend.
4 Explosive Strategies for Day Trading Breakouts
Now that we have covered the basics of breakouts, we are going to delve further into four breakout strategies you can use when day trading.
#1 – Day Trading Breakout + Volume Indicator
Again, traders use breakouts as a trigger for entering a stock. But, for how long?
Let’s explore a simple strategy where we leverage the volume indicator as our tool for assisting in trading breakouts.
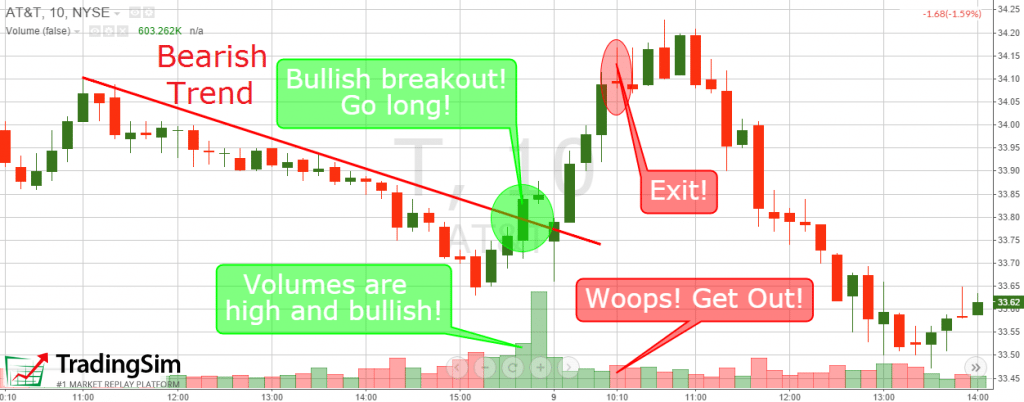
Day Trading Breakouts with Volume
Above is a 10-minute chart of AT&T.
The red line signifies the resistance level of a bearish trend. We have highlighted in the green circle the exact moment AT&T breaks out above the downtrend line.
At the same time, the volume with AT&T is increasing in a bullish direction. Thus, we go long with the breakout candle.
The next 5 candles are bullish, and volume is expanding on the up move. We hold our long until we get the first bearish volume bar with increased volume. This happens after 5 periods and we exit the position as shown in the red circle.
Just to clarify, for a proper exit signal, you want to see the volume increase relative to the last few candlesticks and the price to also go counter to the primary trend. This is an early indication that the impulsive move is in the process of at least slowing down, if not reversing.
This trade brought us a profit of 25 cents per share for less than an hour’s work. Notice that after we exit the market, the price starts consolidating and then drops significantly.
#2 – Day Trading Breakout + Volume Weighted Moving Average (VWMA)
Another way to analyze volumes with your breakout strategy is to include a VWMA.
Since breakouts occur only a few hours a day with high volume, the VWMA could also prove a valuable confirmation tool.
The reason for this is that during times of high volume, the VWMA will experience a deeper incline and further separate itself from the price.
Conversely, when the price trades closely to the VWMA after a breakout, this can be an early indication that the breakout is a false buy signal due to light volume.
The example below shows how to trade a breakout with the help of the VWMA:
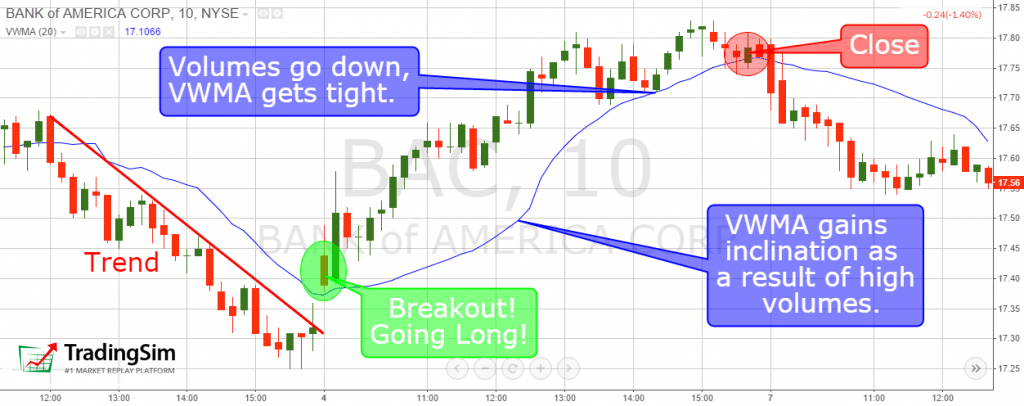
Day Trading Breakouts with VWMA
This is the 10-minute chart of Bank of America. We use a 20-period VWMA. The red line indicates a bearish trend. The trend line is tested 5 times before Bank of America finally breaks out, which is highlighted in the green circle.
The price opens the next week with a gap through the trend line and the VWMA. This is when we go long.
Notice that when the volume is high, the VWMA creates a lot of distance between itself and the price action. However, as the volume begins to dry up, the price hugs the VWMA tightly.
For this reason, the price is more likely to break the VWMA during lower volumes, as the bulls are not stepping in to fuel the next round of buying.
Once the price breaks the VWMA, we exit our long position as highlighted in red above. This position brought us a profit of 36 cents per share for a few hours of work.
#3 – Scalping for Breakouts with a Short Period Exponential Moving Average
Since the EMA places a higher emphasis on the most recent price action, the EMA will trigger exit signals well before a trend terminates. While we may miss the lion's share of the profits, this strategy allows us to make smaller, consistent gains.
Have a look at the following example, which shows how the EMA breakout scalping strategy works:
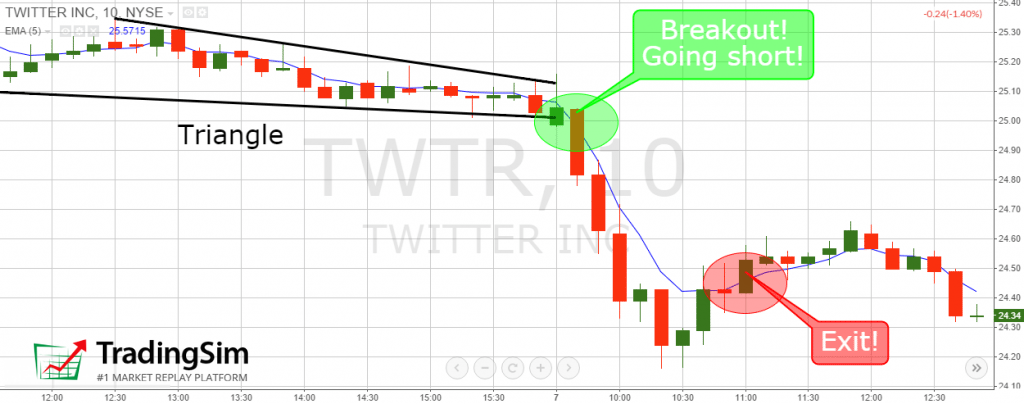
Breakouts + EMA
This is the 10-minute chart of Twitter. We use a 5-period EMA in order to catch the short-term price movements. We spot a triangle on the chart and we wait for a candle to close below this support line as an indication of a breakdown.
This happens in the green circle and we open a short position. Four large bearish candles occur after our entry, which is great for our pockets.
After this rapid drop, the price begins to hesitate and eventually breaks the 5-period EMA to the downside. We get four big bearish candles afterward. After the rapid drop, the price starts hesitating and breaks the 5-period EMA in a bullish fashion, at which point we exit the trade. We were able to capture 51 cents of profit per share for under 90 minutes of work.
#4 – Day Trading Breakouts + Price Action Trading
There is another, very simple option when trading breakouts intraday. Sometimes the technical indicators and MAs are just too much. If you don’t like overly complicated charts and you want to keep things simple, you will love the breakout price action trading strategy. Price action trading is one of the most straightforward methods for active trading.
This is because you only need candlestick formations or support/resistance levels to make a trading decision. No flashy indicators or awesome oscillators to fret about.
Again, do not use any indicators or moving averages! Let’s review an example, to further illustrate this point:
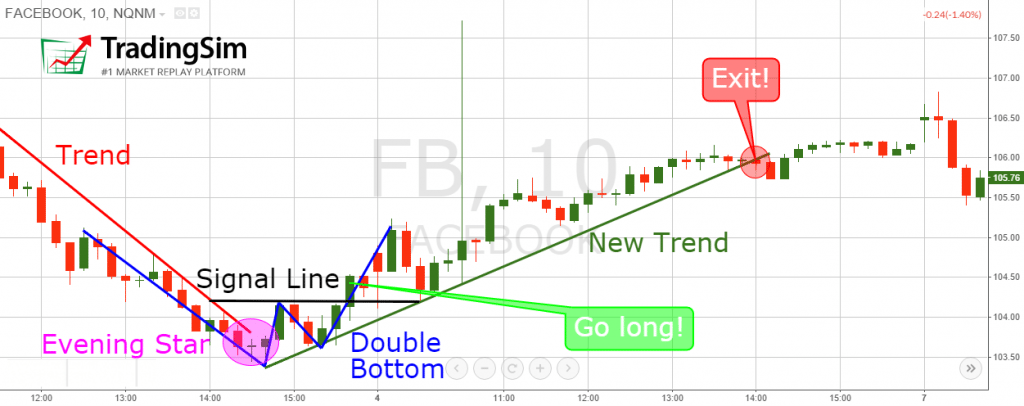
Price Action Trading
Above is a 10-minute chart of Facebook. After a bearish downtrend, the price develops into one of the most famous candlestick reversal patterns – the evening star. The price then breaks out and creates a double bottom formation, where the second bottom was higher than the first.
We create a resistance line above the double bottom formation as our trigger for entering a long position. Once the price breaks this resistance level, we go long with our first target equal to double the size of the double bottom formation.
We also draw a trend line in green, which represents support for the up move. We stay in the market until our new trend line is broken, which is indicated by the red circle. This trade brought us a profit of $1.70 per share.
So, which strategy is the best for day trading?
We believe the key to breakout trading success is hidden in the volume present during the breakout.
Thus, we recommend a combination of the first and second strategies.
How to Manage the Trade When Things Go Wrong
No matter how good you are – you’ll lose 30% to 40% of the time. This losing percentage is the same for day trading breakouts. Even if you execute every setup listed in this article perfectly or if you take these ideas and build upon them. There is simply no way around it.
So, in order to manage the unavoidable, let’s dive into how things can go wrong and what you can do to address the matter.
#1 – Take Profits
One thing you’ll need to decide as a trader is how you will take profits. Now, if you are trading low volatility stocks you can hold your entire position until you get a sell signal.
If you are trading the high flyers, we recommend selling your position in thirds. When stocks are shooting higher, they will have moments where they surge and then retrace.
Therefore, enter your position on the breakout and then sell a third every time the stock pops.
If the stock does shoot up 10% or 20% in a matter of minutes, just go ahead and close the entire position. Realize you just made 20% in minutes – this is not normal.
So how is this helping you manage the trade when things go wrong? Well, by selling in thirds you are ensuring that you are walking away with some profits as the trade goes in your favor. Therefore, if there is a major reversal – you will walk away with something.
#2 – Money Management
This one is straightforward. If you are trading the high-flying stocks that are printing 5% range bars – do not go in large! It is very hard to succeed at trading going large in volatile penny stocks.
Never use a large portion of your trading account. Depending on the size of your account, consider trading with only 5% to 10% of your total account value per trade.
Consistency and compounding are the key.
The point of this section is to tell you to not go into trades with 50% or 100% of your account value. If you use this strategy, at some point you will blow up your account.
#3 – Watch the Time
If breakouts are going to fail. one of the early signs things are going wrong is time. If the stock does not move quickly, in other words. Now, this doesn’t mean it’s a trap where price just crashes lower, which is a clear sign things are wrong.
What we’re talking about is the stock breaks out and then just hovers around the breakout level. You will find yourself sitting there and looking at your screen wondering what’s going on. Watch the price action and if the key breakout levels don’t hold, it could be a failed breakout.
Now you will need to determine based on your time frame how long a stock can hover around the breakout area before you realize things are off.
#4 Profit/Loss Ratio
For every trade, you need to identify profit and risk levels. This is because you have to, at a minimum, risk the same amount of money you hope to make.
This way if you win more than you lose, you are sure to make money by the end of every month.
If you just enter trades without targets, you’ll either sell too soon or you will let things run too long and exit without. You may even let a winner turn into a loser.
Next, you need to make sure you really understand the risk of the loss. Don’t just look to the most recent low on the chart, but really understand the percentage you are risking on the trade.
If you keep the ratio in your favor on each and every trade, the only thing you need to do is focus on developing a winning strategy.
Conclusion
While our chart examples were of 10-minute intervals, the techniques will work on other timeframes such as 5-minute and hourly
Breakouts are one of the crucial aspects of day trading.
The setup can occur when the price goes through a crucial level – support, resistance, trend, channel, Fibonacci level, chart formation, etc.
Breakouts give clear entry points, but they do not provide clear exit points.
We use different on-chart tools in order to identify exit points when trading breakouts.
Avoid trading breakouts during lunchtime.
Market volumes are crucial when trading breakouts.
Two of the best instruments to measure volume during breakouts are the volume indicator and the VWMA.
The EMA is another great tool for trading breakouts.
Breakouts + EMA create a strong price scalping strategy.
Breakouts can be traded with simple price action techniques without any indicators.
Alton Hill is the Co-Founder of TradingSim with over 18 years of trading experience. He completed the Design Thinking Bootcamp at Stanford’s D.School and brings expertise in Product Development to create the best trading simulation experience. His strategy focuses on trend-following systems, targeting high-volatility stocks with strong primary trends using the 15-minute chart.
First Hour of Trading – How to Trade Like a Seasoned Pro + Video!
Assuming you have either started day trading or are looking to get into the game, we are going to shock you in this article. What we’ll cover will hopefully save you many months of headaches and help...
In this article, I am going to discuss the concepts centered around range-bound trading. There are approximately 7 key topics to discuss, so please make it through the entire article. Overview of...
Canadian Dollar Futures: How to Day Trade Breakouts
The Canadian dollar futures are the futures derivatives product trading the underlying asset of the Canadian dollar. Unlike the spot markets where the price quotation is based on one U.S. dollar, the...


 Day Trading Videos


