Volume Weighted Moving Average (VWMA) – Top 4 Trading Strategies
Nov 3, 2015
Written by: Al Hill
✓ Reviewed by Kunal Vakil, Co-Founder of TradingSim · Updated Mar 31, 2026
As stated in its name, the volume weighted moving average (VWMA) is similar to the simple moving average; however, the VWMA places more emphasis on the volume recorded for each period. A period is defined as the time interval preferred by the respective trader (i.e, 5, 15, 30).
Therefore, if you place a 20-period simple moving average (SMA) on your chart and at the same time, a 20-period volume weighted moving average, you will see that they pretty much follow the same trajectory. However, on further review, you will notice the averages do not mirror each other exactly.
The reason for this discrepancy, as we previously stated is the VWMA emphasizes volume, while the SMA only factors the average of the closing price per period.
VWMA versus SMA
The above chart is of Microsoft from September 25, 2015. On the chart, we have placed a 20-period simple moving average (red) and a 20-period volume-weighted moving average (blue). At the bottom of the chart, you will also see the volume indicator, which we will use in order to demonstrate how the VWMA responds to volume. In the green circles on the chart and on the volume indicator, we have highlighted the periods of high volume. Notice, that wherever we have a big volume candlestick, the blue volume-weighted moving average starts moving away from the trajectory of the red simple moving average. Then, whenever we have lower market volumes, the red simple moving average and the blue volume-weighted moving average are very close in value.
Can you see the difference now?
The VWMA has the ability to help discover emerging trends, identify existing ones and signal the end of a move.
#1 – Discovering Emerging Trends
If the volume weighted moving average switches below the simple moving average, this implies a bearish move is on the horizon. This could lead to a weakening in the bullish trend or an outright reversal. If the price is able to break through both the VWMA and the SMA a bearish trend is confirmed and a short position can be initiated.
Conversely, if the volume weighted moving average moves above the simple moving average, a bullish trend change is likely around the corner. Once the price is able to break both the VWMA and the SMA to the upside, one can open a long position.
The below chart illustrates these trade setups.
Breakout through VWMA and SMA
This is a M2 chart of Deutsche Bank from August 5, 2015. On the chart, I am using the 30 SMA and 30 VWMA. As you see, after the market was range-bound for a period of time, we notice an increase in the distance between the volume weighted moving average and the simple moving average. At the same time, the price breaks out of the range, which gives us an additional bullish signal. We go long with the second bullish candle after the breakout of the range and we enjoy the impulsive move higher.
#2 – Identifying Current Tends
Here we have a simple rule, if our volume weighted moving average is between the chart and the simple moving average, then we have a signal for a trending market. Note that sometimes the volume weighted moving average will test the simple moving average as a support and resistance, depending on the primary direction of the security. These tests can be considered as an implication of a potential trend reversal. Take a look below:
Trend Following and VWMA
This is a M5 chart of Google from July 22nd, 23rd and 24th from 2015. We use the same 30 SMA and 30 VWMA as in the previous chart example.
In the green circle, you will see the moment where the price breaks the 30 SMA and the 30 VWMA in a bearish direction. At the same time, the blue VWMA further separates from the SMA and is between the SMA and the candlesticks. This is a clear “short it” signal. If you check a half an hour later, you will see that the blue VWMA is still below the red SMA, which means that the bearish trend is still intact.
The arrows show the moments, where the VWMA provided a signal for the continuation of the bearish trend. If we were to go short at any of these points, we would not be disappointed. The last red arrow shows us the moment when the bearish trend shows signs of slowing down as the VWMA and SMA begin to hug one another.
#3 – Detecting the End of a Trend
This signal is pretty much the same as when we had to discover emerging trends. The difference is we are looking for a contrary signal to the primary trend. For example, you have taken a long position and you notice a tightening in the distance between the VWMA and the SMA. This is the moment where you might want to consider the option to get out of the market and to collect your profits.
Trend Reversal and VWMA
The above chart is of Facebook from July 16th – 22nd. Facebook begins the week with a strong gap up with high volume. After the gap, we have a solid bullish candle and a large distance between the 30-period VWMA and the 30-period SMA. Therefore, we go long with the closing of the first bullish candle. Facebook keeps increasing until the volume drops and the market enters a correction phase. This is when the blue VWMA interacts with the red SMA and we get a “caution” signal. Fortunately, with the next candle, the trading volume increases and the VWMA moves again above the SMA.
Still in the game! Bullish we are!
We hold our position for about 20 more periods and we nearly double in our long position. Then, the blue VWMA switches below the red SMA (red circle) and refuses to go above for about 8-9 periods. We believe 3-4 periods of waiting are enough in order to realize that this is the right moment to close our position. After we exit our position, the price of Facebook starts to rollover and eventually breaks down through the moving averages. Exiting Facebook at the right time brought us a profit of about 55 bullish pips! Viva les Market Volumes!
#4 – The VWMA Divergence
Yes, that is correct! You can discover divergences between the volume weighted moving average and the general chart. You will say, “How could this be possible? This is not an oscillator!”
Nevertheless, the volume weighted moving average could be in a divergence with the chart, and the secret is in the second moving average we advised you to use. When you have for example a simple moving average in addition to the chart, the volume weighted moving average will switch above and below your simple moving average depending on trade volume. Therefore, whenever the volume weighted moving average is closer to the chart than the simple moving average, we can say that the market is trending and volumes are increasing! Still not getting “the divergence”, let’s walk through a chart example.
Divergence and VWMA
Above is an M15 chart of Microsoft from the first seven days of October, 2015. As you see, after a strong bullish movement, the blue volume weighted moving average moves below the red simple moving average. Therefore, we expect to see a decrease on the chart. Although the bullish movement loses its intensity, the price of Microsoft still manages to close higher for a few candlesticks. This all happens while the blue volume weighted moving average stays beneath the red simple moving average, thanks to the bigger trading volumes shown on the bottom of the chart. This is a bearish divergence, which you could use as an opportunity to go short.
Divergence and VWMA – 2
KABOOM! The result is 100 bearish pips and a successfully traded bearish divergence between the chart and your 20-period volume weighted moving average. Note, the high bearish volumes at the bottom, which appeared right after the divergence and right before the drop of the price. These bearish volumes also confirm the authenticity of our bearish divergence.
In Summary
In conclusion, we could say that although the volume weighted moving average looks complicated at times, it is not!
If you have difficulties understanding the VWMA, just open a volume indicator at the bottom of your chart. It will give you a better picture explaining the “chaotic” movement of the VWMA in comparison to the SMA.
The volume weighted moving average places a greater emphasis on periods with higher market volume.
The volume weighted moving average is a better indicator when combined with another trading instrument for trading signals.
The simple moving average is a great tool to combine the volume weighted moving average.
VWMA can provide the following signals
A trend is coming!
A trend it is!
The trend is ending!
The VWMA can also identify divergence in the market
Alton Hill is the Co-Founder of TradingSim with over 18 years of trading experience. He completed the Design Thinking Bootcamp at Stanford’s D.School and brings expertise in Product Development to create the best trading simulation experience. His strategy focuses on trend-following systems, targeting high-volatility stocks with strong primary trends using the 15-minute chart.
How to Trade Diamond Chart Patterns – Winning Strategies
Diamond Chart Pattern Definition A diamond chart formation is a rare chart pattern that looks similar to a head and shoulders pattern with a V-shaped neckline. Diamond chart reversals rarely happen...
What is Pyramiding? Pyramiding is an old trading strategy where a speculator adds to their position size by using margin from unrealized gains. This trading strategy is based solely on the power of...
Early Morning Range Breakouts – 4 Trading Strategies
The early morning range breakouts are the bread and butter for many a trader. If you look at trading gurus like Ross Caremoun, Tim Sykes and Steven Dux, they all have a strategy centered around early...


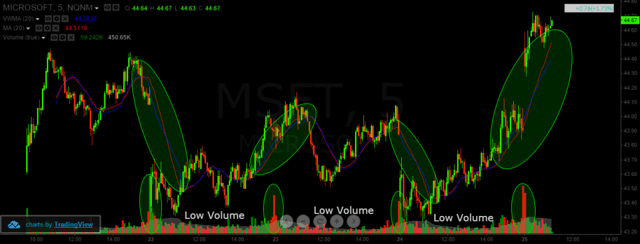
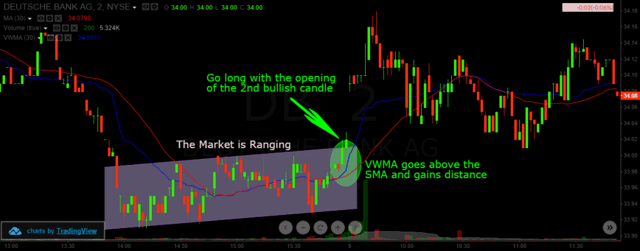
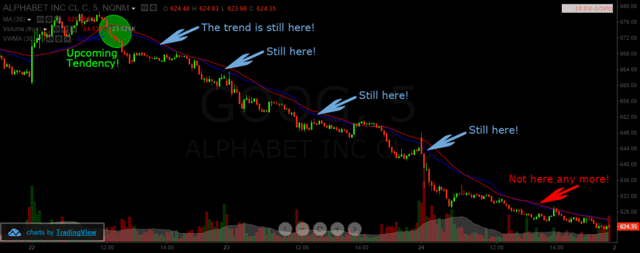
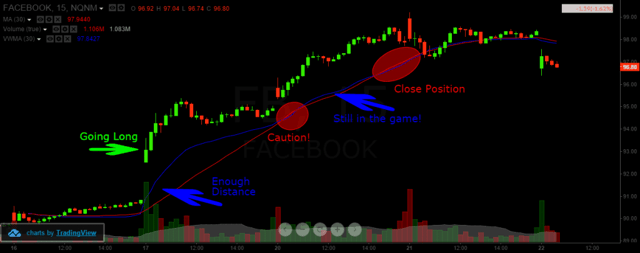
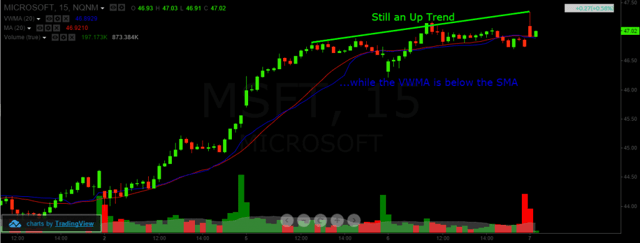
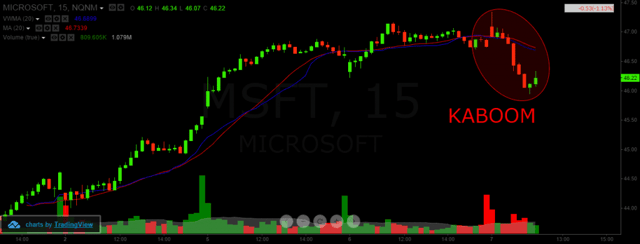


 Chart Patterns


