✓ Reviewed by Al Hill, Co-Founder of TradingSim · Updated Mar 29, 2026
Most day traders have likely heard of the Opening Range Breakout (ORB) strategy popularized by Toby Crabel in his classic investing book Day Trading With Short Term Price Patterns and Opening Range Breakout. In prior posts, we discuss this strategy in detail regarding the popular 5, 15, or 30 minute opening range breakouts. However, the 1 minute ORB is gaining popularity thanks in part to the hyper-scalping techniques of traders like Andrew Aziz from BearBullTraders.com.
In this post, we’ll shed some light on this new take on an old strategy to uncover many of the criteria necessary to make these trades successful.
Before we do, take a look at this quick video as a primer on scanning for the 1 Minute ORB in TradingSim.
What is the 1 Minute ORB?
Essentially, the 1 minute ORB is a long or short strategy that is initiated once a stock breaks the first 1-minute candle of the trading day.
Granted, there are quite a few contextual caveats that must be considered, and which we will cover. But for all intents and purposes, you’ll have but a few seconds to a few minutes to make a decision to enter the stock long or short on this 1-minute candle break.
Here’s a quick visual of what this might look like:
APOP 1 minute ORB
Noticeably, the stock closes above the body of the first 1-minute candle of the morning and then pushes higher by the third candle of the day.
This can also be replicated to the downside as a shorting strategy.
5 Long Criteria for the 1 Minute ORB
As with any setup, there are usually quite a few criteria that must confirm the trade. Call them signals, if you will. For a long entry, the qualifying criteria for the 1 Minute ORB are as follows:
A decent gap: ideally 2% or more depending on the market cap and price
Good liquidity: you want your orders to fill quickly and efficiently
Clear directional trend: is it choppy or a potential continuation or bigger picture breakout
Support at the open along an important moving average or VWAP
A break of the 1-minute candle body or high/low
Let’s break each one of these down using chart analysis.
1. A Decent Gap
One of Andrew Aziz’s prior examples of a trade he took was APOP. It was an opportunity to play this strategy to the long side. We showed the chart of APOP above, but let’s look at it again and analyze the gap percentage for that particular day.
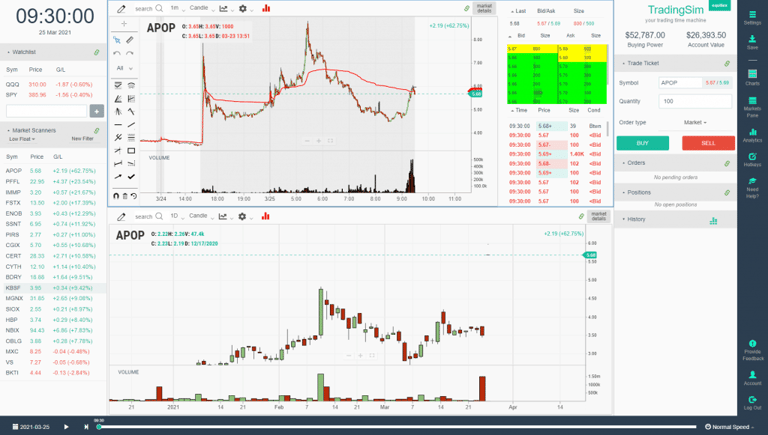
When looking at the premarket and the daily chart on APOP, we see that it is gapping around 65% by the time the market opens. Despite putting in some major swings in the premarket seen below, the prior close was $3.47 and the current open is $5.68.
APOP Gap
This is plenty of gap. In fact, in some cases the gap could be so big that you might expect some resistance off the open. But the 1 minute ORB is a very short time frame strategy that can give results on just a single candle.
In comparison, the longer time frame 5-minute ORB can often lead to bigger moves. This particular day eventually created a 5-minute ORB, but let’s zero in on the 2nd criteria for identifying the 1 minute ORB, first.
2. Good Liquidity
As Aziz notes in his book Advanced Techniques in Day Trading: A Practical Guide to High Probability Day Trading Strategies and Methods, volume is key. But not just any volume. Here’s how Andrew describes what he’s looking for:
I prefer stocks that have high volume, but also with numerous different orders being traded. If the stock has traded 1 million shares, but those shares were only ten orders of 100,000 shares each, it is not a liquid stock to trade. Volume alone does not show the liquidity; the number of orders being sent to the exchange is as important.
Andrew Aziz
With that in mind, let’s head back to our APOP stock and check out the volume.
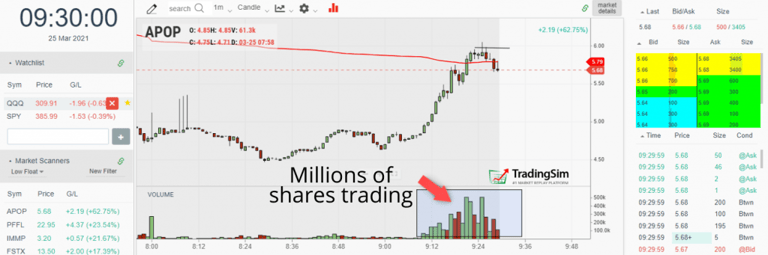
Take into account that the daily chart on APOP rarely trades into the millions of shares. However, on this particular morning, whatever the catalyst, APOP was trading millions of shares before 9:30 am. There was likely huge retail and institutional interest on this day.
APOP volume preceding the 1 minute ORB
This gives the confidence that leading into the open, there should be plenty of liquidity to fill a decent size position if needed.
And this leads us to the 3rd criteria of direction.
3. Clear Direction
Notice in the image shared above that APOP has broken out of a consolidation in the premarket and is now trending higher before the bell.
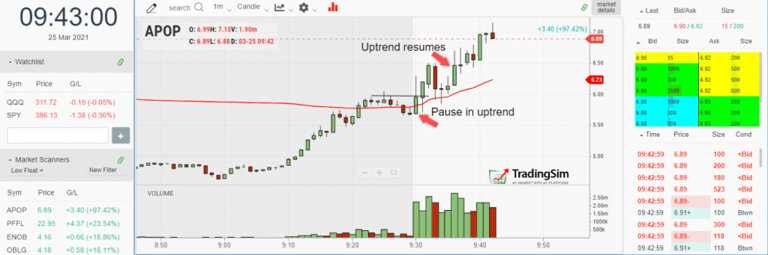
Ideally, you’ll want to see the stock pause here briefly, then continue or start in the same direction once again.
Hindsight is 20/20, but this snapshot gives you the idea of what to look for:
APOP Trend Continuation
This, of course, is the ideal situation. However, there may be times when a stock gaps up or down and then reverses course. These can give excellent opportunities to flip your position if the context is right.
But for this particular scenario, APOP did, in fact, continue in the direction of the pre-market gap.
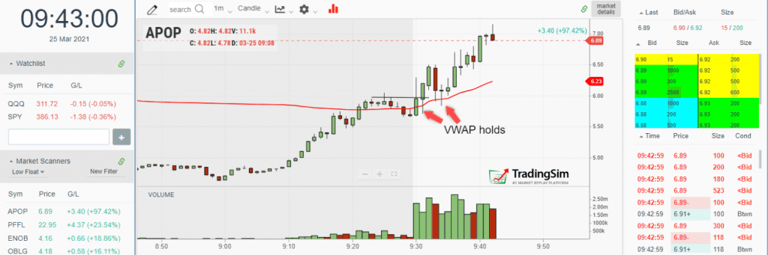
You’ll notice a reddish-orange line in the images we’ve shared of APOP thus far. That line is the VWAP, or Volume Weighted Average Price. If you’re unfamiliar with this indicator, or its usefulness, be sure to check our Ultimate Guide to VWAP.
This line is a rough estimate of where the “average” price of most of the trading has taken place. What’s peculiar about this particular trade with APOP is that the price was trending drastically below this level until the market opened.
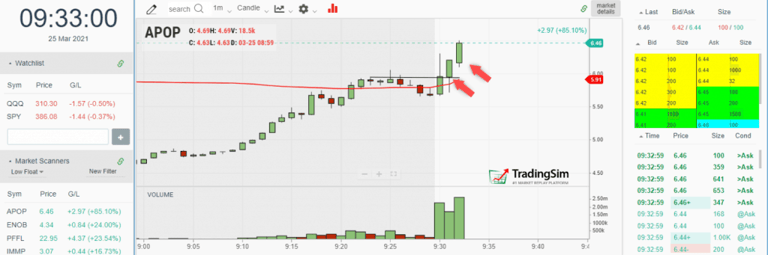
After reclaiming this important area around 9:20 am, the stock dipped below VWAP at the bell, then reclaimed it by the second bar of the day. This is shown by the orange arrow below:
APOP 1 minute ORB vwap
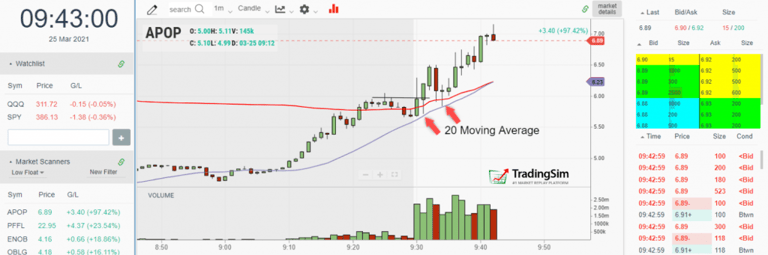
On the same token, APOP found support along one of the more popular moving averages, namely the 20 simple moving average.
20 Moving Average
Clearly, you can see the stock “surfing” this purple line, and vwap, as it continues along its upward trajectory. Granted, the only opportunity you have to recognize this is the first pullback at 9:32 am. The second pullback gave another opportunity for a 5 minute ORB.
For more information on 20 moving average pullbacks, be sure to check out this post.
And now that we have 4 of the 5 criteria met, all we need is for the second or third candle to break the first candle.
5. A 1-Minute Candle Break
Choosing when to enter can be a bit discretionary. After all, we’re talking seconds, and usually the most volatile part of the entire trading day.
To that end, hotkeys can be beneficial for these types of trades. Limit orders may or may not get filled.
It all depends on the size you are trading, the broker, the volatility of the stock, and your quickness.
Regardless of how you choose to place your orders, the generally accepted place to enter is on the close above the first 1-minute candle body or wick. Some traders, like Aziz, will often start in as he feels the stock’s strength or weakness.
You might add as the stock continues in your favor.
Ideally, you’ll want at least a 1/1 risk to reward ratio. And for this, you’ll need to place your stop at the low of the first candle, though Aziz sometimes cuts it sooner if the stock isn’t acting correctly.
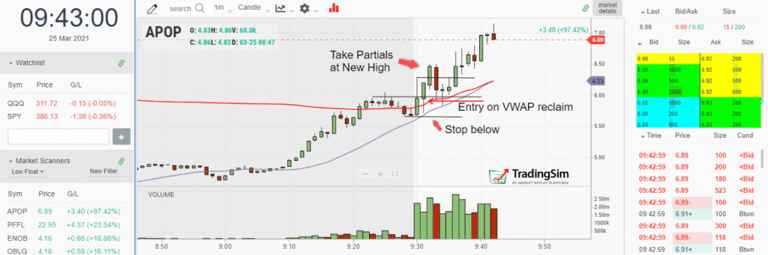
Here’s a quick breakdown of how you could play this opening range:
1 Minute ORB entry and stop
In this image, you have the low and high of the 1st candle. Then you get an entry signal at the reclaim of vwap as a sign of strength and the ensuing break of the first candle body. Also, note that the candle body coincides with a pivot high from the premarket session drawn on the chart. This could add to any “early entry” criteria you might look for.
Profits can be taken into the strength of the 3rd candle, which set a new high.
Keep in mind this is all happening at a blistering pace.
The alternative would be to wait for the pullback and play a 5 minute ORB. This would have worked on this particular day as the 7th-minute candle broke to new highs.
Another 1 Minute ORB Long Example
Putting all of these criteria together, let’s look at another example of a 1 Minute ORB that worked well.
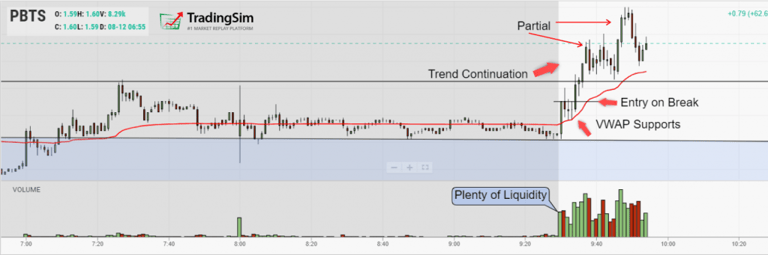
PBTS had a considerable gap of 35% on this particular day. Volume was well above the normal range in the premarket as well. Have a look at the annotations on the chart to get a feel for where you would enter and what to look for.
PBTS 1 Minute ORB
You can also put a checkmark by trend continuation, vwap support, and a break of the 1st one-minute candle.
From the far left of the chart in the premarket, the trend was clearly upward. We then see a tight consolidation into the open and a quick reclaim of vwap on the first candle.
We then get a retest of vwap on lower volume, a bullish sign. Volume then returns pushing us to new highs and continuing the uptrend.
In this instance, even if you had taken the initial entry that broke the 1st candle, you’d still be in play without stopping out below the first candle. Otherwise, the pullback gave a great opportunity to go long or add to that position.
1 Minute ORB Short Example
Just as an Opening Range Breakout can work to the long side, so can an Opening Range Breakdown work to the short side. The great news is that the criteria are basically the same, just mirrored for selling pressure.
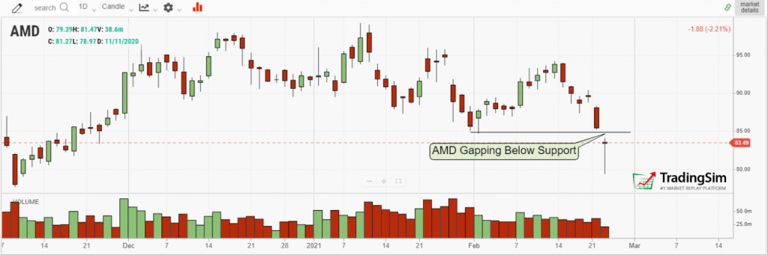
To illustrate this, take a look at this daily chart of AMD. On this particular morning, AMD was gapping down considerably below a prior daily support level as shown.
AMD gap down
And as you can probably tell from the long wick below this candle, the open provided a fantastic opportunity to get short. The question is, was it a 1 minute ORB? It sure was. In fact, it presented with a perfect 3-Bar Play setup as well.
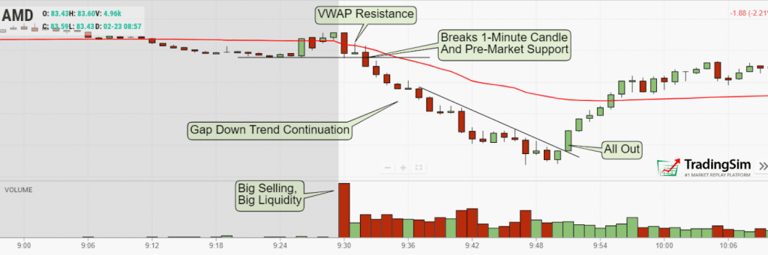
Zooming in on the 1-minute chart, take a moment and pick apart the 5 criteria we want to look for.
AMD 1 Minute Opening Range Breakdown
Sure enough, all 5 of our criteria were taken care of. The gap, the trend continuation, the vwap resistance, a breakdown, and plenty of liquidity. Not bad for a $3.50 move in only 15 minutes!
You may be thinking, but what happens if the stock doesn’t break down? And that’s a great question.
Failed ORBs and Reversals
The lesson wouldn’t be complete without painting a realistic picture of what could happen. To that end, let’s look at a good example of a stock that was about to breakdown, but found support and reversed.
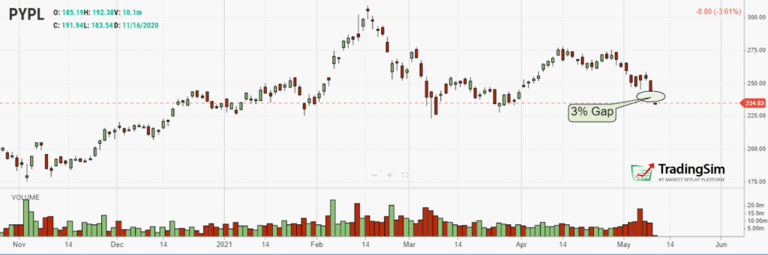
PYPL provides us with a great example of what could happen. Like AMD, it was gapping down on considerable volume on this particular day. Here is the daily chart:
PYPL 3% gap down
So our criteria are set for the gap down. We also know that PayPal (PYPL) is an actively traded stock, so there should be no issues with liquidity. What we need to answer, though, is whether the remaining three criteria are being met.
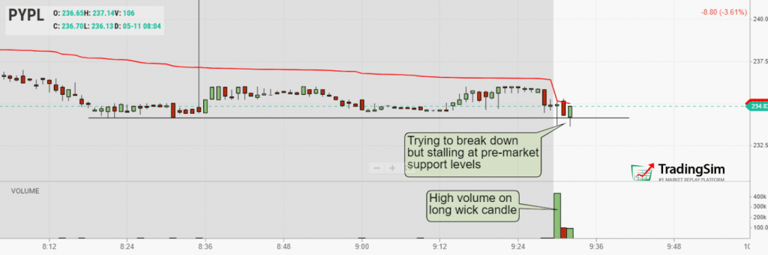
To do that, let’s zoom in and see what happens on the 1-minute chart around 9:30 am.
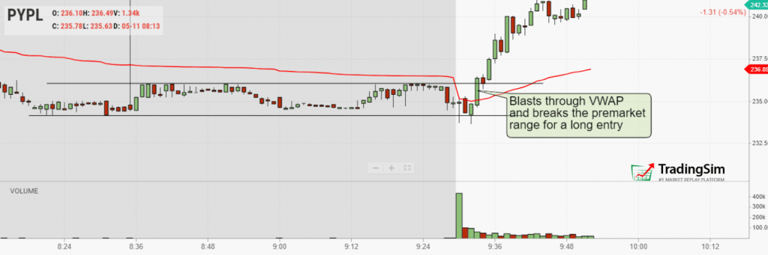
PYPL 1 minute ORB
Immediately we notice that the stock is trying to press lower through the premarket support levels. However, it appears to be struggling to do so. You might say it’s finding strength here at this key level. If it is going to be a proper ORB, it needs to break down soon.
The Reversal
Let’s see what happens next.
PYPL 1 minute ORB reversal
Clearly, PYPL didn’t want to go lower.
Be sure to compare this chart with the AMD example given above. You’ll notice some very specific details in the formation of the candles and the associated volume that will give you clues as to how to anticipate a reversal like this in the heat of the moment.
Now, what this doesn’t mean is that there is no trade to be taken here. In fact, if you are a nimble trader like Andrew Aziz, you may decide to flip your bias and go long. After all, there is still a 1 minute ORB in play, just not in the direction of the prevailing trend.
Andrew has a great video showing how he plays a similar move in PYPL here, so be sure to check that out.
Putting the 1 Minute ORB into Practice
Here at TradingSim, it is our goal to equip you with the tools necessary to become a consistently profitable trader. In order to do that, it requires intentional practice and identifying your edge through simulation.
To that end, we’ve created a scanning tool that will help you identify premarket gappers for each day spanning back 3 years. You can narrow your results by market cap, float, and many other criteria.
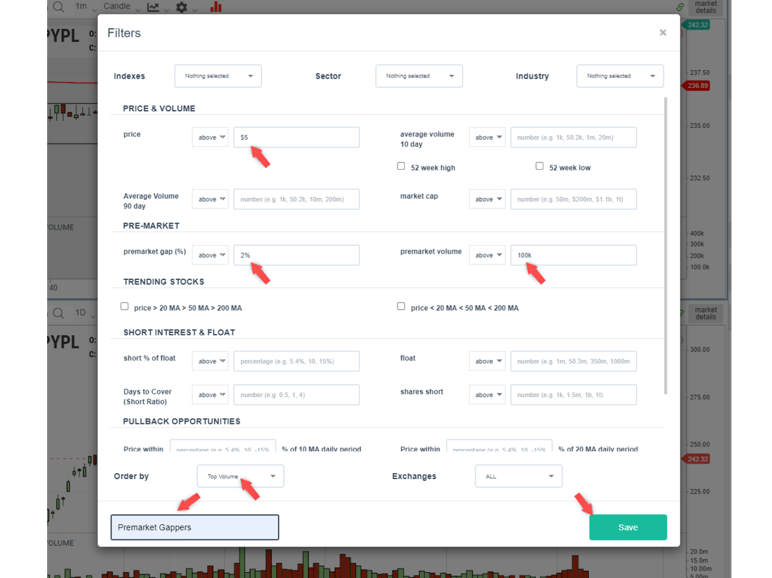
Here is an example of what our scan filter looks like:
TradingSim Scan Filter
Notice we’ve created a filter for this example that has a price minimum of $5, premarket volume above 100k shares, and a premarket gap of at least 2%.
We then order our results by Top Volume, name it, and click save. This sets us up for the results given to us in our “live” replay pane on the left-hand side of the screen.
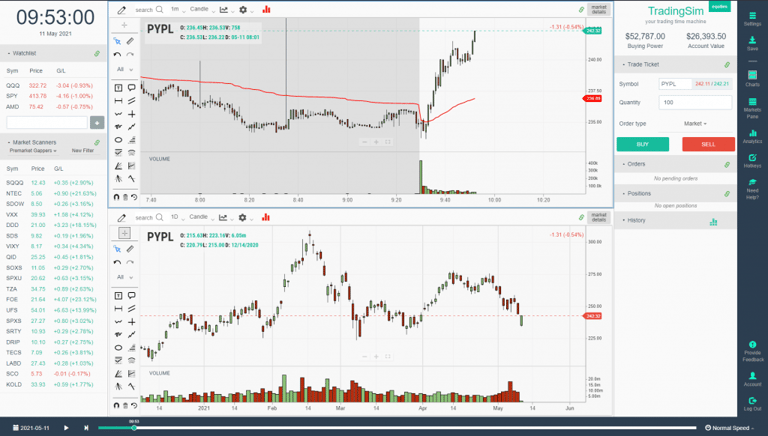
Scan results on left-hand side
You, the trader, then have the ability to comb through the list looking for the best opportunities to fit your style. And then practice as though it were a real environment!
Conclusion
We hope you’ve found the information and resources in this tutorial useful. Be sure to subscribe to our blog for more great content and give us a follow on Twitter.
Also, be sure to give Andrew Aziz a like and a follow for sharing this great strategy with the Fintwit community.
John McDowell is the Lead Content Strategist at TradingSim. His journey into day trading began in 2016 after conversations with a retired hedge fund manager. John is passionate about teaching and educating traders, curating content that helps others succeed in the stock market.
How Oliver Velez Trades the Open Like a Boss: 4 Key Takeaways
How Oliver Velez trades the open is fun to watch. Thankfully, he shares a lot of his trading wisdom for free on YouTube. To that point, one really great free series he’s created is called “Trade the...
What are the Fibonacci sequence and the Golden ratio? A Fibonacci sequence is a number pattern that was discovered and introduced in the 13th century by the Italian mathematician Leonardo of Pisa,...
If you do a search on the web for stock market simulators, you will get a laundry list of sites. Some are free and others can cost quite a penny. I will lay out in this article a couple of key things...


 Awesome Day Trading Strategies


