Three Fibonacci Trading Strategies + Infographic & Video [Updated April 2026]
Apr 22, 2026
Written by: Al Hill
✓ Reviewed by Kunal Vakil, Co-Founder of TradingSim · Updated Apr 22, 2026
At times it feels like traders give the Fibonacci trading sequence an almost mystical power. Yet, despite its mysterious accuracy in trading and in nature, Fibonacci is nothing more than simple retracement levels. These levels are the only representative of where a security could have a price reaction, but nothing is etched in stone.
In the stock market, the Fibonacci trading strategy traces trends in stocks. When a stock is trending in one direction, some believe that there will be a pullback, or decline in prices. Fibonacci traders contend a pullback will most likely happen at the Fibonacci retracement levels of 23.6%, 38.2%, 61.8%, or 76.4%. As we’ll discuss below, a pullback is also possible at 50%.
For instance, if GE (NYSE:GE) is selling at $20 and rises to 21, the pullback will be 23, 38, 50, 61, or 76 cents. Fibonacci traders will expect support at these levels.
On the contrary, some day trading experts see these Fibonacci numbers as a short-sell strategy. For instance, if GE stock is at $21 and falls to $20.62, some Fibonacci traders may see the 38 cent drop as a good sign to short the stock.
For all intents and purposes, the Fibonacci retracement is a valid trading strategy to trade stocks. However, Fibonacci numbers aren’t always the best indicators of a trend.
What do trading experts say about Fibonacci trading?
“I am a huge fan of EW[Elliott Wave, another trading strategy] and Fibs, but it does require some experience to handle it. Using moving averages does in my view shorten the learning curve. Also using price swings or EW as a support tool rather than a main trading tool, I think, makes it less complicated, ” said Svorcik.
Daniel Leboe, an analyst with Zach’s, also likes using the Fibonacci retracement. However, he also advises caution to traders when using the trading strategy.
“Fibonacci retracement is a good tool to use when deciding if now is a good time to buy, but do not look at it as the holy grail. In this volatile market, we are prone to blow through levels. Make sure you have a shopping list of stocks you like ready so that you can pull the trigger when the time comes,” said Leboe.
“Fibonacci queen” says traders should have a plan with trading strategy
Experienced trader Carolun Boroden trades so often with the Fibonacci strategy that she’s been dubbed the “Fibonacci Queen.” She says that even if traders follow the Fibonacci strategy, they should still have a specific trading plan.
“You [need] a specific plan that describes what your trade setups are; how you’re going to get into the trades; what you are going to risk; how you’re going to manage the trade and take profits; how you’re going to have certain targets, or you’re going to trail a stop.”
Carolun Boroden
Does the Fibonacci trading strategy predict stock market trends?
While some financial experts are skeptical of the Fibonacci strategy, it has predicted other downturns before. In February before the COVID-19 crisis, the Dow Jones retraced about 50% before the economic crash. Andrew Adams is a technical analyst at Saut Strategy. He wrote in a research note that the pullback at that ratio meant an end to the previous bull market.
“Rallies of all sizes do regularly eventually pull back at least to the 38.2%-50% Fibonacci levels,” wrote Adams.
Not long after that retracement, the bear market devastated the stock market.
While the strategy has predicted a bearish market, it can also predict a bullish market as well. According to CNBC’s Jim Cramer, Boroden’s Fibonacci strategy predicted a stock market recovery in May.
“The charts, as interpreted by Carolyn Boroden, suggest that the major averages are still in rally mode, but it’s a precarious rally where you need to proceed with caution if we fail to break out from these levels and slip back to where we were not that long ago,” said Cramer.
“She thinks the S&P is a buy right here. There’s too much going right in her charts for her to say anything else. However, she says you should be ready to sell if we fail to break out over the 200-day moving average, eventually,” added Cramer.
While the Fibonacci trading strategy isn’t exact, if used correctly, it can predict major stock market trends. The different Fibonacci trending strategies will be explored in this article.
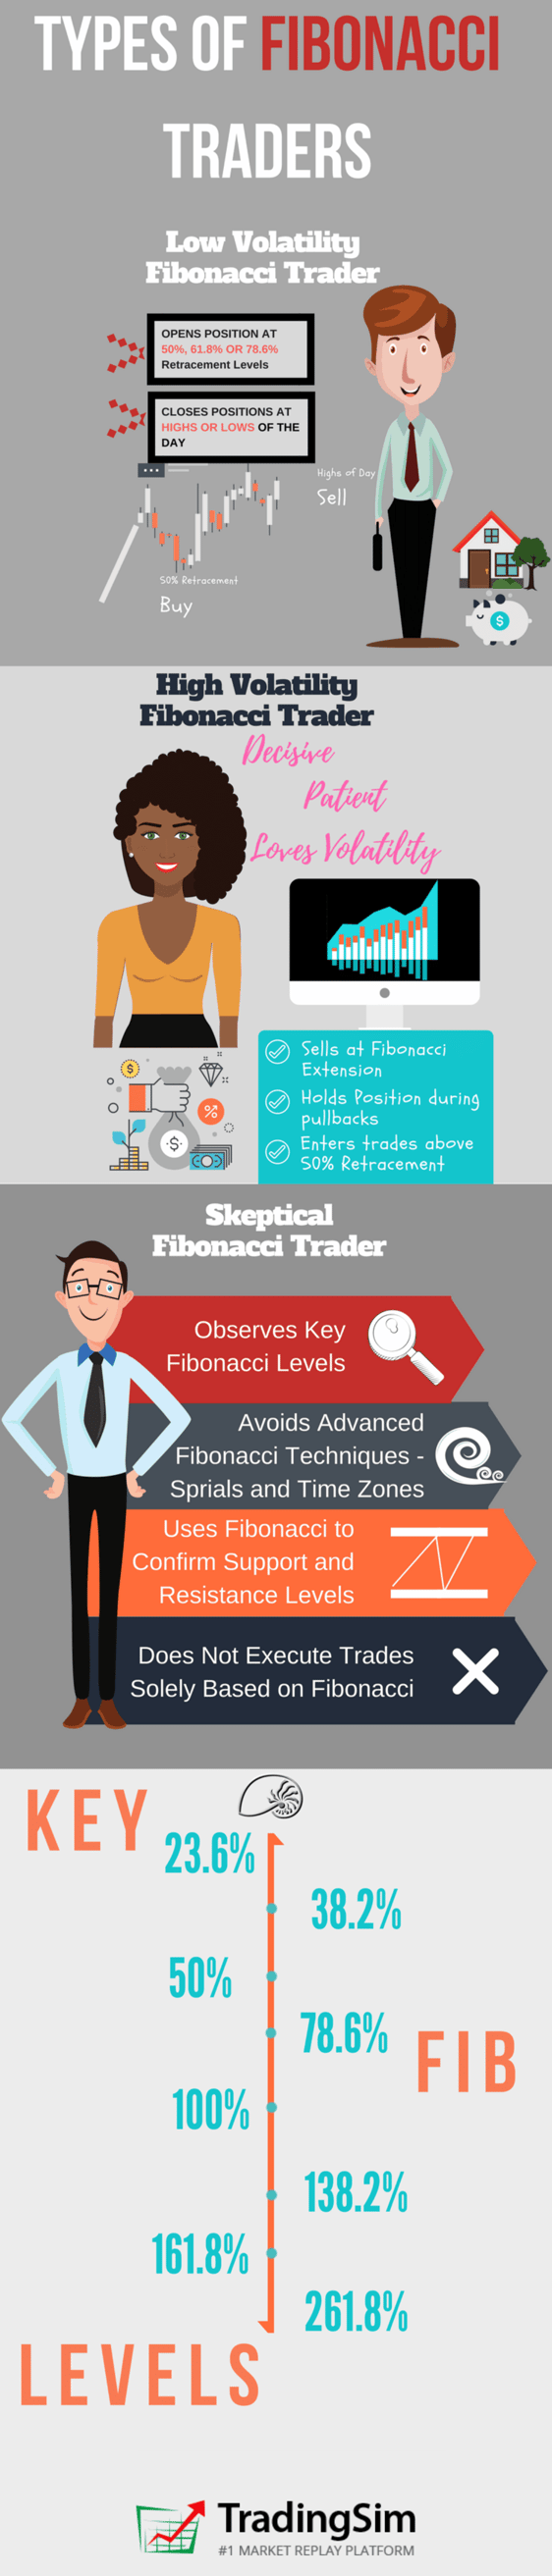
Fibonacci Trading Personas
Before we go into the gritty details about Fibonacci trading strategies, it is worth our time to discuss the different types of fibonacci trading personas you might encounter. While mostly fictitious, these three personas do an awesome job of summarizing common trading practices.
Which Persona Best Describes You
You must first ask yourself the question of how you plan on leveraging Fibonacci in your trading regimen. If you haven’t done so already, think about writing a trading plan to review before, during, and after the market closes.
Depending on what the market is offering, you might fluctuate between the low and high-volatility Fibonacci trader. Or, you may find yourself only using Fibonacci as an ancillary tool to support your trade plan thesis.
Fibonacci assists in seeing hidden levels of support and resistance to help you determine your entry and exit targets. To what degree you emphasize these levels depends upon your own conviction with the tool.
Chapter 1: Origin of the Fibonacci Sequence
Does this numbering scheme mean anything to you – 0, 1, 1, 2, 3, 5, 8, 13, 21, 34, 55, 89, 144, 233, 377? Not really, right?
Hundreds of years ago, an Italian mathematician named Fibonacci described a very important correlation between numbers and nature. He introduced a number sequence starting with two numbers: 0 and 1.
The sequence requires you to add the last two numbers to get the next number in the sequence. Following this logic, we get the following equation:
0 + 1 = 1
Now we have our third number in the sequence – 1. See below for the updated sequence.
0, 1, 1
Now we add the last number in the sequence to the previous number once again:
1 + 1 = 2
We again update our sequence with the number 2.
0, 1, 1, 2
and then…
1 + 2 = 3
and then…
0, 1, 1, 2, 3
and then….
0, 1, 1, 2, 3, 5
and then….
0, 1, 1, 2, 3, 5, 8
and then….
0, 1, 1, 2, 3, 5, 8, 13
This process goes on to infinity.
Chapter 2: Key Fibonacci Ratios
Fibonacci discovered every number in the sequence is approximately 61.8% of the next number in the sequence.
55 / 89 = 0.6179775280898876 = 61.8%
233 / 377 = 0.6180371352785146 = 61.8%
144 / 233 = 0.6180257510729614 = 61.8%
This is not the only correlation. Fibonacci also uncovered that every number in the sequence is approximately 38.2% of the Fibonacci number two steps ahead.
(13, 21, 34)
13 / 34 = 0.3823529411764706 = 38.2%
(21, 34, 55)
21 / 55 = 0.3818181818181818 = 38.2%
(55, 89, 144)
55 / 144 = 0.3819444444444444 = 38.2%
(144, 233, 377)
144 / 377 = 0.3819628647214854 = 38.2%
Also, we have another ratio! Every number in the Fibonacci sequence is 23.6% of the number after the next two numbers in the sequence:
(55, 89, 144, 233)
55 / 233 = 0.2360515021459227 = 23.6%
Pretty cool, huh?
Chapter 3: Fibonacci Ratios Everywhere
Fibonacci Sea Shell
Here is an example of the Fibonacci in nature with this seashell. The volume of each part of the shell matches exactly the Fibonacci numbers sequence. Thus, each part of this shell is 61.8% of the next.
It works the same way with this aloe flower:
Aloe Flower Fibonacci
If we separate the aloe flower into even particles, following the natural curve of the flower, we will get the same 61.8% result.
This ratio is not only found in animals and flowers. This ratio is literally everywhere around us. It is in the whirlpool in the sink, in the tornados when looked at through satellite in space or in a water spiral.
The Fibonacci ratio is constantly right in front of us and we are subliminally used to it. Thus, the human eye considers objects based on the Fibonacci ratio as beautiful and attractive.
On that token, big corporations like Apple and Toyota have built their logos based on the Fibonacci ratio. After all, these are two of the most attractive and engaging logos in the world.
Without knowing anything about Fibonacci trading, you would likely say 50%.
That my friend makes you a Fibonacci trader.
That’s what Fibonacci trading is about, understanding stocks do not move in a linear fashion. Fibonacci helps new traders understand that stocks move in waves and the smaller the retracement, the stronger the trend.
Now, it’s time to take you to the level of an intermediate Fibonacci trader. To do this, you need to know the other two critical levels – 38.2% and 61.8% retracement.
Price action must be analyzed at these levels to understand if the countertrend move will stop and the trend will resume.
Fibonacci retracement levels are used by many retail and floor traders [3], therefore whether you trade using them or not, you should at least be aware of their existence.
Some advanced traders will take it a step further and add Fibonacci arcs and Fibonacci fans to their trading arsenal in search of an edge. We will touch on these later.
Chapter 5: How to Interpret Fibonacci Levels
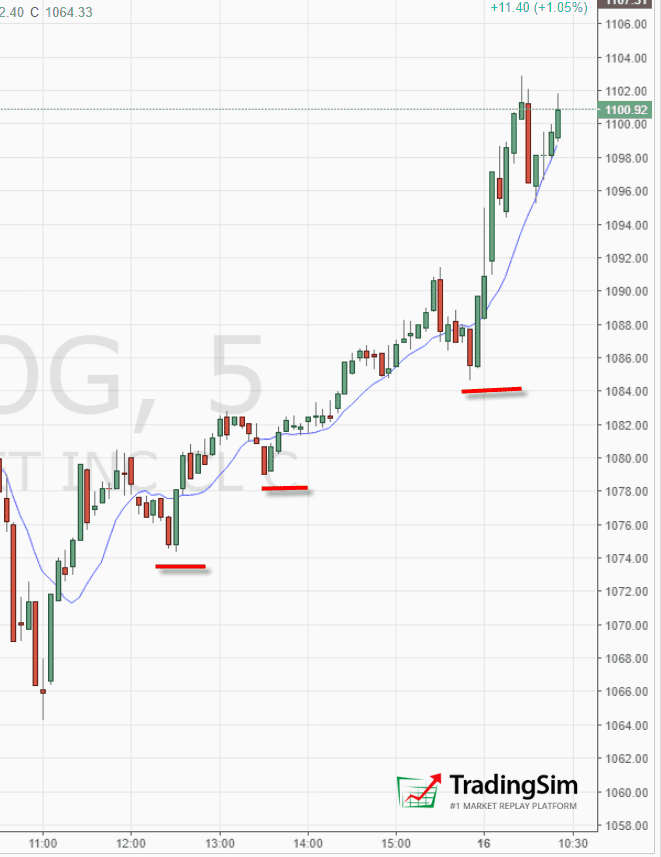
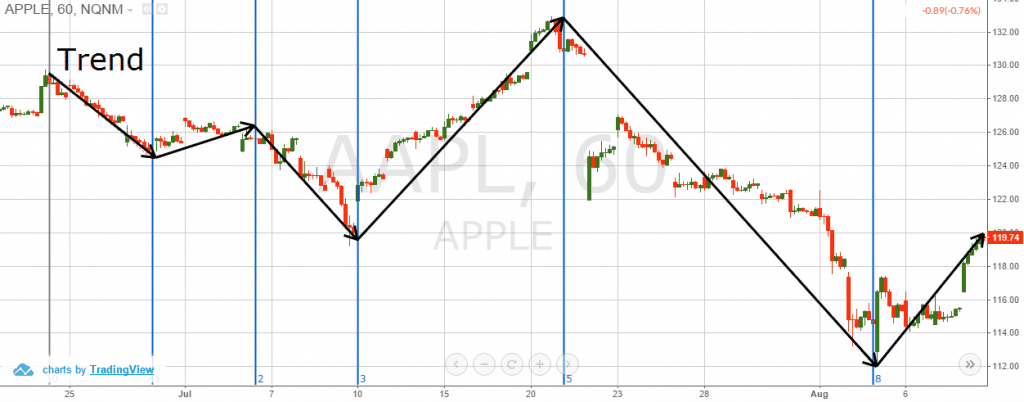
Defining the Primary Trend
Strong Uptrend
Defining the primary trend with Fibonacci requires you to measure each pullback of the security. If you see a series of new highs with retracements of 50% or less, you are in a strong uptrend.
Strong Uptrend
The above chart is of Alphabet Inc., on a 5-minute chart. Notice how Google doesn’t have any retracement greater than 50%. These successive new highs with minor pullbacks are the sign you are in a strong uptrend.
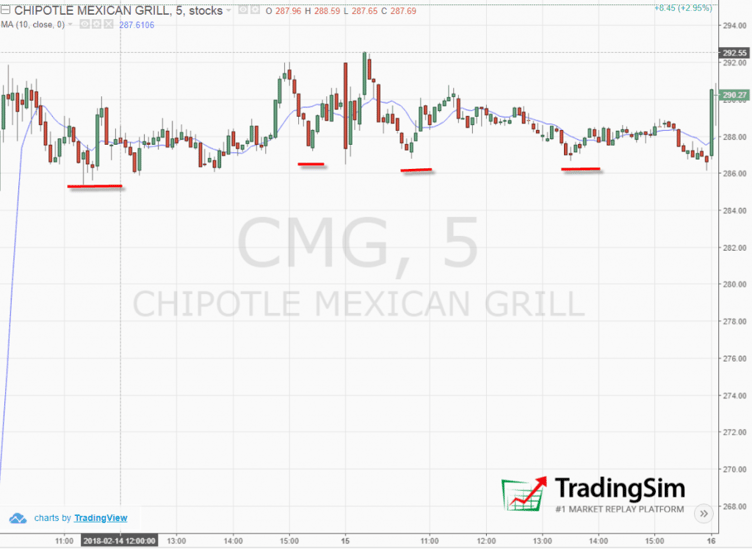
Choppy Market Fib Levels
Here is another example of a trend with Chipotle (CMG).
Choppy Market
Do you see how each pullback is greater than 78.6% from the initial range? This level of retracement repeatedly produces a choppy pattern. Therefore, you would not want to have lofty profit targets on a trade while the stock is in a tight trading range.
78.6% is not a hard-fast rule. If you see retracements of 61.8% or 100%, the stock is likely in a basing phase before the next move.
That’s it, you now understand how to use Fibonacci to define the strength in the market.
Remember, the market is either trending or flat.
A general rule of thumb for the overall market is it trends 20% of the time and is range-bound the other 80%.
Chapter 6: Three Simple Fibonacci Trading Strategies
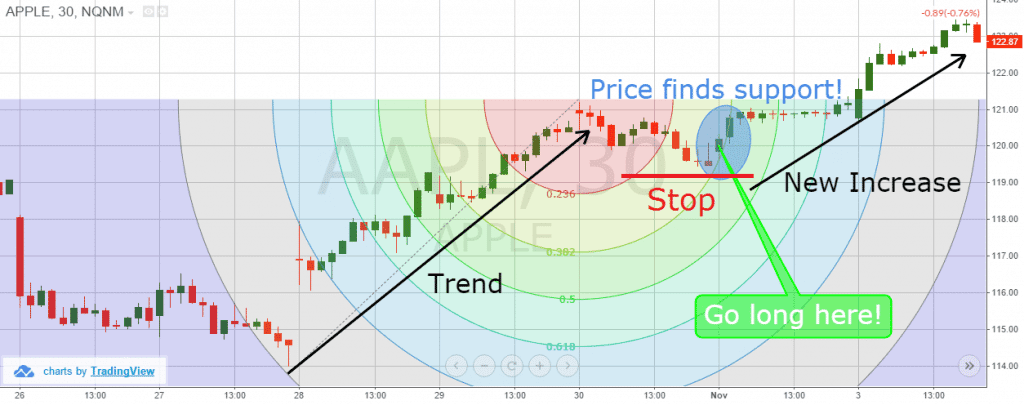
#1 – Pullback Trades
First, you want to identify a security in a strong trend.
A strong trend can be defined as a stock with successive highs with pullbacks of less than 50%.
If you are day trading, you will want to identify this setup on a 5-minute chart 20 to 30 minutes after the market opens.
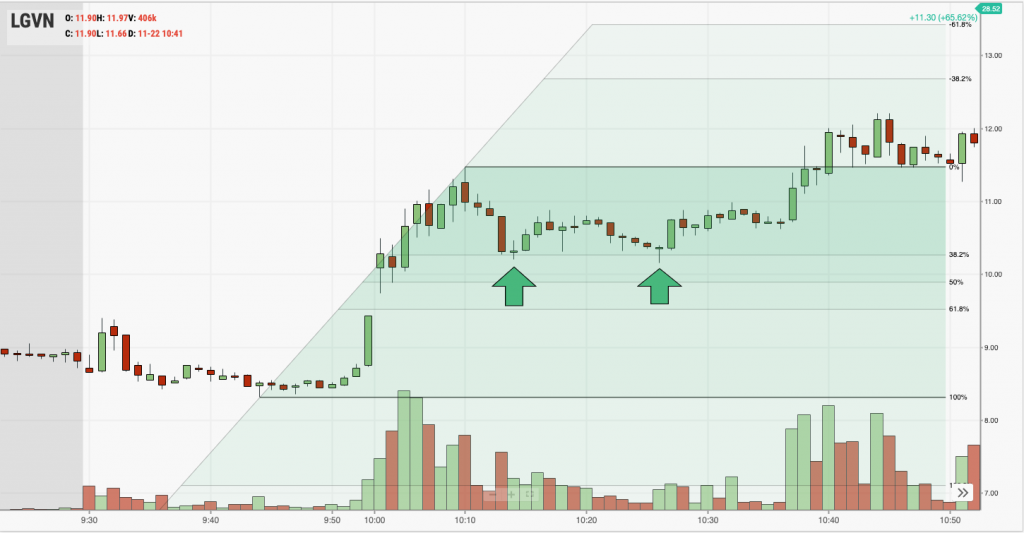
After identifying a strong uptrend, observe how the stock behaves around the 38.2% and 50% retracement levels from the morning highs by looking at the time and sales and Level 2.
Once you see the trading activity slowing down or turning, enter the trade.
You can use the most recent high or a Fibonacci extension level as a target point to exit the trade.
38.2% retracement fibonnaci trading example
In the above chart, notice how LGVN stays above the 38.2% retracement level before making a higher high.
Where Can Things Go Wrong?
The chart above looks so clean and safe. The reality is that you will likely have a 40%-70% hit rate depending on your ability to honor your rules and manage your emotions.
Therefore, you need to prepare for when things go wrong. In a pullback trade, the likely issue will be the stock will not stop where you expect it to. It may pull back to a full 100% retracement, or it could even go negative on the date.
I have had situations trading the Nikkei where a stock will have a 15% or greater swing from the morning highs.
You can protect yourself from this scenario by doing the following:
Trade Low Volatility Stocks
Penny stocks look great when a trader is discussing their 30% gain in one hour. However, it’s brutal if you are on the other side of the trade. Trade stocks with high volume and some volatility because we need to make a living, but don’t feel like you must trade with the other gunslingers.
Max Time Loss
Look back over your winning trades and determine how long it takes you to turn a profit with 85% confidence.
If that is 5 minutes or one hour, this now becomes your time stop. If there is only a 15% chance you will walk away a winner, just exit the trade with a predetermined allowable loss percentage or right at the market.
There is no way around it, you will have blowup trades. I do not care how good you are, at some point the market will bite you. To this point, have a max stop loss figure in mind.
As a general rule, we prefer 10%. But since we only use a small portion of the account size for each position, this keeps a total portfolio loss of under 2%. With lower volatility stocks, this may trigger a stop only once or twice a year.
The point is you, need to be prepared for the inevitable.
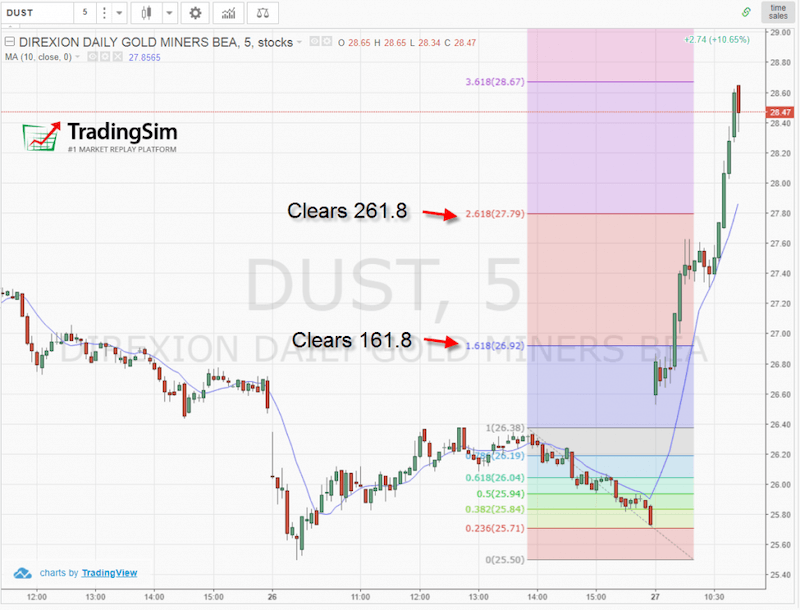
#2 – Breakout Trades
Breakout trades have one of the highest failure rates in trading. To help these odds, we’ll give you a few things you can do to up the chances of things working out.
Clearing a Fibonacci Extension Level
Fibonacci extensions are just that, once price clears the 100% retracement and presses on.
You want to find a stock clearing this extension level with volume.
Clearing Fibonacci Extension Levels
It’s not enough to just buy the breakout.
Therefore, you want to make sure as the stock is approaching the breakout level, it has not retraced more than 38.2% of the prior swing. This will increase the odds the stock is set to go higher.
Where Can Things Go Wrong?
In terms of where things can go wrong, it’s the same as we mentioned for pullback trades. The one difference is that you are exposed to more risk because the stock could have a deeper retracement since you are buying at the peak or selling at the low.
So, to mitigate this risk, you will need to use the same mitigation tactics as mentioned for pullback trades.
#3 Trading with Indicators
You can use Fibonacci as a complementary method with your indicator of choice. Just be careful you do not end up with a spaghetti chart.
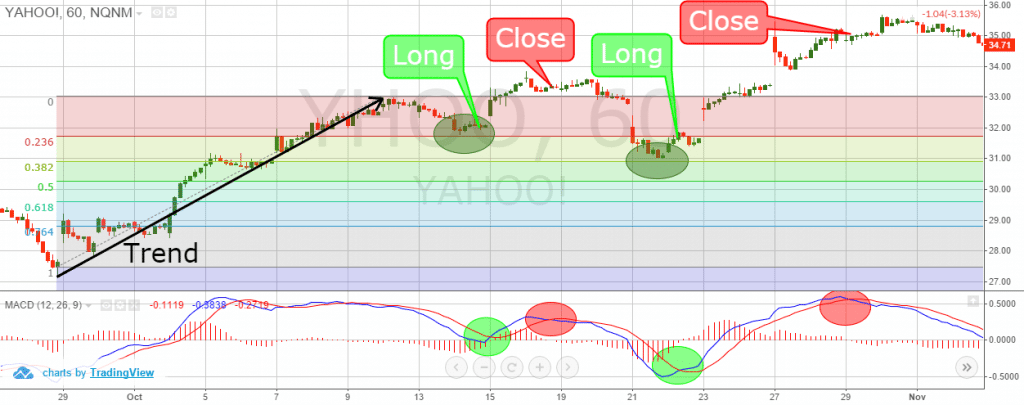
Fibonacci Retracement + MACD
This Fibonacci trading strategy includes the assistance of the well-known MACD. Here we will try to match the moments when the price interacts with important Fibonacci levels in conjunction with MACD crosses to identify an entry point.
We hold the stock until we receive a crossover from the MACD in the opposite direction.
Fibonacci MACD
This is the 60-minute chart of Yahoo.
The two green circles on the chart highlight the moments when the price bounces from the 23.6% and 38.2% Fibonacci levels.
At the same time, the green circles on the MACD show a cross up of the indicator.
Thus, we go long every time we match a price bounce with a bullish MACD crossover.
The red circles show the close signals we receive from the MACD.
We open two long positions with Yahoo and we generate a profit of $5.12 per share.
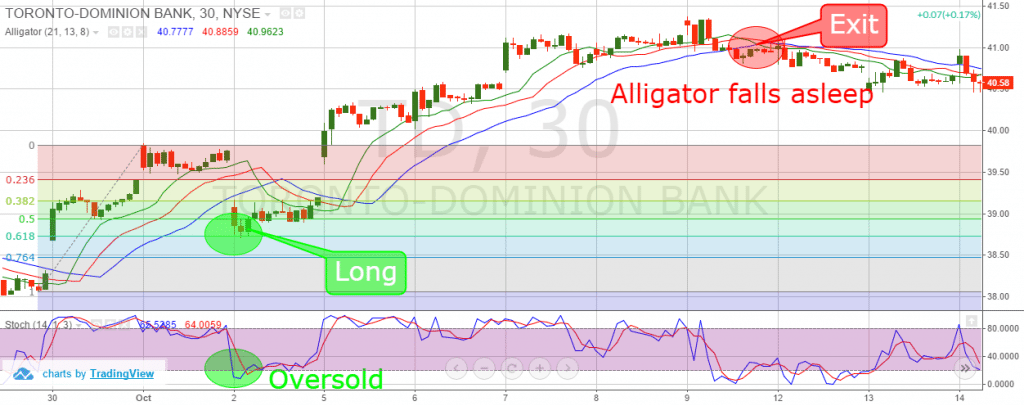
Fibonacci Retracement + Stochastic Oscillator + Bill Williams Alligator
In this Fibonacci trading system, we will try to match bounces of the price with overbought/oversold signals of the stochastic. When we get these two signals, we will open positions.
If the price starts trending in our favor, we stay in the market if the alligator is “eating” and its lines are far from each other. When the alligator lines overlap, the alligator falls asleep and we exit our position.
Fibonacci Alligator
This is the 30-minute chart of TD Bank.
The price drops to the 61.8% Fibonacci level and starts hesitating in the green circle. Meanwhile, the stochastic gives an oversold signal as shown in the other green circle.
This is exactly what we need when the price hits 61.8% and we go long! A few hours later, the price starts moving in our favor. At the same time, the alligator begins eating!
We hold our position until the alligator stops eating. This happens in the red circle on the chart and we exit our long position. This trade brought us a total profit of $2.22 per share.
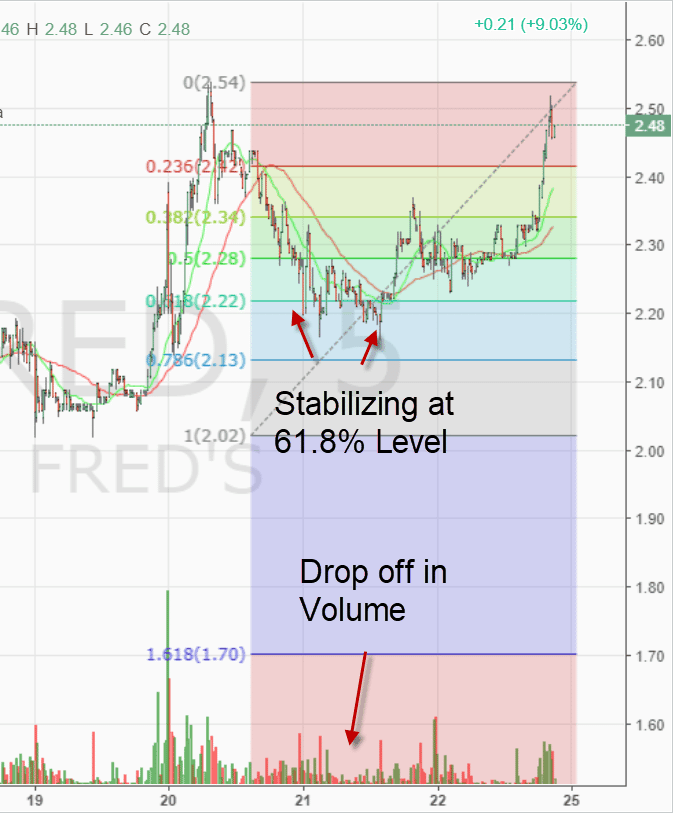
Fibonacci and Volume
We saved this one for last because it’s our favorite go-to with Fibonacci. Volume is honestly the one technical indicator even fundamentalists are aware of.
Fibonacci and Volume
We mention this a little later in the article when it comes to trading during lunch, but this method works really during any time of the day.
As a trader, when you see the price coming into a Fibonacci support area, the biggest clue you can look to is the volume to see if that support will hold. Notice how in the above chart the stock had a number of spikes higher in volume on the move up, but the pullback to support at the 61.8% retracement saw volume plummet.
This doesn’t mean people are not interested in the stock, it means that there are fewer sellers pushing the price lower.
This is where longs come in and accumulate shares in anticipation for the rally higher.
Chapter 7: Advanced Fibonacci Trading Topics
Fibonacci Speed Resistance Arcs
Fibonacci Arcs are used to analyze the speed and strength of reversals or corrective movements. To install arcs on your chart you measure the bottom and the top of the trend with the arcs tool.
The arcs appear as half-circles under your trend, which are the levels of the arc’s distance from the top of the trend with 23.6%, 38.2%, 50.0%, and 61.8% respectively.
Each of the Fibonacci arcs is a psychological level where the price might find support or resistance.
This is the 30-minute chart of Apple.
I have placed Fibonacci arcs on a bullish trend of Apple. The arc we are interested in is portrayed 38.2% distance from the highest point of the trend.
When the price starts a reversal, it goes all the way to the 38.2% arc, where it finds support. This is the moment where we should go long.
Lastly, we recommend placing a stop right below the bottom created on the arc.
Fibonacci Time Zones
Fibonacci time zones are based on the length of time a move should take to complete, before a change in trend. You need to pick a recent swing low or high as your starting point and the indicator will plot out the additional points based on the Fibonacci series.
Notice, in this case, Apple’s price undertakes a move based on Fibonacci numbers 0, 1, 2, 3, 5, and 8.
Do you remember when we said that Fibonacci ratios also refer to human psychology? This also applies to time as well.
Negatives of Trading with Fibonacci
Increased Expectations
Unfortunately, with Fibonacci trading, you begin to expect certain things to happen. For example, if you see an extension as the price target, you can become so locked on that figure you are unable to close the trade waiting for bigger profits.
If you are trading pullbacks, you may expect things to bounce only for the stock to head much lower without looking back.
Therefore, if you are trading with Fibonacci at the core of your system, expect things not to work out about 40% of the time.
Take that in for a second. That is quite a few times where you’ll be wrong. This means it is absolutely critical you use proper money management techniques to ensure you protect your capital when things go wrong.
Closing Too Soon
The other scenario is where you set your profit target at the next Fibonacci level up, only to see the stock explode right through this resistance. Thus, resulting in you leaving profits on the table.
Leaving it on the Table
What Are We to Do?
Fibonacci will not solve your trading woes. Again, you can hope to be right 60% to 70% of the time. This is not only when you enter bad trades, but also exiting too soon.
So, what are we to do?
The answer is to keep placing trades and collecting your data for each trade. You will have to accept the fact you will not win on every single trade.
However, everyone isn’t as pessimistic as Ken, so you can go with 50% or 61.8%. It all depends on what the stock is actually doing.
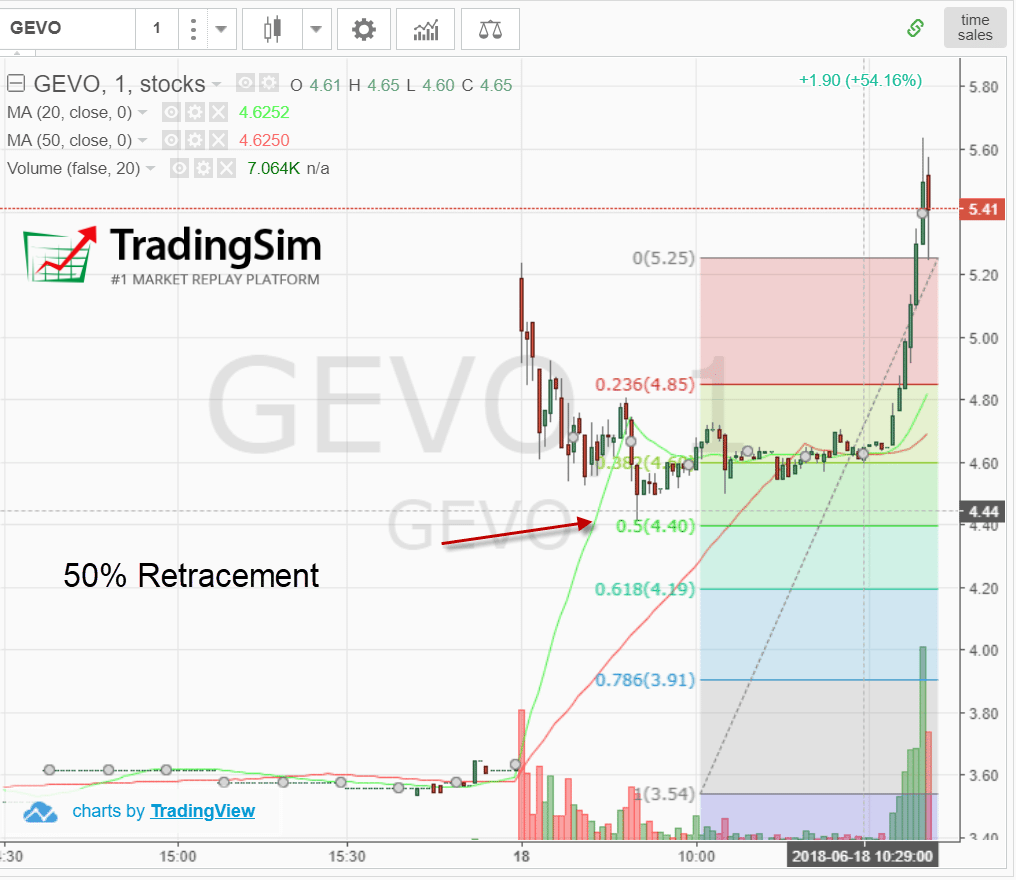
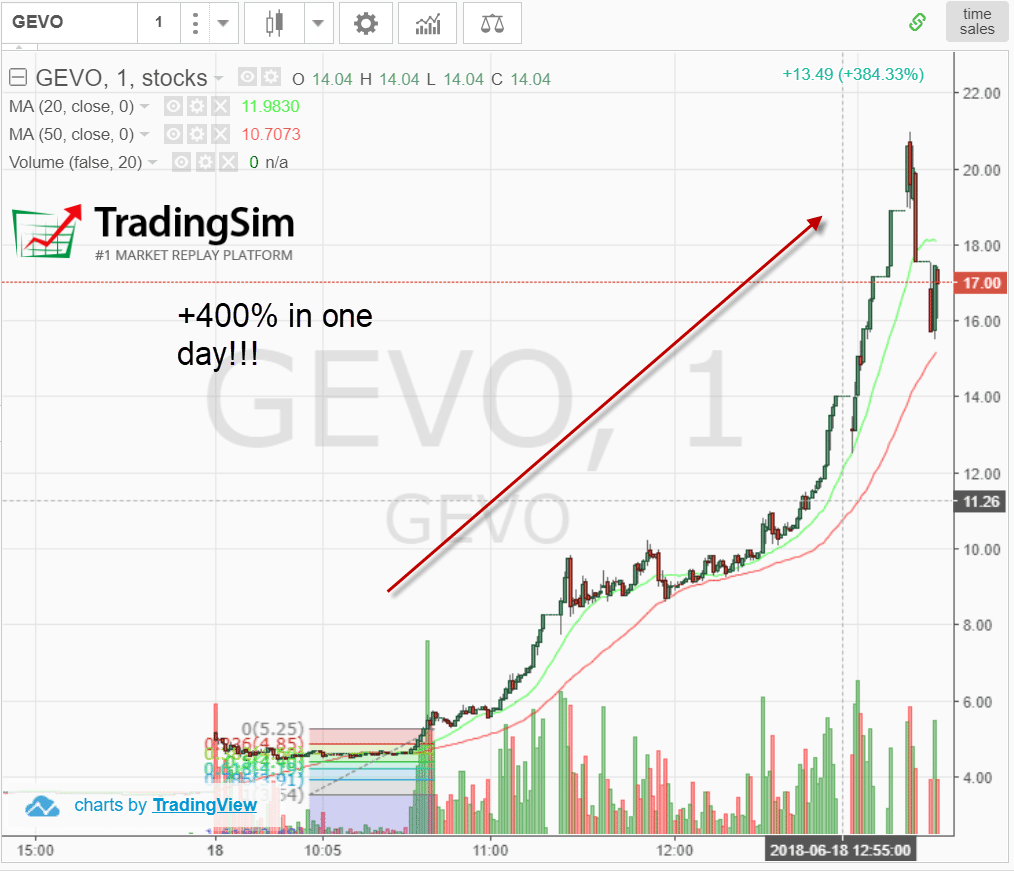
Midday Pullback Example
Fibonacci Lunch Time Trading
The above chart is of the stock GEVO. Notice how the stock gapped up in the morning and then formed a nice base at the 50% retracement level. Now at this point of the day, you want to see two things happen: (1) volume drop to almost anemic levels and (2) price stabilize at the Fibonacci level.
The combination of these two things almost guarantees volatility also will hit lower levels. You want to see the volatility drop, so in the event you are wrong, the stock will not go against you too much.
Managing the Trade
So, naturally, the question is how do you manage the trade.
First, you want to see the stock base for at least one hour. Then you want to see higher lows in the tight range. In the GEVO example, you want to place your buy order above the range with a stop underneath.
Curious to see what happened?
400 Percent in One Day
Of course, this doesn’t happen all the time. So, please do not say we are pushing lunch breakouts that can run 400%.
This is just a real-life example that shows the power of Fibonacci levels providing support during the middle of the day.
Now, remember, you have to exercise extreme caution with the middle of the day trading.
Not so much from the perspective of the market going against you, as you can see you have tight stops.
It’s more around the fact these setups fail a lot.
So, again, keep tight stops and always have realistic expectations.
Conclusion
The Fibonacci sequence starts from 0; 1, and every number thereafter is built by the sum of the previous two.
Every number in the Fibonacci sequence is 61.8% of the next number.
Numbers in the Fibonacci sequence are 38.2% of the number after the next in the sequence.
Every number in the Fibonacci sequence is 23.6% of the number after the next two numbers in the sequence.
The deeper the retracement on a pullback, the less likely the stock will break out to new highs
Fibonacci levels are critical in equity trading because they represent a trader’s behavior and psychological reaction to price changes.
The most common Fibonacci trading instrument is the Fibonacci retracement, which is a crucial part of the equity’s technical analysis.
Other Fibonacci trading tools are the Fibonacci speed resistance arcs and Fibonacci time zones
Whether you trade pullbacks, breakouts or indicators; you must have a trading plan to manage your position.
Like anything else in life, to get good at something you need to practice. So, if you have a second check out Tradingsim.com.
Here you can practice all of the Fibonacci trading techniques detailed in this article on over 11,000 stocks and top 20 futures contracts for the last 2.5 years. Our customers are able to test out strategies by placing trades in our market replay tool and not just relying on some computer-generated profitability report to tell them what would have happened.
As we all know, looking at the results of a report and placing trades are two totally different things!
What is Fibonacci trading? Fibonacci trading uses a set of ratios derived from the Fibonacci number sequence — 0.236, 0.382, 0.5, 0.618, 0.786 — to project where a pullback or extension may terminate inside a larger trend. The most-watched retracement levels are 38.2%, 50%, and 61.8%. The two most-watched extension targets are 127.2% and 161.8%.
How to draw the levels:
Uptrend retracement: click the swing low, drag to the swing high. Expected support at 38.2%, 50%, and 61.8% of the move.
Downtrend retracement: click the swing high, drag to the swing low. Expected resistance at 38.2%, 50%, and 61.8%.
Extension: project a measured move beyond 100% — 127.2% and 161.8% are the two most traded targets.
Which level matters most? The 61.8% retracement — the "golden ratio" — is where institutional traders cluster resting orders. In practice, 38.2% often holds in strong trends (shallow pullback) and 50% is the psychological midpoint. If 61.8% fails, the trend structure is usually broken.
Fibonacci cheat sheet
Retracement levels: 23.6%, 38.2%, 50%, 61.8%, 78.6%. Extension levels: 127.2%, 161.8%, 261.8%. Time zones: rarely used by day traders — typically ignored. Best timeframes: 5-min for intraday, daily for swing. Best confluence: prior support/resistance, moving averages, and round numbers.
Practice Fibonacci Setups in the TradingSim Simulator
The difference between a paper trader and a profitable trader is repetition. Open the TradingSim day trading simulator, pull up a month of historical tape, and draw fresh Fibonacci retracement levels on every clean swing. Mark which levels held on the first touch, which ones failed, and which ones produced clean reversals. Do this for 50 swings on a single ticker and you will know exactly which retracement levels are respected by your watchlist — with real precision, not guesswork.
The three most-watched retracement levels are 38.2%, 50%, and 61.8%. Some traders also plot 23.6% and 78.6%. The 50% line is not technically a Fibonacci ratio but is included because it is the psychological midpoint of the move.
Why is 61.8% called the golden ratio?
61.8% is the inverse of the mathematical golden ratio (1.618). It appears throughout nature and has become the most closely watched Fibonacci retracement because institutional order flow often clusters there.
Does Fibonacci trading actually work?
Fibonacci levels work because enough traders watch and trade them — it is partly a self-fulfilling prophecy. The levels are most reliable when they line up with prior support or resistance, a moving average, or a round number. On their own they are not magic.
What is the best timeframe for Fibonacci trading?
Day traders typically use 5-minute and 15-minute charts for Fibonacci retracements. Swing traders look at daily and weekly. The key is to use swings large enough to produce meaningful retracement zones — avoid drawing Fibs between tiny bars.
What is a Fibonacci extension?
Fibonacci extensions project price targets beyond 100% of the prior move. The two most common extension levels are 127.2% and 161.8%. Traders use them to plan profit targets after a breakout.
Alton Hill is the Co-Founder of TradingSim with over 18 years of trading experience. He completed the Design Thinking Bootcamp at Stanford’s D.School and brings expertise in Product Development to create the best trading simulation experience. His strategy focuses on trend-following systems, targeting high-volatility stocks with strong primary trends using the 15-minute chart.
Relative Volatility Index (RVI) – 2 Simple Trading Strategies
Have you ever heard of the RVI technical indicator? I am not talking about the relative vigor index, termed RVI or RVGI. I am referencing the relative volatility index! In this article, I am going to...
Best 3 Flag and Pennant Trading Strategies [Updated April 2026]
Flags and pennants are foundational chart patterns of technical analysis. What I mean by this is most technical traders have heard of the patterns, as these are easy to recognize. Most of the trading...
5 Steps for How to Successfully Counter Trend Trade
We have discussed many trend trading strategies on the TradingSim blog. In this article, we will examine the 5 steps to counter trend trade, which consists of impulsive and corrective price moves....


 Trend Indicators


