✓ Reviewed by Kunal Vakil, Co-Founder of TradingSim · Updated Mar 29, 2026
If you are wondering what the Volume Weighted Average Price (VWAP) is or how to use the VWAP indicator, then wait no more. We’ve created this ultimate guide to help you understand the ins and outs of VWAP, and how to trade with it.
The material is organized into 11 chapters, so be sure to take your time as you move through it. Toward the end, we will also explore the seven reasons day traders love using the VWAP indicator and why this trading indicator is a key component of many trading strategies. [1]
Learn How to Day Trade with the VWAP – Video
Before we dive into the reasons day traders love the volume-weighted average price (VWAP), we’ve put together a short video to help you understand this indicator.
This video is a great primer before for the advanced techniques and strategies that we will cover later.
Chapter 1: VWAP Overview
VWAP identifies the true average price of a stock by factoring the volume of transactions at a specific price point and not based on the closing price. For this reason it is a great tool for understanding the current and future trend of a security, and the weight of where most traders are priced in.
Finding the average price of a security based solely on the closing value often provides an inaccurate picture of a stock’s health. This doesn’t take into consideration multiple time-frames and fluctuations in price and volume.
Did the stock close at a high with low volume? Did the stock move to a new low on light volume?
These are all critical questions you would want to be answered as a day trader before pulling the trigger on a trade.
This is where VWAP comes into play.
VWAP can add more value than your standard 10, 50, or 200 moving average indicators because VWAP reacts to price movements based on the volume during a given period.
VWAP for Day or Swing Traders
While we are highlighting VWAP for day traders, what we will discuss in this article is also applicable for swing traders and those of you that love daily charts.
So, if you do not partake in the world of day trading, no worries, you will still find valuable nuggets of information in this post.
Now that your expectations are set, let’s first walk through a few key concepts when using the indicator.
Most importantly, we want to make sure we have an understanding of where to place entries, stops, and targets using VWAP.
Chapter 2: VWAP Setups
After studying the VWAP on thousands of charts, we have identified two basic setups: pullbacks and breakouts.
By far, the VWAP pullback is the most popular setup for day traders hoping to get the best price before a stock continues higher.
Remember, day traders have only minutes to a few hours for a trade to work out. To that end, the closest entry at a support level can mean the difference between success or failure in a trade.
On the other hand, the VWAP breakout setup is not what you may be thinking. Instead of looking for a breakout to new highs, what we look for is a break above the VWAP itself, ideally with strength.
Now, let’s dig into the entry points for these setups.
VWAP Pullback Entry
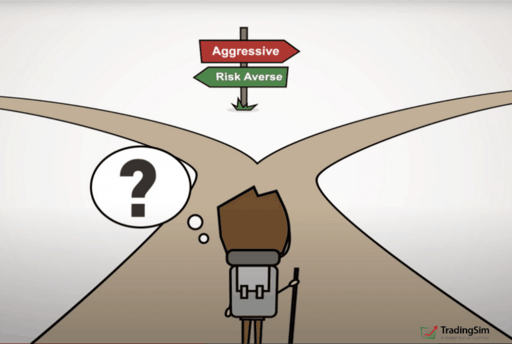
Entry Option 1 – Aggressive Traders
Aggressive VWAP Trade
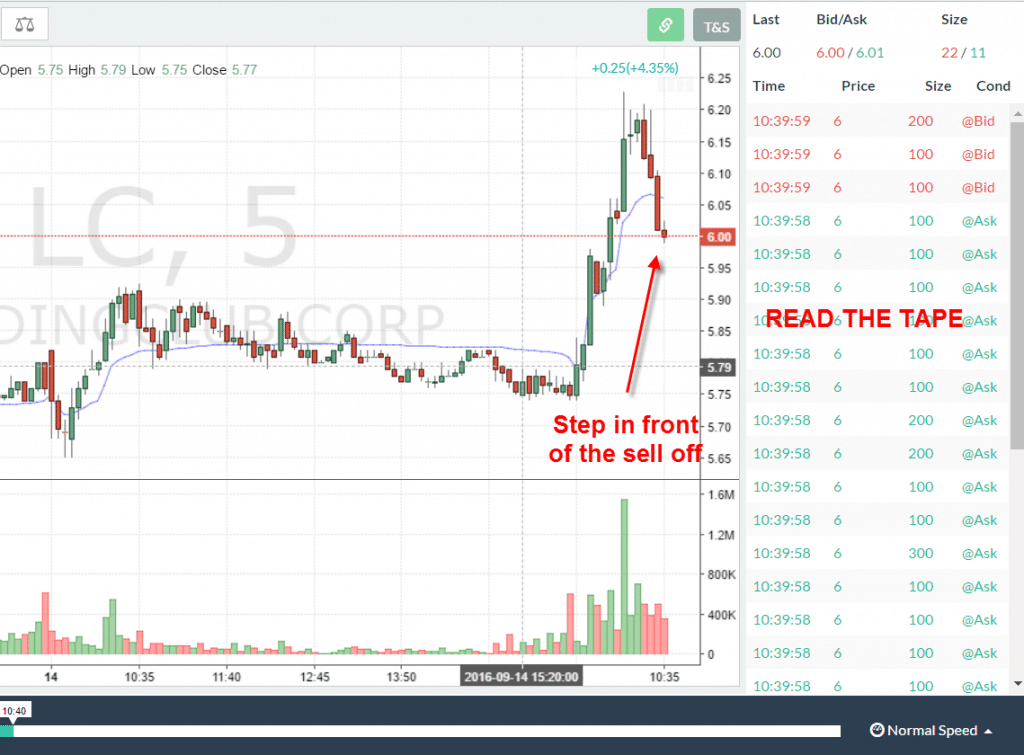
The first option is for the more aggressive traders and would consist of watching the price action as it is approaching the VWAP.
For this, you wait for a break of the VWAP and then look at the tape action on the time and sales.
You will need to identify when the selling pressure is spiking. Usually the time and sales (the tape) is going crazy when this happens. It looks like a flashing Christmas lights, orders are going in so quickly.
If tape reading is new to you, understand that it is more art than science and will require you to practice.
The goal is to identify when the selling pressure is likely to subside and then enter the trade.
Unorthodox Entry
This approach will break most entry rules found on the web of simply buying on the test of the VWAP. The problem with this approach is you don’t know if the price will breach VWAP by 1% or 4%, or greater.
After all, VWAP is a popular indicator. Too often the most obvious becomes too obvious and requires a shake out.
As an example of this, if the VWAP were at $10 and you place your limit order at $10, what can happen next? At times, it will slice right through the indicator swiftly.
This technique of using the tape is not easy to illustrate. We recommend practicing this approach using Tradingsim with Level II access.
Assess how close you can come to calling the turning point based on order flow, before you try the setup with real money.
VWAP Breakout Entry
Entry Option 2 – Risk-Averse Traders
Conservative VWAP Entry
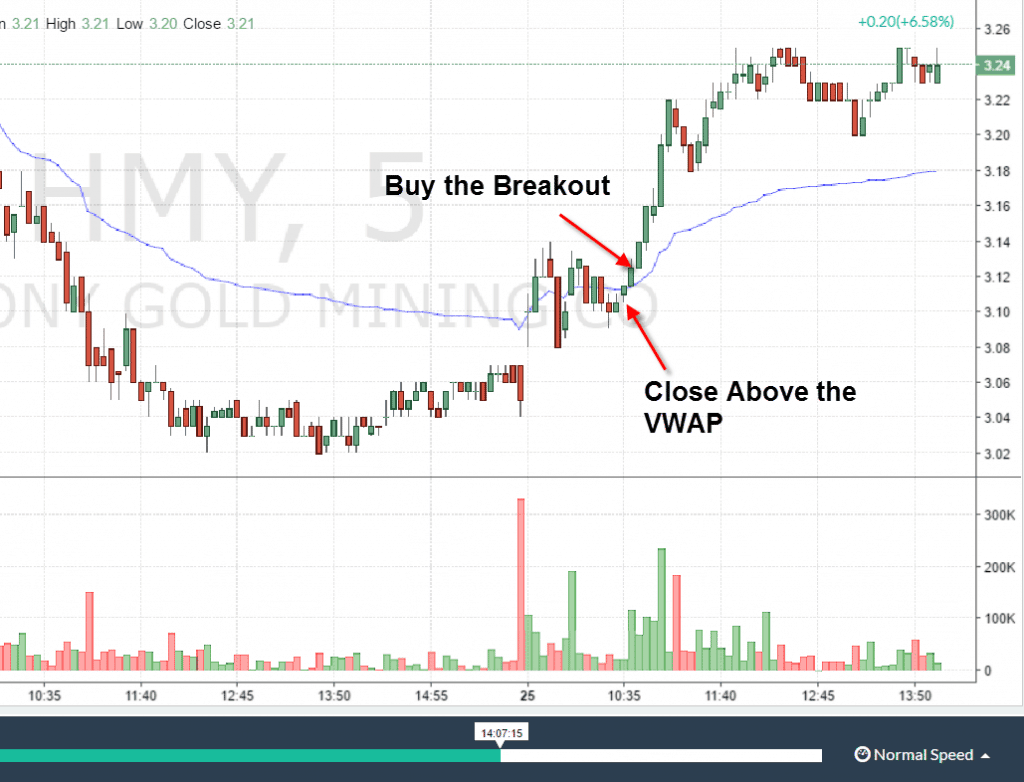
VWAP breakout entries are a great option for newer traders and those who are new to the VWAP indicator. It requires less proficiency with tape reading.
Essentially, you wait for the stock to test the VWAP to the downside. Next, you will want to look for the stock to close above the VWAP.
You will then place your buy order above the high of the candle that closed above the VWAP.
While this is a simpler approach for trade entry, it may open you up to more risk as you will likely be a few percentage points off the low. However, your success rate may eliminate the risk involved.
You will need to determine where you are in your trading journey and your appetite for risk to assess which entry option works best for you.
It goes without saying that while we have covered long trades, these trading rules can apply for short trades as well. Just do the inverse.
Nevertheless, let’s move to the next step. Now that you are in the trade, where should you place your stop?
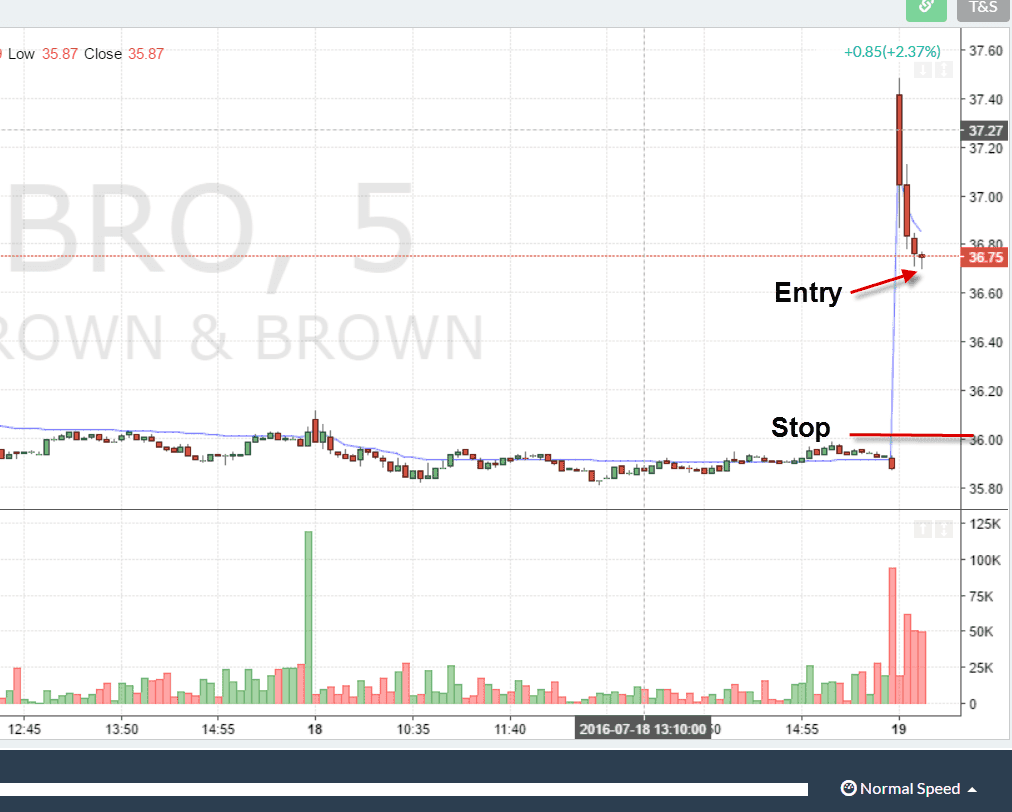
Aggressive Trade Stop
Aggressive Stop Price
If you take the aggressive approach for trade entry, you will want to place your stop at your daily max loss or a key level (i.e., morning gap).
Again, this can work, but be prepared for wild swings that can occur if you get things wrong.
Pullback Stop
Conservative Stop Order
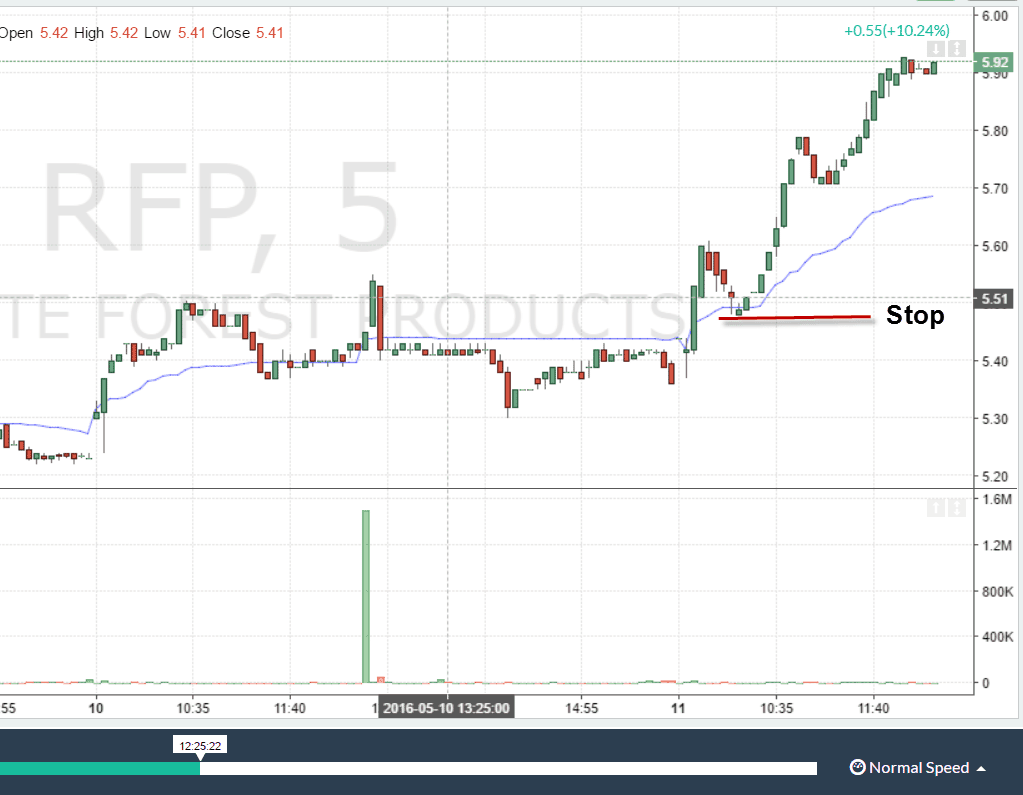
The pullback stop may be simpler to identify; it is the most recent low point.
If the stock begins to roll over and breaks the VWAP along with the most recent low – the odds are you have a problem.
At this point, you will want to close the trade and protect your capital. Your initial thesis was likely wrong.
Chapter 3: VWAP Target
Setting targets can be exciting. Everyone loves making money in trading, right? With a profitable target area, this is where the fun begins.
Realistically, you have a few ways to determine your profit potential on each trade.
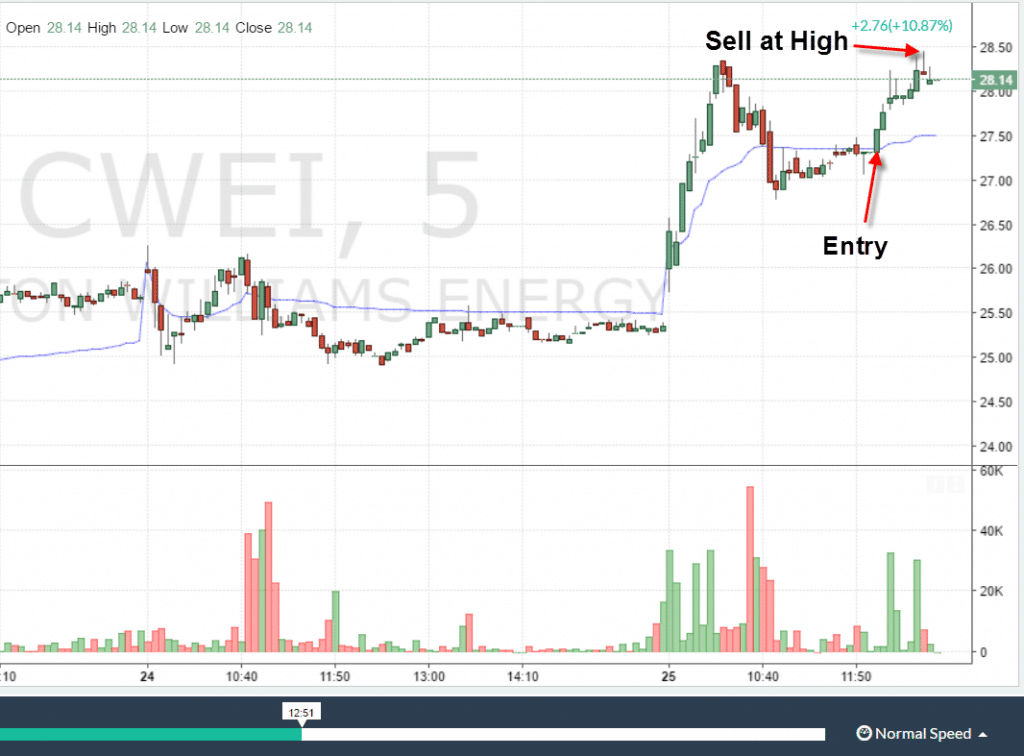
Selling at the Daily High
Sell at High of the Day
This is a popular approach for exiting a winning trade. After entering the trade, you look for the high of the day to close the position. You place your stop below the most recent low.
After years of trading, you may notice that after the morning breakouts that occur within the first 20-40 minutes of the market opening, the next round of breakouts often fails.
This is because seasoned traders are selling their long positions into strength. On the flip side, novice day traders are trying to buy these breakouts. This gives the seasoned traders the liquidity to unload their shares to the unsuspecting public.
As with any trade, it’s always a good idea to imagine who and where the strong hands are averaged in. Not to mention, who and where the bag-holders are averaged in.
VWAP helps with this.
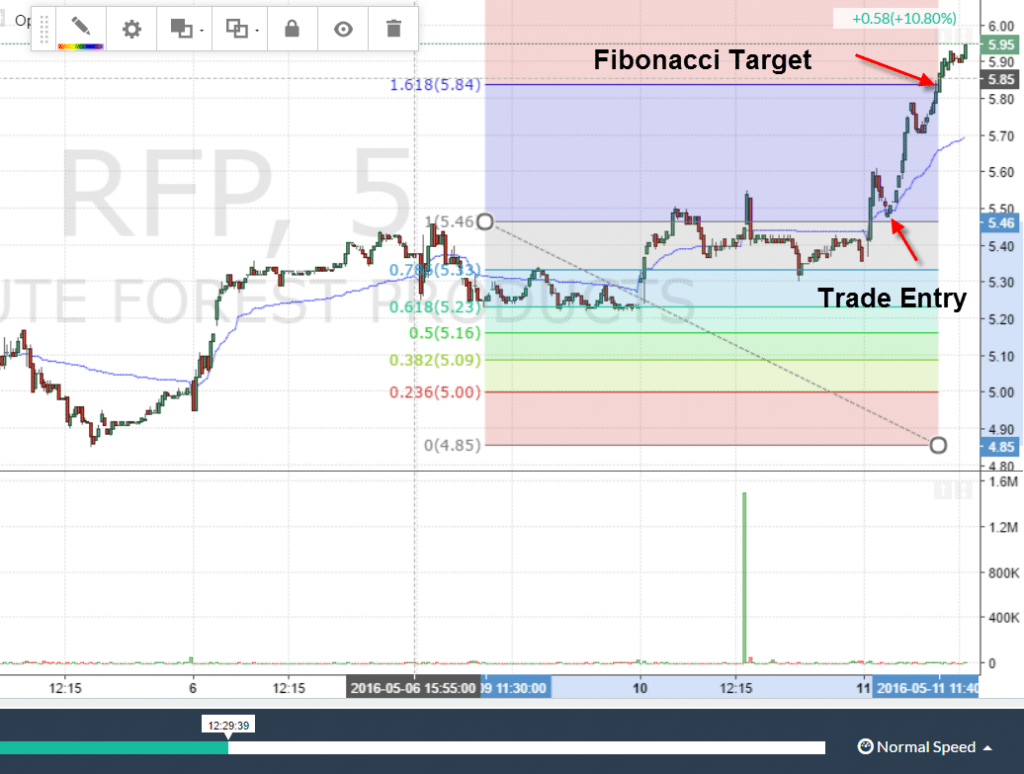
Selling at a Fibonacci Extension Level
Fibonacci Extension + VWAP
This is for the more bullish investors that are looking for larger gains.
Fibonacci levels are based on the hypothesis that the stock will break the high of the day and run higher.
If the target is it, it can bring huge gains, often in the 4% to 10% realm for day trades. This, of course, means the odds of hitting this larger target is less likely. To that end, you’ll need to the right mindset to handle the low winning percentage that comes with this approach.
Selling Into Climactic Price Action
There are times when the price action of the stock shows no sign of weakness. As buyers continue to buy, buy, buy, and short sellers continue to cover, the price pushes higher.
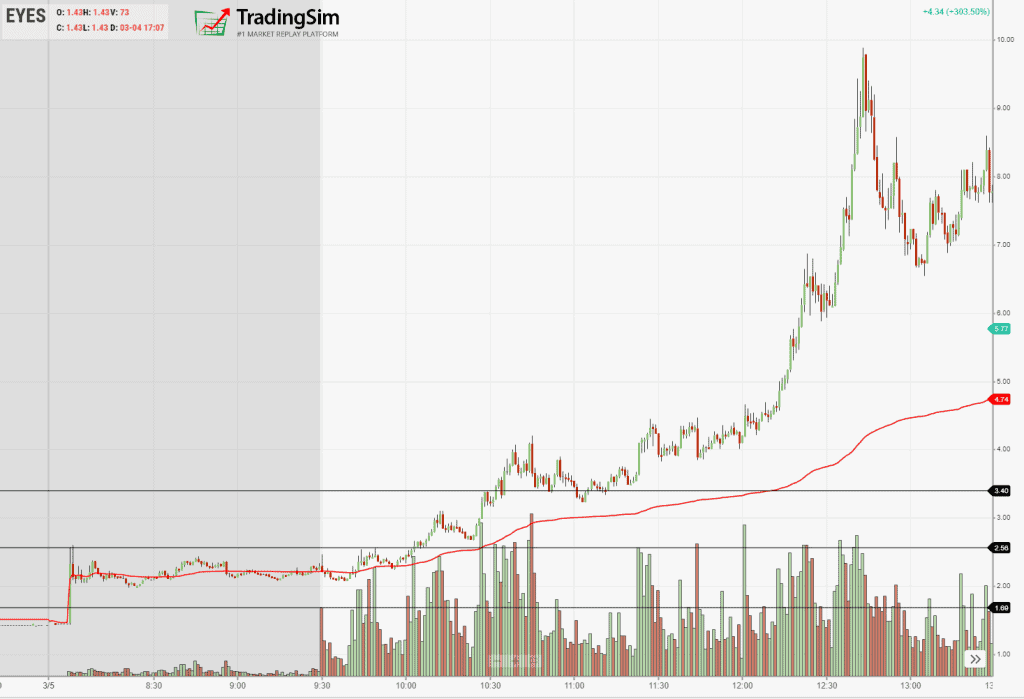
Eventually, what you might see is a parabolic chart. Here is an example below:
Parabolic Chart
As you see the stock running to climactic highs on climactic volume, it is time to sell. Maintaining that amount of price increase in such a short amount of time is not likely.
Take your profits and let the stock consolidate for another entry later down the road.
Whichever methodology you use for taking profits, just remember to keep it simple. The market is the one place where really smart people often struggle.
Chapter 4: Psychology of the VWAP Trade
If you have been trading for some time, you know that indicators alone are mostly smoke and mirrors. Ultimately, your success will come down to your frame of mind and a winning attitude. [2]
On that token, let’s take a break from the technical side, and get more into the fuzzy area of “mindset.”
Everything you need to make money is between your two ears
Think about the psychological benefit of VWAP pullback trades for just a moment.
A pullback trade just makes sense when you look at it on paper, right?
Why?
If it’s a morning gap, you are not buying at the highs. You are actually lowering the distance from your entry to the gap below.
Why is this important? You are reducing your risk on the trade as opposed to just buying the breakout blindly.
This will allow you time to analyze the price action before you add to the trade. As you monitor your trade entry, you can “size up” as the stock find its footing near VWAP.
Things are all well and good if the stock acts well. But, let’s discuss what you will likely be thinking if a VWAP pullback does not go in your favor.
When Things Don’t Go Well
With such a good average price, you can make the decision to kill the trade if need be. Assuming the volume and price action dictates more serious trouble on the horizon.
The important thing you will be faced with is when to exit the position. If the stock shoots straight up, it will be tough to find a pivot point to risk against. That is, without opening yourself up to a significant stop loss.
However, if the stock does have a close pivot point, you may be in luck. Nonetheless, you’ll need to watch for the price to close below the VWAP, or reverse and hold its ground.
What should you do in that situation?
These are the type of answers you need to have completely fleshed out in your trading plan before you even think of entering the trade.
It is the perfect reason to practice in a simulator as well. This way, you’ll know a multitude of scenarios before you make a decision.
VWAP, nor any other indicator will address the internal questions/conflicts you will be facing.
These are things that you need to manage if you want to have any success in the markets. And that success will come through exposure and experience.
When things go just right
The opposite side to this scenario is when you get it just right.
The stock pulls back to VWAP and you nail the entry. The stock runs back to the previous high and then breaks that high.
Talk about a feeling of mastery; it’s all profits and excitement.
In this instance, the trade goes in your favor. Depending on the volatility of the stock; you will find yourself up 2% to 3% without even blinking.
The money will literally fall into your account.
Why have we laid out these two psychological scenarios?
So that you get a feel for what it means to be in a losing and winning VWAP trade.
Simply knowing when you are in a winner or a loser and how quickly it takes you to come to that conclusion can be the deciding factor between an up-sloping equity curve and one that runs into the ground.
Chapter 5: Real-Life Trading Examples
Now that you have a handle on the basics and psychology behind the setup, let’s dig into a number of real-life trading examples.
Example 1 – VWAP Pullback Trade
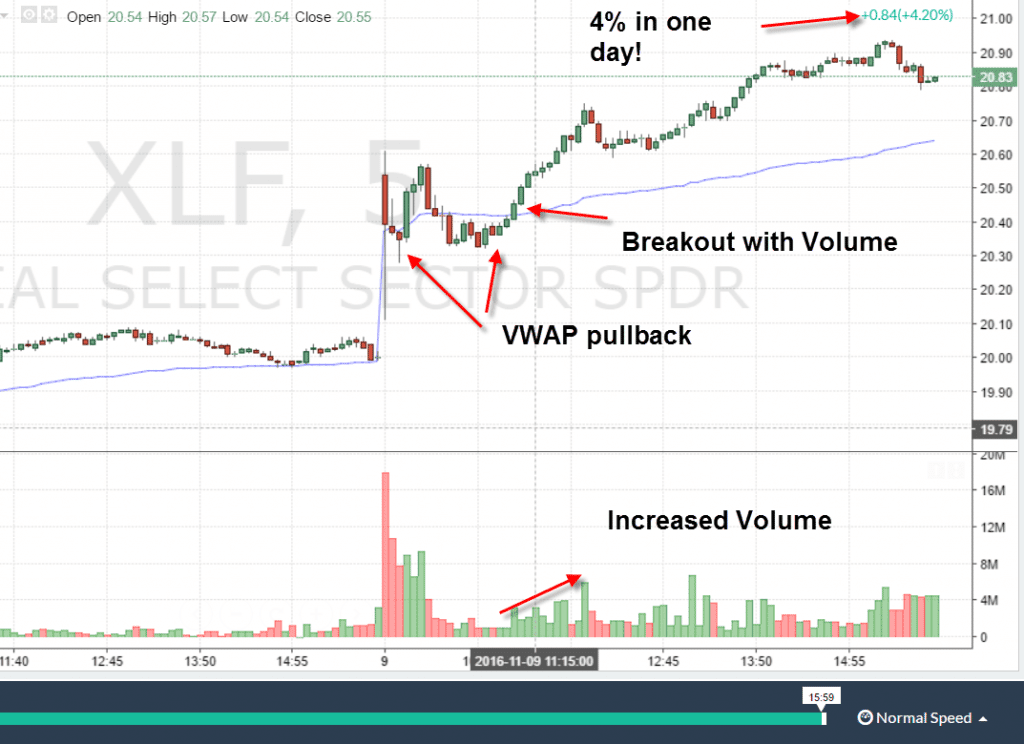
In this trade example, we will review a historical example of the Financial Sector ETF (XLF).
If you were long the banking sector when you woke up on November 9th, 2017, you would have been pretty happy with the price action.
That morning XLF had a bullish gap. However, right off the open there was a very dramatic pullback.
VWAP Pullback Trade
Notice the huge red candle on the open as it gave back the gains from the premarket. The chart doesn’t show the premarket, but you see the $0.60 gap.
As a trader, could you anticipate whether or not XLF was going to crash back through the VWAP on the second crossing?
Remember, trading is about probabilities. Often we don’t know what will happen after the open.
As you can see, XLF experiences a slight rally, only to rollover again and retest the VWAP. Should you have bought XLF on this second test?
Porosity – Flexibility
Notice how the XLF doesn’t hold the VWAP and actually trades below the indicator.
This is an important example to highlight that stocks don’t always honor VWAP as if it is some impenetrable wall.
If you read other posts on the web about VWAP, it may give you the impression that if a stock closes below VWAP you need to run for the hills.
This is the furthest thing from the truth.
There are automated systems that push prices below these obvious levels (i.e. VWAP) to trip retail trader’s stops. They do this in order to pick up shares below market value.
Not to mention, many traders do not have the indicator on their chart.
Therefore, what is so apparent to you may not even be on another trader’s radar.
Back to the trade.
VWAP Pullback Trade
The last thing that made this trade difficult is the volume action on the VWAP breakout. Compared to most breakouts, it wasn’t screaming “buy me.”
However, if you look a little deeper into the technicals, you can see XLF made a higher low. The volume, albeit lighter than the open, is still trending higher. This is noted on the chart.
Once XLF was able to get back above VWAP with steadily increasing volume, it never looked back.
Remember as a trader, we are not here to guess how the news will affect prices. Our job is to trade the price action in front of us.
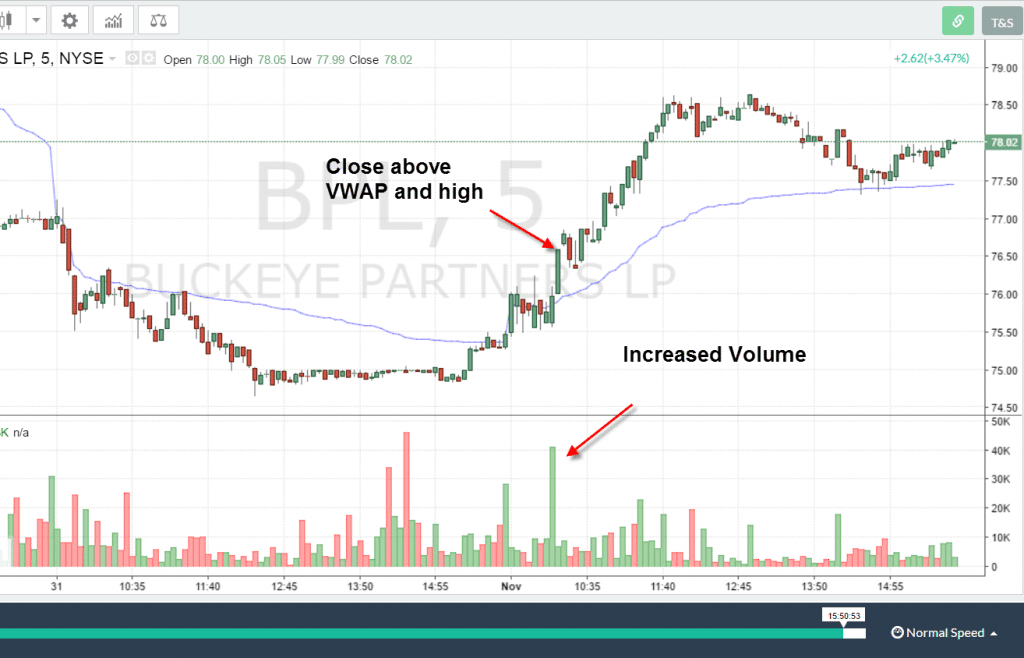
Example 2 – VWAP Breakout Trade
We’ll now move on to VWAP breakout trades and the volume associated with these moves.
Volume is a lot like a lens you can apply to the market. It helps make sense of all the chaos.
VWAP Trade
Notice this trade of Buckeye Partners, LLP. Clearly you can see the stock stayed below the VWAP indicator for some period of time.
BPL was eventually able to climb above the indicator, and stalled.
At this point, you could jump into the trade. After all, the stock has been able to reclaim VWAP. Just be aware that price movement can trend sideways for a considerable amount of time.
Remember, it’s not just about placing trades; the goal is to place trades that will make the best use of your time and money.
The Impact of Volume
The key thing you want to see is a price increase with significant volume.
Will you get the lowest price for a long entry — probably not.
However, if you wait, you will receive confirmation that the stock is likely to run in your desired direction. The volume is your tell-all that demand is behind the move.
In this specific trading example, wait for the price to move above the high volume bar bouncing off VWAP. This is a sign to you that the odds are in your favor for a sustainable move higher.
Chapter 6: VWAP and Confluence
So, you could be asking yourself. “What do peanut butter and jelly have to do with trading?”
Everything.
In trading, one signal is okay. But if multiple indicators from varying methodologies are saying the same thing, then you have something special.
Confluence is essentially an opportunity where another technical support factor is at the same price as VWAP.
For example, a Fibonacci level or a major trend line coming into play at the same time.
Confluence
This confluence can give you more confidence to pull the trigger. The more entry signals confirming, the better.
This brings us to another key point regarding the VWAP indicator.
There are many great traders that use the VWAP exclusively. However, these traders have been using the VWAP indicator for an extended period of time.
When starting out with the VWAP, you will not want to use the indicator blindly.
While we’re not suggesting you throw 10 indicators on your chart for confirmation, you will need to use some other validation tool to ensure you are seeing the market clearly.
Trading on price action alone takes many years of experience.
Chapter 7: Finding VWAP Trades
Timing is everything in the market, and VWAP trades are no different.
While stocks are always trading above, below, or at the VWAP, you really want to enter trades when stocks are making a pivotal decision off the level.
To do this, you need to have the ability to scan for these setups in real-time.
Likewise, you’ll want to have more than one criterion for filtering your scans. This helps dwindle down the huge universe of stocks to a much more manageable list of 10 or less.
However, if you purely trade with VWAP, you’ll need a way to quickly see what stocks are in play.
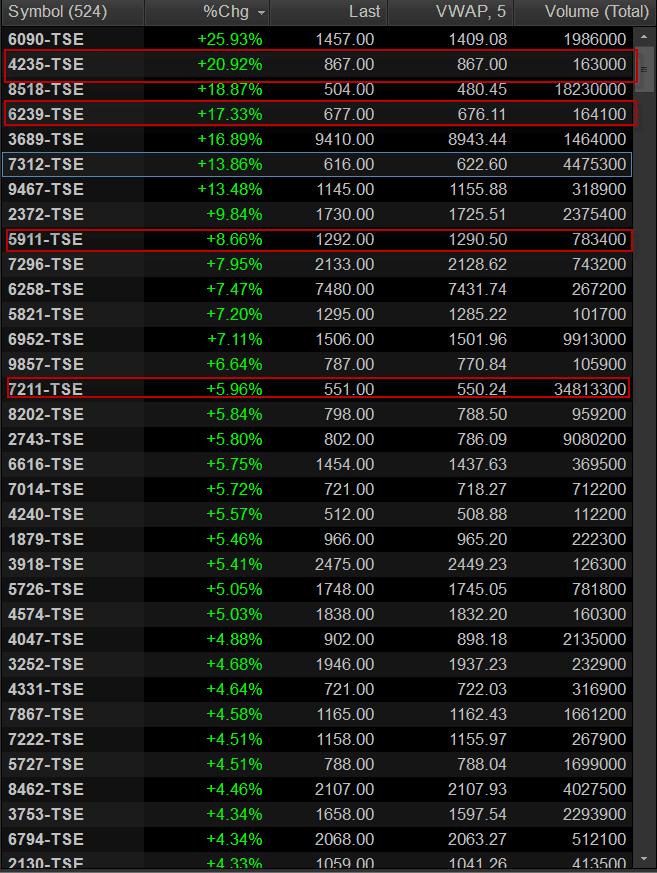
To do this, you will need a real-time scanner that can display the VWAP value next to the last price. You then cross-reference the VWAP value with the current price to identify volatile stocks that are close to the indicator.
VWAP Scanner
While not all examples are highlighted, we have circled a few examples for you. Notice the “Last” and the “VWAP” columns and how closely the values align. This is what you’re looking for.
Another option if you have the ability to develop a custom scan is to take the difference of the VWAP and the current price and display an alert when that value is close to zero.
Essentially, this is the numerical representation that the price and VWAP are overlapping.
Chapter 8: 7 Reasons Day Traders Love the VWAP
Hopefully the information thus far has increased your level of understanding when it comes to the VWAP indicator.
Now, we can shift into what first caught your attention – the 7 reasons day traders love the VWAP!
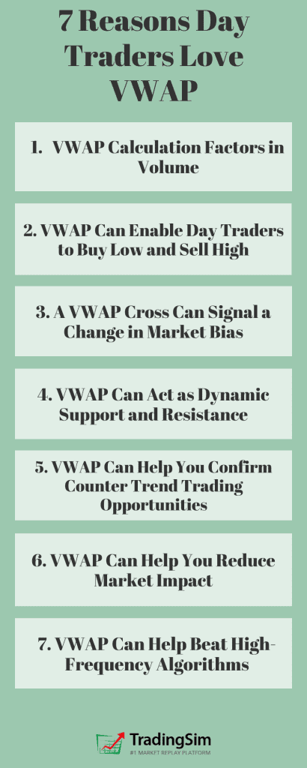
7 Reasons Day Traders Love the VWAP
Reason # 1: VWAP Calculation Factors in Volume
For the record, the VWAP formula is:
∑ Number of Shares Purchased x Price of the Shares ÷ Total Shares Bought During the Period
By multiplying the number of shares by price, then dividing it by the total number of shares, you can easily find out the volume weighted average price of the stock.
Since the VWAP takes volume into consideration, you can rely on this more than the simple arithmetic mean of the transaction prices in a period.
To learn more about the VWAP formula, check out this article from Wikipedia. [4]
Theoretically, a single person can purchase 200,000 shares in one transaction at a single price point, but during that same time period, another 200 people can make 200 different transactions at different prices that do not add up to 100,000 shares.
In that situation, if you calculate the average price, it could mislead as it would disregard volume.
Reason 2 #: VWAP Can Enable Day Traders to Buy Low and Sell High
If your technical VWAP trading strategy generates a buy signal, you probably execute the order and leave the outcome to chance.
However, professional day traders do not place an order as soon as their system generates a trade signal. Instead, they wait patiently for a more favorable price before pulling the trigger.
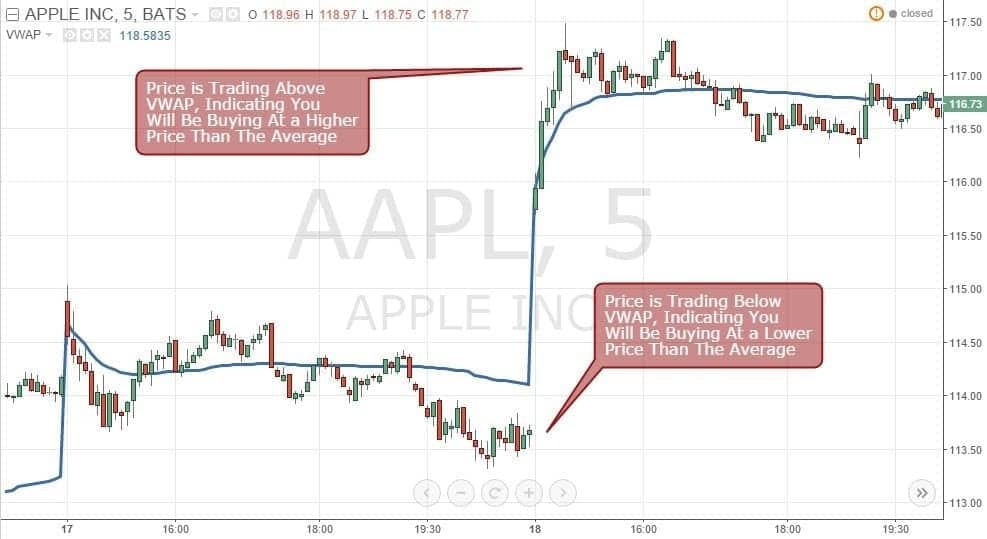
Price of AAPL Compared to Its 5-Minute VWAP
If you find the stock price is trading below the VWAP indicator and you buy the stock at market price, you are not paying more than the average price of the stock for that given period.
With VWAP trading, know you’re always getting a lower price than average.
By knowing the volume weighted average price of the shares, you can easily make an informed decision about whether you are paying more or less for the stock compared to other day traders.
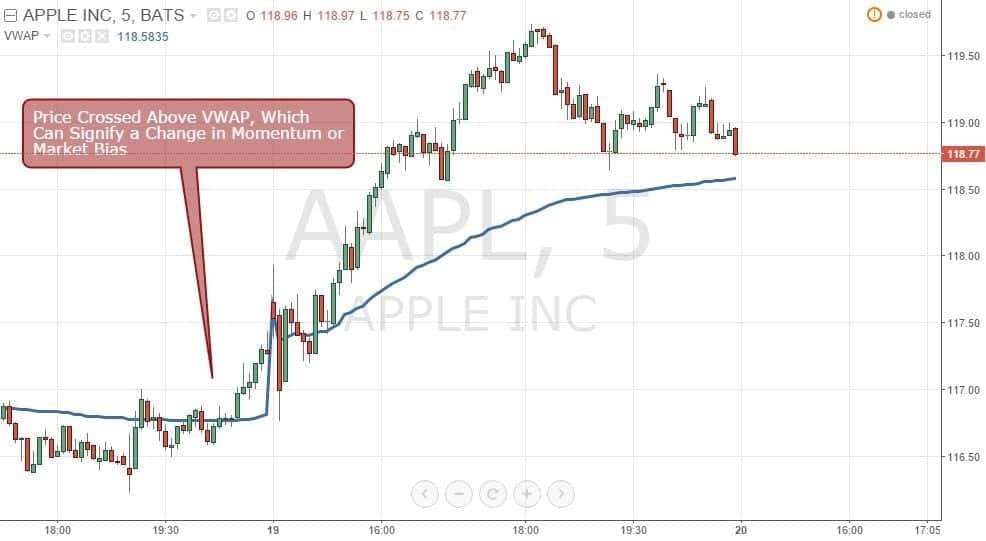
Reason # 3: A VWAP Cross Can Signal a Change in Market Bias
Buying low and selling high can be a great strategy. However, as a momentum trader, you’re looking to buy when the price goes up and sell when the price goes down.
AAPL Crossing Above VWAP
A VWAP trading strategy called the VWAP cross can help you locate and trade momentum in the market.
Since the VWAP indicator resembles an equilibrium price in the market, when the price crosses above the VWAP line, you can interpret this as a signal that the momentum is going up and traders are willing to pay more money to acquire shares.
Conversely, when the price crosses below the line, consider this a signal that the momentum is bearish and act accordingly.
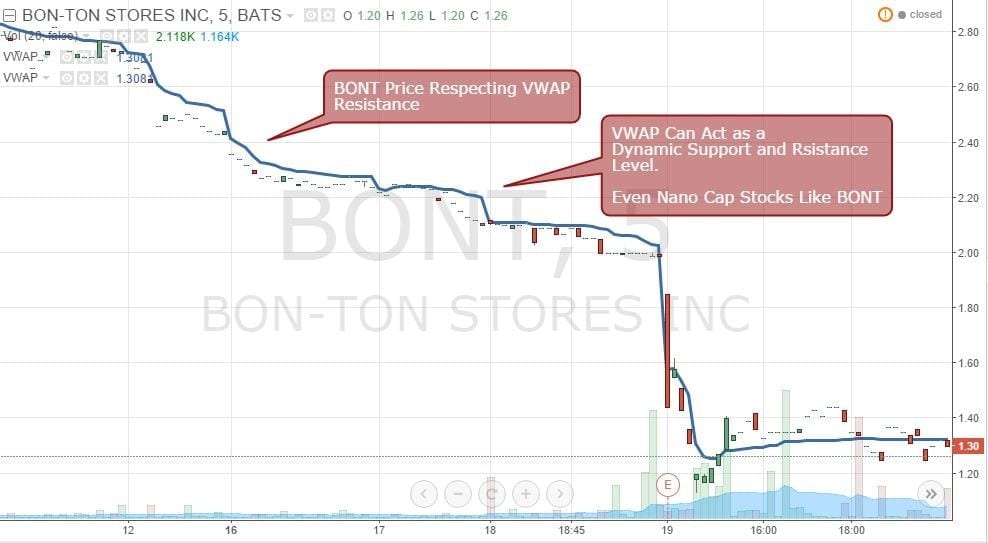
Reason # 4: VWAP Can Act as Dynamic Support and Resistance
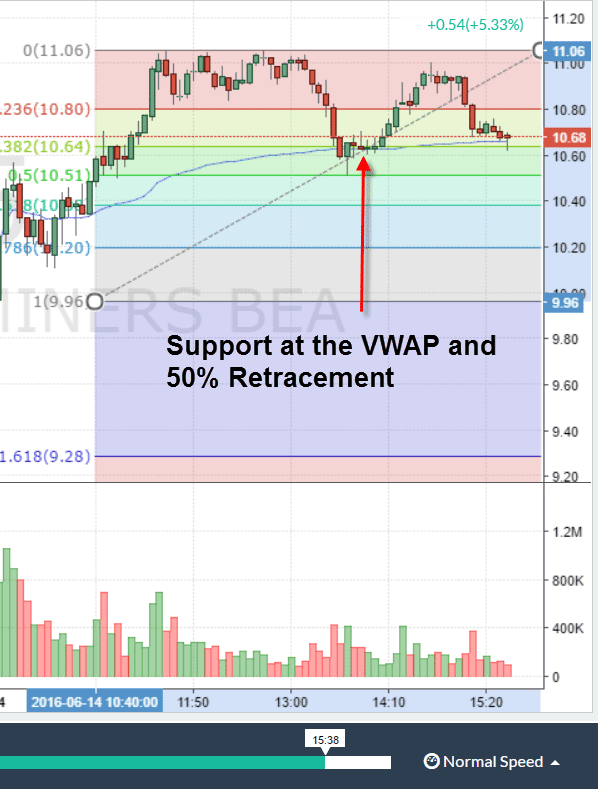
BONT Price Respecting VWAP Resistance
Day traders love the VWAP indicator because more often than not, the price finds support and resistance around this level.
Some might argue that this can be a self-fulfilling prophecy. Other traders and algorithms are buying and selling around the VWAP line, after all.
Nonetheless, if you combine the VWAP with simple price action, a VWAP trading strategy can help you find dynamic support and resistance levels in the market.
The likelihood of a VWAP line becoming a dynamic support and resistance zone becomes higher when the market is trending.
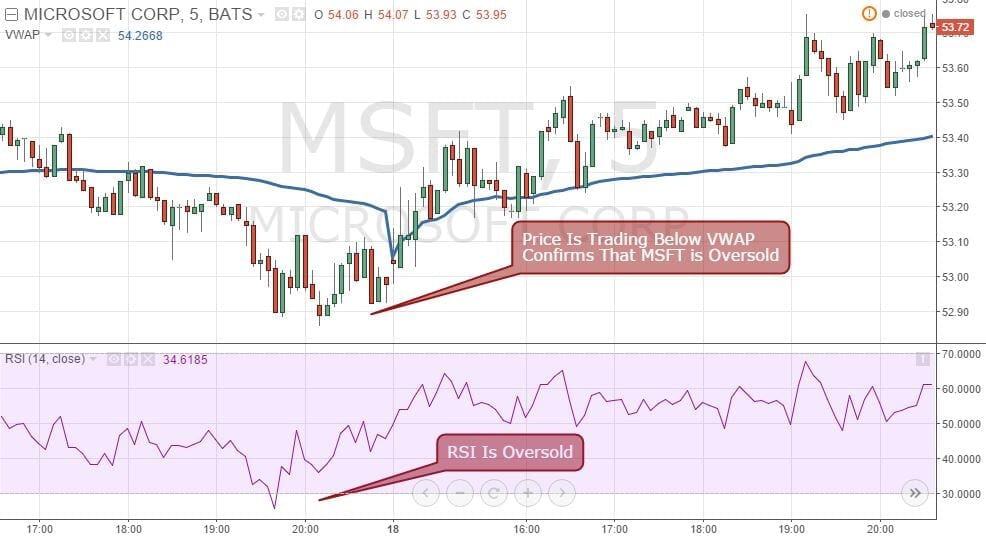
Reason # 5: VWAP Can Help You Confirm Counter Trend Trading Opportunities
VWAP Confirms the Oversold Signal Generated By the RSI Indicator
Ever wonder if a stock is overbought or oversold and if it’s time to take a counter trend trade?
Just looking at the RSI or Stochastics and guessing can often throw false signals. You need concrete evidence of whether there is a strong trend or a chance the market will turn back. Adding the VWAP indicator on your chart can make your life much easier, in this regard.
To that end, professional day traders have a rule of thumb when using the VWAP.
If the line is flatlining, but the price has gone up or down impulsively, the price will likely return to VWAP.
However, if the line is starting to gradually move up or down in a new trend, it is probably not a good idea or good time to take a counter-trend position.
Reason # 6: VWAP Can Help You Reduce Market Impact
Most day traders do not affect the market much because we often trade our personal funds at the retail level.
However, hedge funds and pension funds are much bigger. Their decision to buy a stock can drive up the price considerably.
Just imagine for a second you are day trading and want to buy 5,000 shares of Apple (AAPL).
AAPL is a fairly popular stock and traders rarely face any liquidity problems when trading it. Hence, you will quickly find a seller willing to sell his 5,000 AAPL shares at your bid price.
However, if you want to buy 1 million AAPL shares it will take more time. Your broker will likely have to fill a good portion of your order at a price higher than the current market price.
If that’s you, congratulations, you have just bid the price up and impacted the market!
Placing a large market order can be counterproductive. You will end up paying a higher price than you originally intended.
Institutional Buying
For that reason, when funds want to buy large quantities of a stock, they typically spread their orders throughout the day and use limit orders.
If they find the stock price is trading below VWAP, they are able to pay a lower price compared to the average price, right? This way, VWAP acts as a guide and helps them reduce market impact while dividing up large orders.
You may think this example only applies to big traders. However, in the world of low float stocks, even small orders can make an impact on price movement.
Be sure you know what you’re trading.
Reason # 7: VWAP Can Help Beat High-Frequency Algorithms
They are watching you.
When we say they, we mean the high-frequency trading algorithms.
Have you ever wondered why the liquidity levels in the stock market have gone up over the last few years?
The high-frequency algorithms can act as little angels when liquidity is low. But these angels can turn into devils as they attempt to bid up the price of a stock by placing fake orders only to cancel them right away.
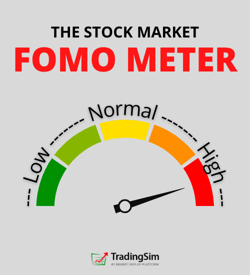
If you are emotionally following the tape, you may start executing market orders because you are worried the price will run away from you.
We call this Fear of Missing Out (FOMO). Don’t fall prey to it.
This is where the VWAP can come into play. Instead of focusing on the level 2, you can place limit orders at the VWAP level to slowly accumulate your shares without chasing these phantom orders.
Chapter 9: Bonus Content: Low Volatility Stocks and VWAP
Here at TradingSim, we like to scan for highly volatile stocks and then apply the VWAP to the chart.
This approach put us in the best position to turn a big profit. But one thing we noticed is that highly volatile stocks have less respect for indicators – including VWAP.
Let’s look at a few of these highly volatile stocks and their action around VWAP lines.
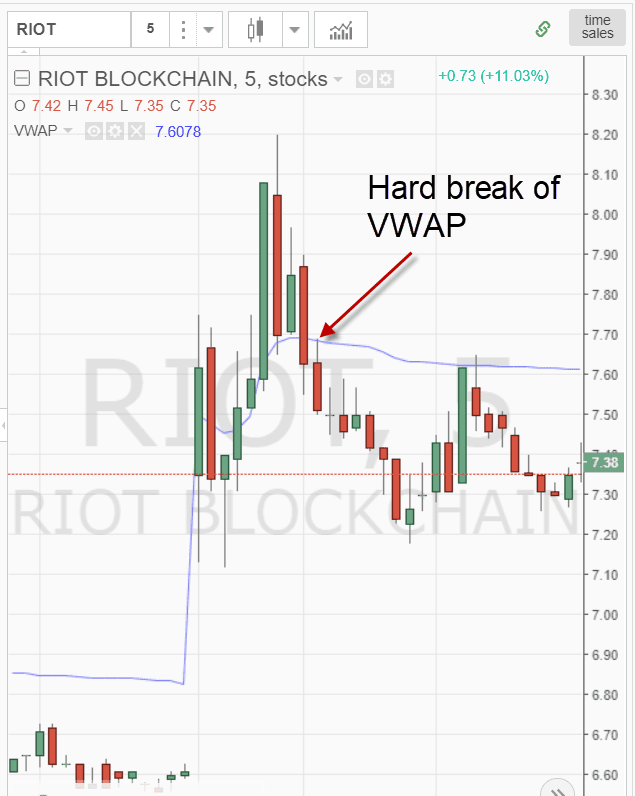
Example #1: RIOT Blockchain
Hard Break of VWAP
At first glance, you are likely thinking what’s the big deal with RIOT here?RIOT blockchain did exactly what we would expect stocks to do when interacting with the VWAP.
Or did it?
In the morning the stock broke out to new highs and then pulled back to the VWAP. This pullback to VWAP would have been a good opportunity to get long on the stock for a rebound trade.
However, this lack of a bounce produced a violent selloff from $7.70 to $7.20. This represented a sell-off of almost 7% in 40 minutes.
Do you think you would have what it takes to sit through a 7% beat down?
Only you can answer that question.
Violent price swings, even when allocating small amounts of cash, can be very difficult to sit through.
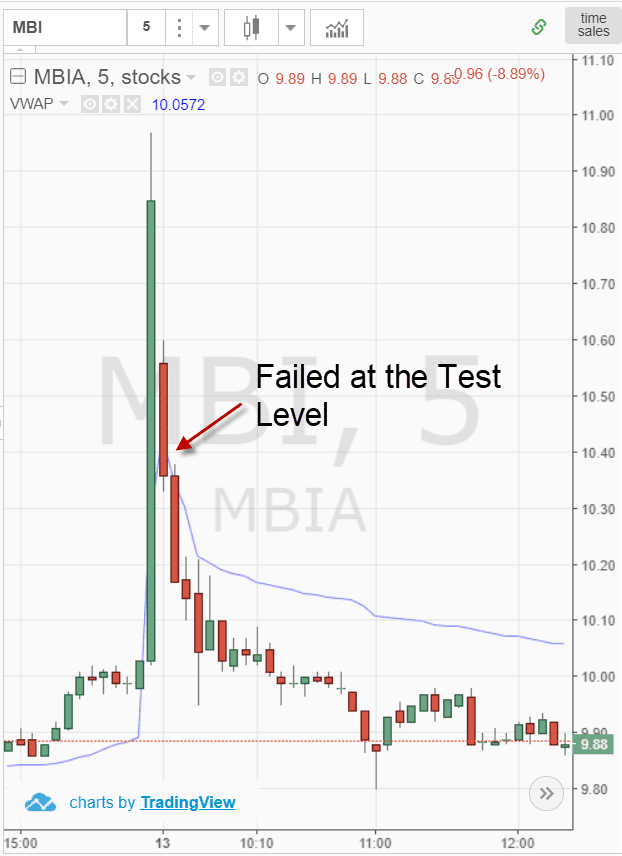
Example #2: MBI
Failed at Test Level
In the next example, MBI had an explosive move up through the VWAP indicator. The stock then came right back down to earth in a matter of 4 candlesticks.
4 candlesticks were literally a 10% down move in 20 minutes. You can see MBI did not recover to the VWAP level even as time pushed beyond 12 noon.
Goldman Sachs mentioned in an article that with higher volatility in the S&P 500, traders have “drawn back from using VWAP algorithms.” [5]
This is not to say the indicator doesn’t work, it’s just that the level of volatility can decrease the accuracy of the indicator.
They are plenty of day traders who trade volatility. You’ll just have to ask yourself it this fits your personality.
Chapter 10: VWAP and Futures Contracts
Building upon the concept of securities with more predictable volatility, let’s turn our focus to how VWAP performs with the S&P E-mini futures contract.
For those of you that trade the S&P E-mini, you know all too well the contract moves in a familiar pattern.
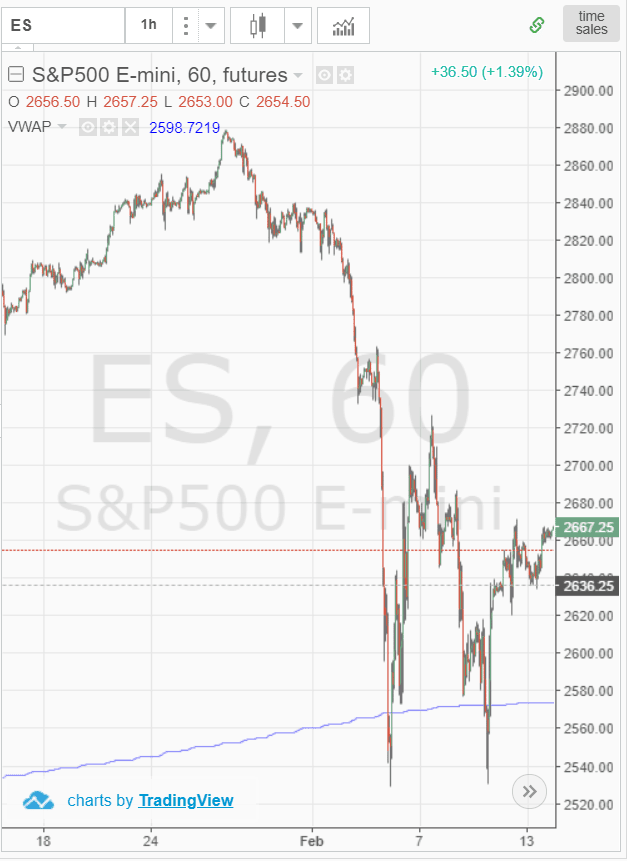
S&P VWAP Retest
The dramatic Covid-19 sell-off in February of 2020 felt extreme after the low volatility the S&P had experienced over the prior 5 months.
Yet, after the selloff began, for VWAP traders it was clear the 2,570 level would provide significant volume and price support for the S&P 500 E-mini contract. This is the blue line on the chart above.
As you can see, VWAP does not perform magic. However, it clearly did a good job of identifying where the bulls were likely to regain control.
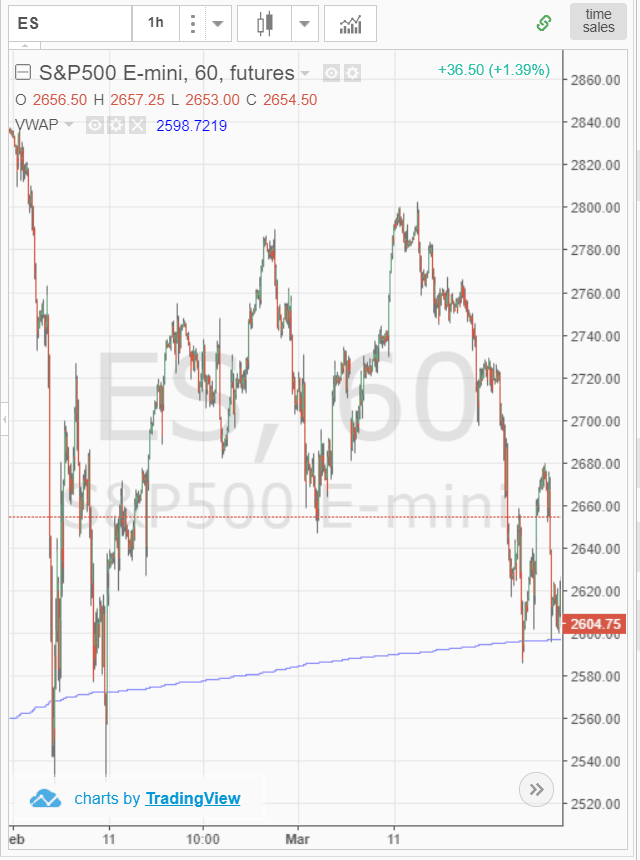
S&P VWAP Retest #2
The S&P rallied more than 10% from the lows.
What do you think happened when the S&P 500 E-mini took another breather?
That’s right, the futures contract ran right back down to the VWAP for support. The VWAP provided support over the last few tests.
Keep in mind, though, that more tests can weaken the resolve of the bulls.
I this case, the S&P went lower.
Chapter 11: VWAP Futures Case Study
So far we have covered trading strategies and how the VWAP can provide trade setups.
Now, let’s discuss a case study to highlight how price interacts with the VWAP to help formulate a trading strategy.
Many traders will have their own hypothesis in place and subject that hypotheses on the market.
Our approach is to observe the market’s behavior and apply rules that can construct an objective system for trading.
Methodology
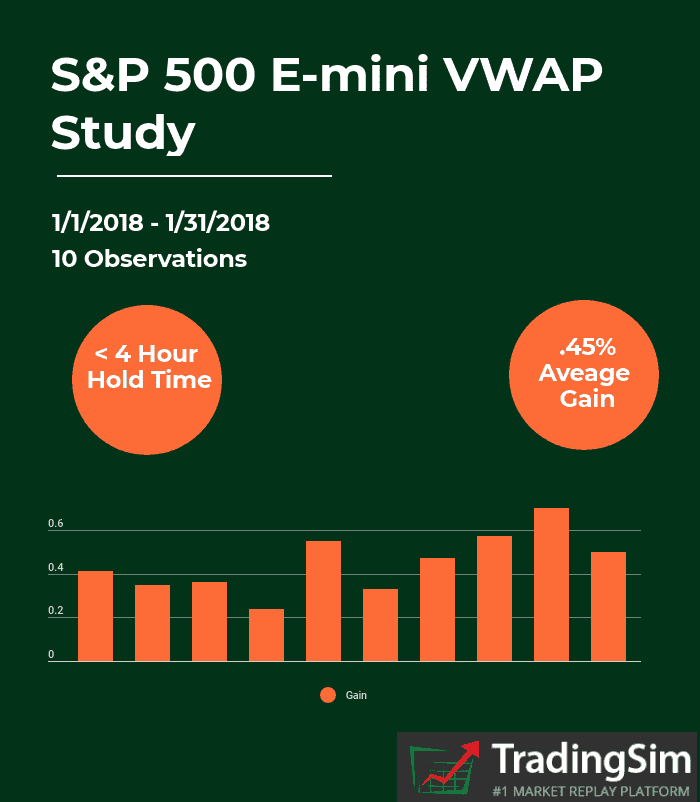
Analyze the S&P 500 E-mini contract for this case study. We did this because the E-mini has high volume, tight spreads and consistent price movement. This way we would have an increased likelihood of a repeatable pattern in the contract.
Use the 5-minute time frame to increase the number of trade signals
Observe price action from 1/1/2018 – 1/31/2018
Track price movement once spread between VWAP and S&P 500 E-mini reached .4% or greater.
Note where counter price move ended to calculate potential gains
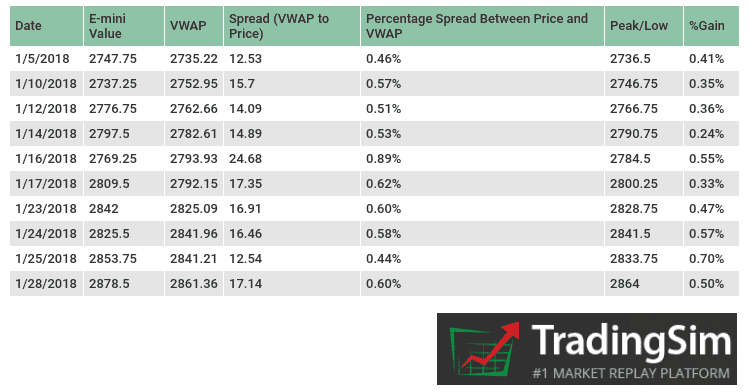
Here is what we found. Take a look at the below table of the observations.
Data
Let’s unpack the data in this table further.
Date – captures the time when the spread between the Price and VWAP was greater than .4%
E-mini value – either the low or high point reached once the spread between price and VWAP hits .4%
VWAP – the value of the VWAP when the low or high is registered after the spread between price and VWAP hits .4%
Spread – absolute value of the difference between VWAP and Price
Percentage Spread – percentage value of the difference between the VWAP and Price
Peak/Low – peak high point or low value of swing low
%Gain – represents the move from the high or low pivot point
The point of the study is to illustrate that as the S&P pulls away from the VWAP, at some point it has a sharp correction back to the indicator.
Clearly, VWAP can provide a a significant impact on the movement of a stock. It is up to you to find ways of trading around it consistently.
When trading this strategy remember to account for slippage as you will not get the highs and lows for entry/exit.
Other VWAP Strategies
For those inclined to trade small cap and low float stocks, we’ve put together an in depth guide to a strategy caled VWAP Boulevard.
Essentially, it is a lot like a pivot point, or area of long term resistance. What happens during the trading day at these levels can determine huge gains on the long or short side depending on the context.
To that point, VWAP Boulevard is somewhat similar to another strategy popularized by Brian Shannon, CMT. It’s called Anchored VWAP.
This strategy “anchors” the volume weighted average price on daily charts to special “events” days. Those events could be lows on the chart, high volume days, earnings, news releases, etc.
The theory is that the volume anchored to these particular days will either provide support or resistance in the future.
As Shannon describes it:
In a trending market, the classic horizontal support and resistance levels are not always obvious. If we want to measure price memory from an “event” the Anchored Volume Weighted Average Price tool is the most effective means to accomplish this task.
Brian Shannon, CMT
Conclusion
Once you apply the VWAP to your day trading, you will soon realize that it is like any other indicator. There are some stocks and markets where it will nail entries just right and others it will appear worthless.
If you use the VWAP indicator in combination with price action or any other technical trading strategy, it can simplify your decision-making process to a certain extent.
For example, when trading large quantities of shares, using the VWAP can ensure you are paying a fair price.
Just remember, the VWAP will not cook your dinner and walk your dog. You need to make sound trading decisions with what the market is showing you at any given moment.
If you have questions about the VWAP or want to discuss your experiences, please share in the comments section below.
Alton Hill is the Co-Founder of TradingSim with over 18 years of trading experience. He completed the Design Thinking Bootcamp at Stanford’s D.School and brings expertise in Product Development to create the best trading simulation experience. His strategy focuses on trend-following systems, targeting high-volatility stocks with strong primary trends using the 15-minute chart.
The Kill Candle. It just sounds menacing, doesn’t it? And for good reason. If you’ve ever been caught in one on the long side, you understand the pain. What Is A Kill Candle? Day trading legend Bao...
Three Explosive Anchored VWAP Strategies + Explanation Video
Most anchored vwap strategies are centered around swing trading. However, the strategies used on daily charts can also become major support or resistance for day traders. In this post, we’ll show you...
VWAP Boulevard: The Ultimate Day Trading Strategy for Low-Float Stocks [#vwapboulevard]
VWAP Boulevard has become one of the most popular day trading strategies in the finwit community lately. Discovered and popularized by Twitter phenom @team3dstocks, thousands of traders are now using...


 Day Trading


