Day Trading with Pivot Points: Levels, Setups & Formulas [Updated April 2026]
Apr 20, 2026
Written by: Al Hill
✓ Reviewed by Kunal Vakil, Co-Founder of TradingSim · Updated Apr 20, 2026
Today we will dive deep into the significance of Pivot Points for day trading. When you finish reading this article, you will understand the 5 reasons why day traders love using them for entering and exiting positions,and how you can employ them as a part of your overall trading plan.
Feel free to watch our free tutorial on Pivot Points by in-house daytrading expert, Al Hill. Al is a 20-year trading veteran.
What Are Pivot Points
As a technical analysis indicator, a pivot point uses a previous period’s high, low, and close price for a specific period to define future support. In addition, other small calculations determine the “outside” points.
Together, these can determine the bounds of a stock price over different time periodsgiving traders an edge on the market.
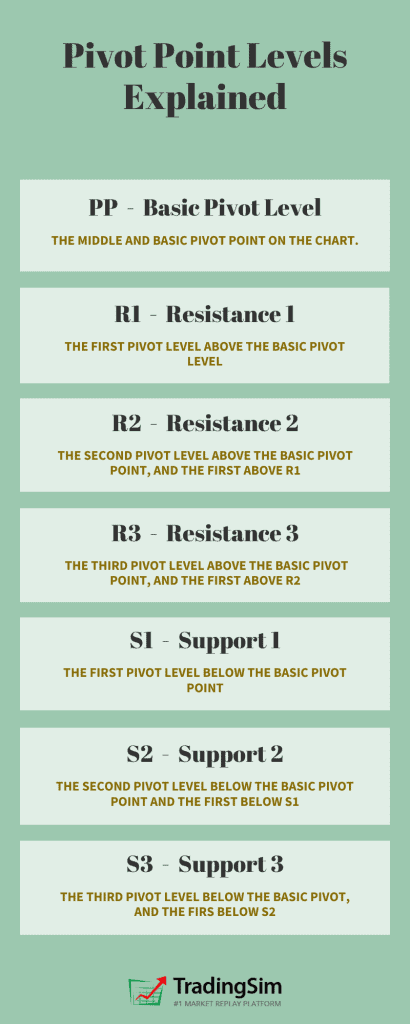
7 Pivot Point Levels Explained
There are seven basic pivot levels on the chart:
7 key Pivot Points explained
History of Pivot Points
Pivot points were originally used by floor traders on stock exchanges. They used the high, low, and close prices of the previous day to calculate a pivot point for the current trading day.
This calculation helped them notice important levels throughout the trading day. Pivot points have predictive qualities, so they are considered leading indicators to traders.
The main pivot point is the most important price level for the day. Essentially, it represents the balance between bullish and bearish forces.
In other words, when prices are above the pivot point, the stock market is considered bullish. If prices fall below the pivot point, the market is considered bearish.
While pivot points were originally used by floor traders, they’re now used by many retail traders, especially in equities and forex.
5 Reasons Why Day Traders Love Pivot Points
What Is Pivot Point In Trading?
The pivot points formula takes data from the previous trading day and applies it to the current trading day. In this manner, the levels you are looking at are applicable only to the current trading day. This makes the pivot points the ultimate unique indicator for day trading.
2) Short Time Frames
Since the pivot points data is from a single trading day, the indicator can only be applied to shorter time frames. The daily and the 30-minute chart will not work, because it will show only one or two candles.
The best timeframes for the pivot point indicator are 1-minute, 2-minute, 5-minute, and 15-minute. Hence, its use for day traders.
3) High Accuracy
The pivot point indicator is one of the most accurate trading tools. The reason for this is that the indicator is used by many day traders, professional and retail alike.
This will allow you to trade with confidence and the flow of the market.
4) Rich Set of Data
Pivot points on charts provide a rich set of data. As we discussed above, the indicator gives seven separate trading levels. This is definitely enough to take a day trader through the trading session.
5) Easy to Use
The PP indicator is an easy-to-use trading tool. Most of the trading platforms offer this type of indicator. This means that you are not required to calculate the separate levels; in fact, the Tradingsim platform will do this for you. Your only job will then be to trade the bounces and the breakouts of the indicator.
Pivot Point Calculation
Daily pivot points are calculated based on the high, low, and close of the previous trading session.
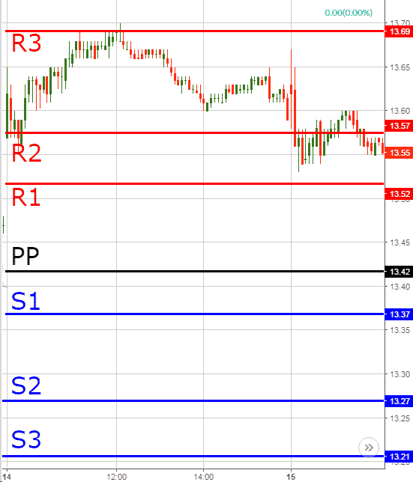
When you add the seven pivot levels, you will see 7 parallel horizontal lines on the chart.
Pivot Points
The above chart is zoomed out in order to show all 7 pivot levels.
Let’s now discuss the way each of the seven pivot points is calculated. First, we need to start with calculating the basic pivot level (PP)– the middle line.
PP Calculation
Below is the formula [1] you should use to determine the PP level on your chart:
Pivot Point (PP) = (Prior Daily High + Low + Close) / 3
What Is Pivot Point In Trading?
Now that we know how to calculate the PP level, let’s proceed with calculating the R1, R2, S1, and S2 pivot levels:
R1 = (2 x Pivot Point) – Prior Daily Low
R2 = Pivot Point + (Prior Daily High – Prior Daily Low)
S1 = (2 x Pivot Point) – Prior Daily High
S2 = Pivot Point – (Prior Daily High – Prior Daily Low)
R3 S3 Pivot Levels Calculation
We are almost done with the pivot point calculation. There are two more levels to go – R3 and S3.
R3 = Daily High + 2 x (Pivot Point – Prior Daily Low)
S3 = Daily Low – 2 x (Prior Daily High – Pivot Point)
See that the formulas for R1, R2, R3, S1, S2, and S3 all include the PP value.
This is why the basic pivot level is crucial for the overall pivot point formula. Therefore, you should be very careful when calculating the PP level. After all, if you incorrectly calculate the PP value, your remaining calculations will be off.
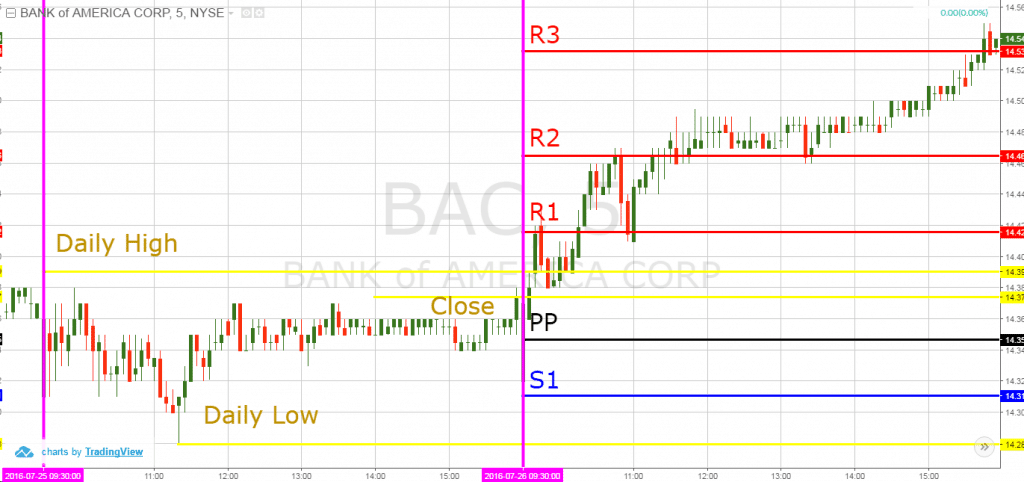
Pivot Points 2
You are now looking at a chart, which takes two trading days. Each trading day is separated by the pink vertical lines. We use the first trading session to attain the daily low, daily high, and close.
Daily High = 14.39
Daily Low = 14.28
Close = 14.37
Then we apply the three values in the formulas above, and we get the following results:
PP = 14.35
R1 = 14.42
R2 = 14.46
R3 = 14.53
S1 = 14.31
S2 = 14.24 (not visible)
S3 = 14.20 (not visible)
5 Different Kinds of Pivot Points
Here are five types of the most popular pivot points.
1. Standard pivot points
Standard pivot points are the most basic pivot points that day traders can calculate. First, traders start with a base pivot point. That’s the average of the high, low, and close from a previous period.
Below is the complete calculation for standard pivot points.
To calculate the Base Pivot Point:
(P) = (High + Low + Close)/3 calculate the First Support Level: Support 1 (S1) = (P x 2) – High
When calculating the Second Support Point:
Support 2 (S2) = P – (High – Low)
To calculate the First Resistance Level:
Resistance 1 (R1) = (P x 2) – Low
When calculating the Second Resistance Level:
Resistance 2 (R2) = P + (High – Low)
2. Fibonacci Pivot Points (The Most Popular)
The Fibonacci pivot point is perhaps the most popular among traders.
Fibonacci extensions, retracements, and projections are commonly used in forex, but are used with equities as well. The Fibonacci retracement levels are named after a mathematical sequence.
Ken Ribet is professor of mathematics at the University of California, Berkeley. He points out that a Fibonacci number started out having a simple formula.
“A lot of things in mathematics and probably in the real world are governed by simple recursive rules, where each occurrence is governed by a simple formula in terms of the previous occurrence. And a Fibonacci number has the simplest possible formula, just the sum of the previous two.”
In the her speech, Stockton points out that Fibonacci levels can become so “widely followed level that…there becomes some self-fulfilling property to it.”
Here is the calculation for the Fibonacci pivot point.
To calculate the Base Pivot Point:
Pivot Point (P) = (High + Low + Close)/3
When calculating the First Support Level:
Support 1 (S1) = P – {.382 * (High – Low)}
To calculate the Second Support Level:
Support 2 (S2) = P – {.618 * (High – Low)}
When calculating the First Resistance Level:
Resistance 1 (R1) = P + {.382 * (High – Low)}
To calculate the Second Resistance Level:
Resistance 2 (R2) = P + {.618 * (High – Low)}
When calculating the Third Resistance Level:
Resistance 3 (R3) = P + {1 * (High – Low)}
3. Woodie’s Pivot Point
Woodie’s pivot points place more weight on the closing price. However, the calculation is similar to the standard pivots formula.
The calculation is as follows:
R2 = PP + (High – Low)
R1 = (2 X PP) – Low
PP = (High + Low) + (2 x Closing Price) / 4
S1 = (2 X PP) – High
S2 = PP – (High + Low)
4. Camarilla Pivot Points
Another pivot point that traders use are Camarilla pivot points. Nick Scott invented the Camarilla pivot point in the 1980s.
It’s similar to the Woodie’s pivot point. However, there are four resistance levels and four support levels. In contrast, the Woodie pivot point has two Resistance levels and two Support levels.
This is the calculation for the Camarilla pivot point:
R4 = Closing + ((High -Low) x 1.5000)
R3 = Closing + ((High -Low) x 1.2500)
R2 = Closing + ((High -Low) x 1.1666)
R1 = Closing + ((High -Low x 1.0833)
PP = (High + Low + Closing) / 3
S1 = Closing – ((High -Low) x 1.0833)
S2 = Closing – ((High -Low) x 1.1666)
S3 = Closing – ((High -Low) x 1.2500)
S4 = Closing – ((High-Low) x 1.5000)
5. Demark Pivot Points
Demark pivot points have a different relationship between the opening and closing prices. Noted trader Tom Demark introduced this version.
The Demark pivot point uses the number X to calculate the lower level line and the upper resistance level. It also emphasizes recent price action. The calculation is as follows:
If Close > Open, then X = (2 x High) + Low + Close
If Close < Open, then X = High + (2 x Low) + Close
If Close = Open, then X = High + Low + (2 x Close)
Pivot Point = X/4
Resistance 1 = X/2 – Low
Support 1 = X/2 – High
How to Draw the Pivot Point Stock Market Indicator
The pivot point stock market indicator should be applied to the chart as follows:
PP level
R1 and S1
R2 and S2
R3 and S3
When you follow this order there is a small chance that you might mistakenly tag each level. To avoid this potential confusion, you will want to color-code the levels differently.
For example, you can always color the PP level black. Then the R1, R2, and R3 levels could be colored in red, and S1, S2, and S3 could be colored in blue. This way you will have a clear idea of the PP location as a border between the support and the resistance pivot levels.
Thankfully, these days many charting platforms have a built-in pivot point indicator. This means that the indicator could be automatically calculated and applied on your chart with only one click of the mouse.
This will definitely save you a ton of time.
How Pivot Points Work
Pivot points provide a standard support and resistance function [2] on the price chart.
When price action reaches a pivot level it could be:
Supported/Resisted
Extended (breakouts)
All things considered, if you see the price action approaching a pivot point on the chart, you should treat the situation as a normal trading level. Nonetheless, if the price starts hesitating when reaching this level and suddenly bounces in the opposite direction, you might then trade in the direction of the bounce.
However, if the price action breaks through a pivot, then we should expect the action to continue in the direction of the breakout. This is called a pivot point breakout.
Day Trading with Pivot Points
Now that we understand the basic structure of pivot points, let’s now review two basic trading strategies – pivot level breakouts and pivot point bounces.
1. Pivot Point Breakout Trading
To enter a pivot point breakout trade, you should open a position using a stop limit order when the price breaks through a pivot point level. These breakouts will mostly occur in the morning.
If the breakout is bearish, then you should initiate a short trade. If the breakout is bullish, then the trade should be long.
Always use a stop loss when trading pivot point breakouts.
A good place for your stop would be a top/bottom which is located somewhere before the breakout. This way your trade will always be secured against unexpected price moves.
You should hold your pivot point breakout trade at least until the price action reaches the next pivot level.
How it works:
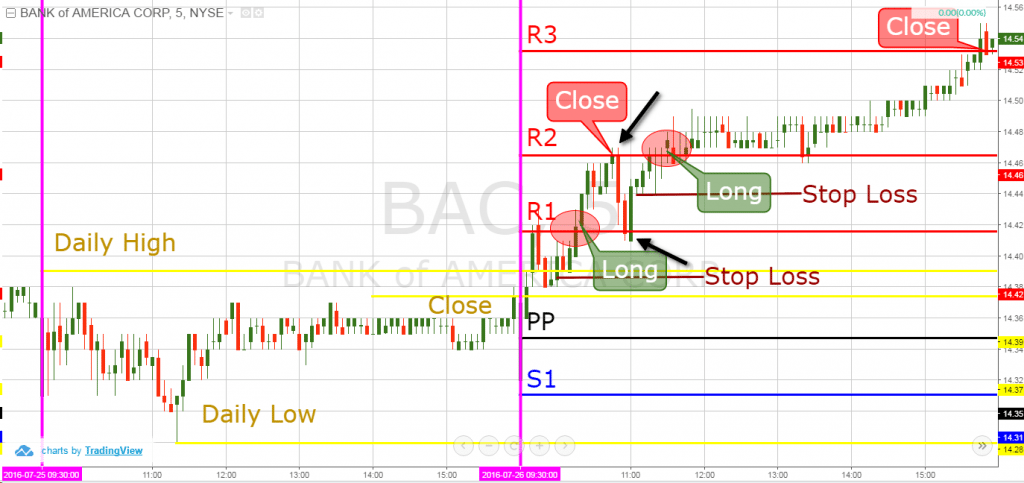
Pivot Point Breakout Strategy
This is the 5-minute chart of Bank of America from July 25-26, 2016. The image illustrates bullish trades taken based on our pivot point breakout trading strategy.
The first trade is highlighted in the first red circle on the chart when BAC breaks the R1 level. We go long and we place a stop loss order below the previous bottom below the R1 pivot point. As you see, the price increases rapidly afterwards.
For this reason, we hold the trade until the price action reaches the next pivot point on the chart. When this happens, the price creates a couple of swing bounces from R2 and R1.
After bouncing from R1, the price increases and breaks through R2. This creates another long signal on the chart. Therefore, we buy BAC again.
There is a long lower candlewick below R2, which looks like a good place for our stop loss order.
The price then begins hesitating above the R2 level. In the last hours of the trading session, BAC increases again and reaches R3 before the end of the session.
This is an exit signal and we close our trade.
2. Pivot Point Bounce Trading
This is another pivot point trading approach. Instead of buying breakouts, in this pivot point trading strategy we emphasize the examples when the price action bounces from the pivot levels.
If the stock is testing a pivot line from the upper side and bounces upwards, then you should buy that stock.
Conversely, if the price is testing a pivot line from the lower side and bounces downwards, then you should short the security.
As usual, the stop loss order for this trade should be located above the pivot level if you are short and below if you are long.
To be clear, pivot point bounce trades should be held at least until the price action reaches the next level on the chart.
How it works:
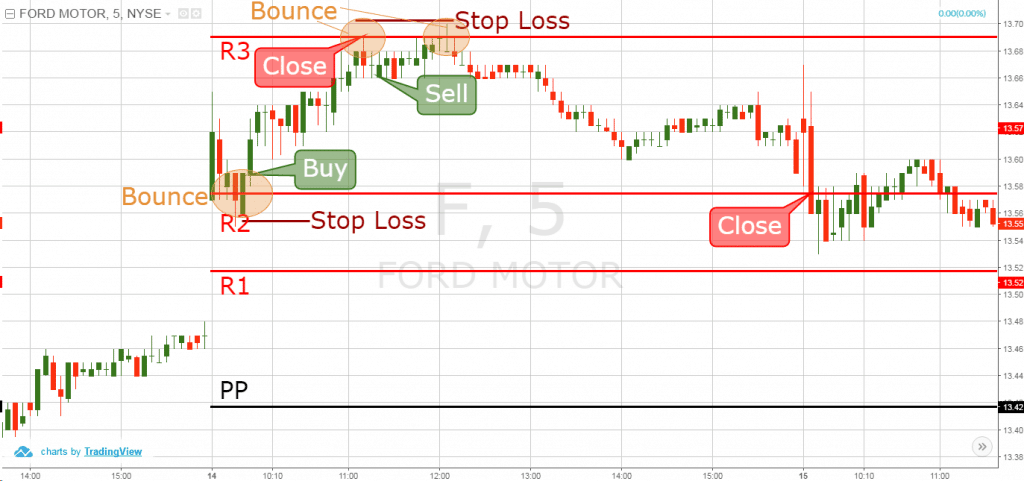
Pivot Point Bounce Strategy
Above is a 5-minute chart of the Ford Motor Co. The image shows a couple of pivot point bounce trades taken according to our strategy.
Our pivot point analysis shows that the first trade starts 5 periods after the market opening. The price goes above R2 at the opening bell. Then we see a decrease in supply and a bounce from the R2 level. This creates a long signal on the chart and we buy Ford placing a stop loss order below the R2 level.
Immediately following, the price enters a bullish trend. Because of this, we stay with the trade until Ford touches the R3 level.
At this point, we close the trade.
However, the price bounces downwards from the R3 level after the second test. This is another pivot point bounce, so we short Ford security as stated in our strategy.
A stop loss order should be placed above the R3 level as shown on the chart.
After a short consolidation and another return and a bounce from the R3 level, the price enters a bearish trend. We hold the short trade until Ford touches the R2 level and creates our exit signal.
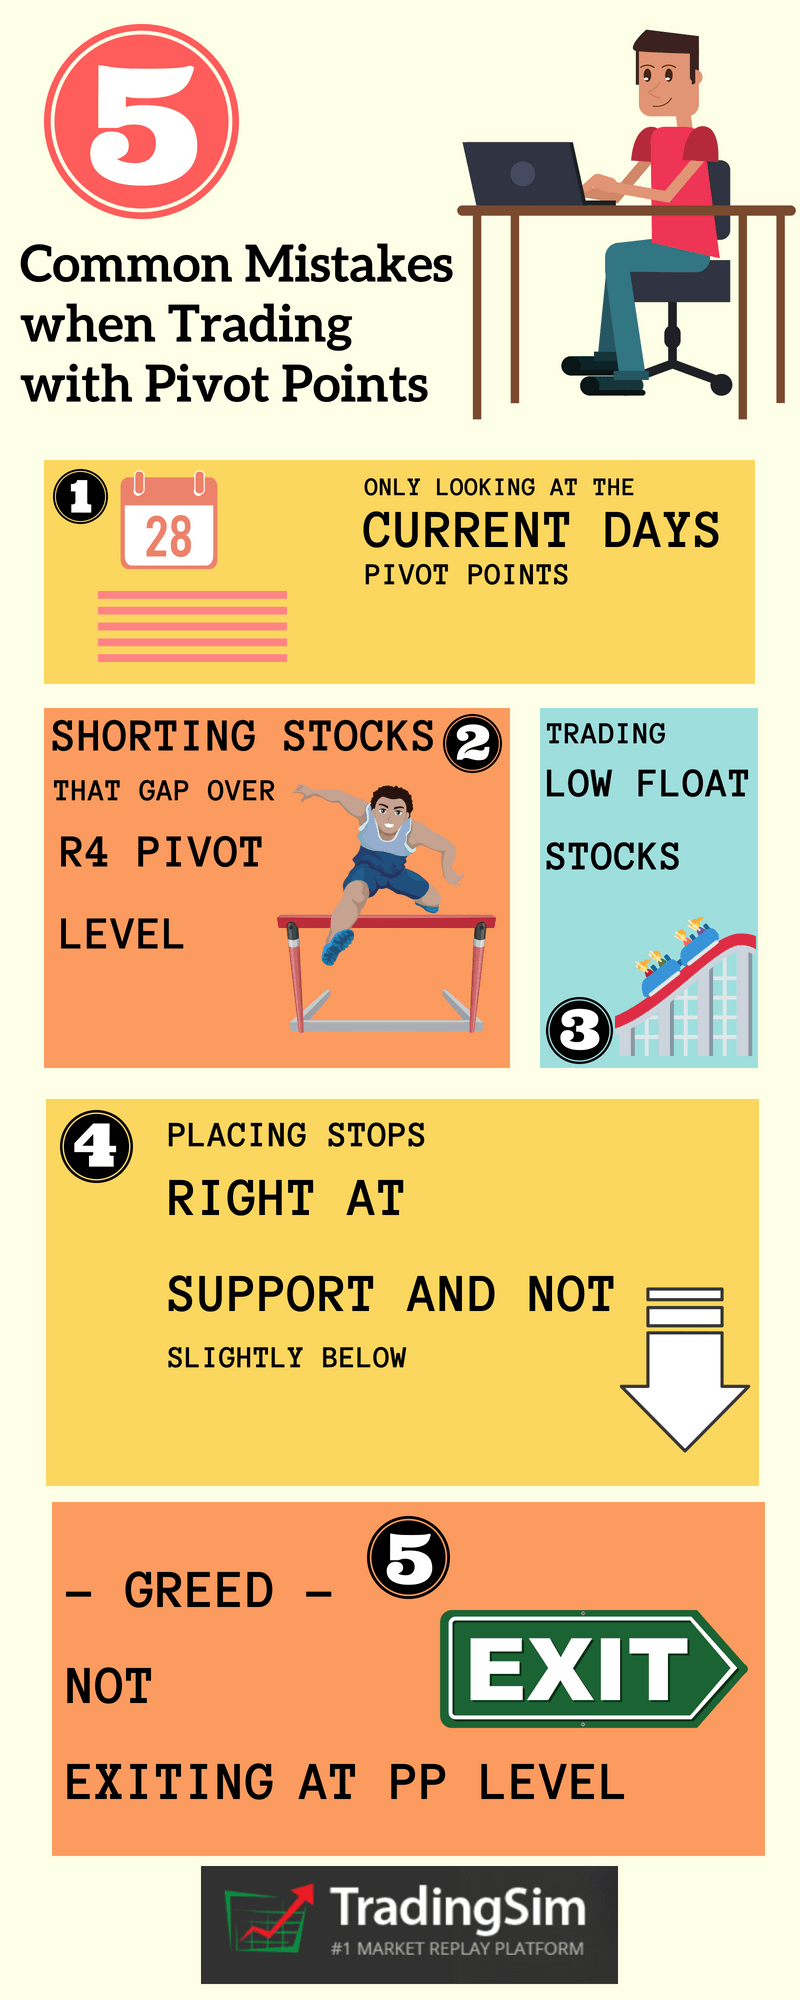
5 Common Mistakes when Trading with Pivot Points
Trades that Clear S4 or R4
These are the setups you really want to hone in on.
Think about it, why buy a stock that has resistance overhead. You can just as easily invest in a stock that has the wind to its back and you can ride the wave higher.
If there is no one looking to sell at a pivot point resistance level and there are no swing highs – that equals odds in your favor.
Even when things go wrong, you are still likely to come out even or at least have a fighting chance.
This going with the trend, of course, works just as well with shorts that clear S4 support.
Here is a real example of this pivot point trading strategy with Advanced Auto Parts (AAP).
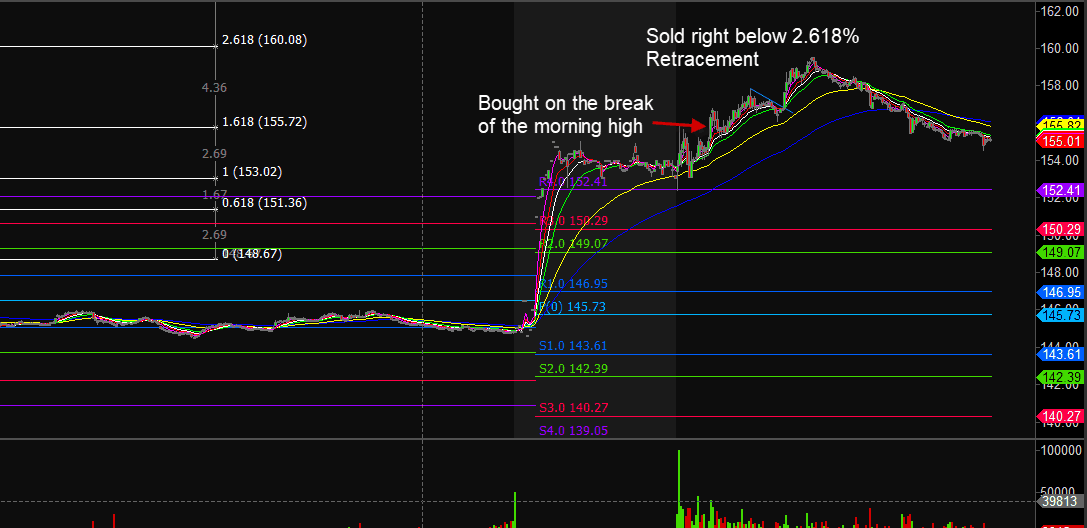
Pivot Points and Fibonacci Levels
Is there anything different on the chart that you weren’t expecting to see?
If you can’t point it out, it’s the Fibonacci levels in the upper left of the chart.
Fibonacci Levels
Once a stock has cleared all of the daily pivot points, the next thing you need to look for are the overhead Fibonacci extension levels and swing highs from previous moves.
These levels can be used as your target areas for your trades. You can then use these levels to calculate your risk-reward for each trade.
After purchasing the stock on the break of both the pre-market and intra-day high, it’s now about holding on and riding the trend up to the next Fibonacci level at around 261.8% (2.618) retracement.
At this point, you do not want to get greedy. You should always look to clean off your trade slightly below that level.
Try applying these techniques to your charts to identify the levels tracked by professional traders.
Pivot Points and High Float Stocks
Nowadays many gurus are talking about low float, momo stocks that can return big gain. There may be a place for trading those stocks if you are highly experienced and accustomed to volatility and high risk.
However, when it comes to Pivot Points, high float stocks are still in vogue [3].
The beautiful thing about higher float stocks is that these securities will adhere to and trade in and around pivot point levels in a predictable fashion.
If you are a trader just starting out with pivot points and want to get a handle on things, you will want to start with these large-cap stocks. Once you get a handle on things, you can always progress to the penny stocks.
How Pivot Points Help Build Consistency
Do you find yourself obsessing about when to exit your trades. Maybe your entries are solid but you always have sellers remorse.
You either regret getting out too early or holding on too long.
This is something many traders struggle with for years.
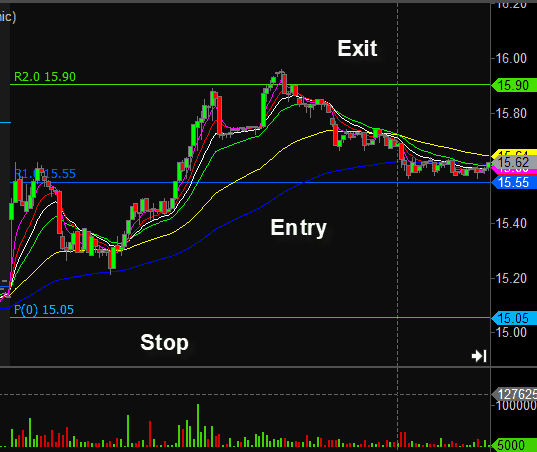
To this point, including pivot points in your trading could be like going from the dark and stepping into the light. The beauty of using pivot points is that you have three clear levels:
where to enter the trade
when to exit the trade
how to place your stop
If you are the type of person that has trouble establishing these trading boundaries, pivot points can be a game-changer for you.
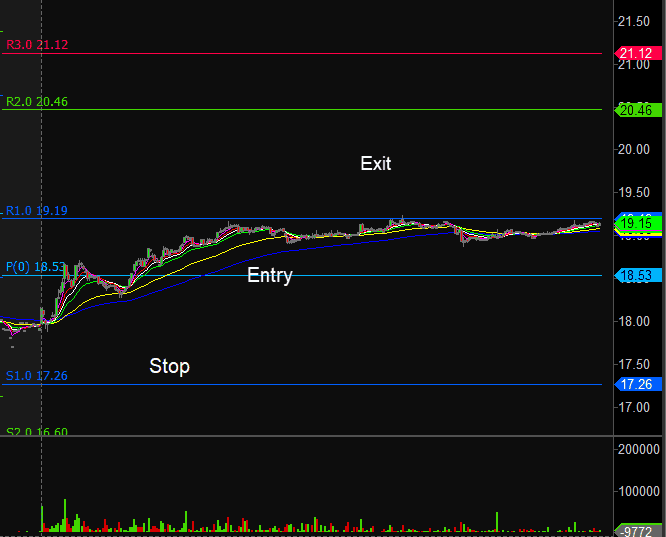
To further illustrate this point, check out the below charts
Entry, Exit, StopsEntry, Exit, Stops – 2
Do you see the beauty of the pivot points on the chart?
If you struggle with where to place your stops, entries and profit targets, pivot points take care of all of that for you.
You do not need an expensive trading system or AI program to accomplish this goal.
The other major point to reiterate is that you can quickly eyeball the risk and reward of each trade. Therefore over time, you will inevitably win more than you lose, and the winners will be larger.
This, my friend, is how you build wealth – one trade at a time.
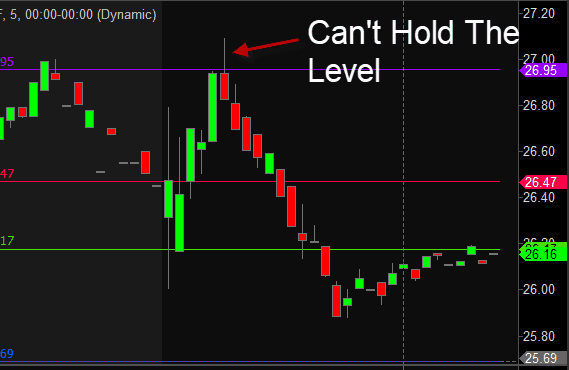
Knowing When You are In a Losing Trade with Pivot Points
If you are going long in a trade on a break of one of the resistance levels and the stock rolls over and retreats below this level – you are likely in a bad spot.
Cannot Hold the Level
This should give you pause for concern when it doesn’t pan out the way you had planned.
This does not mean you need to run for the hills, but it does mean you need to give the right level of attention to price action at this critical point.
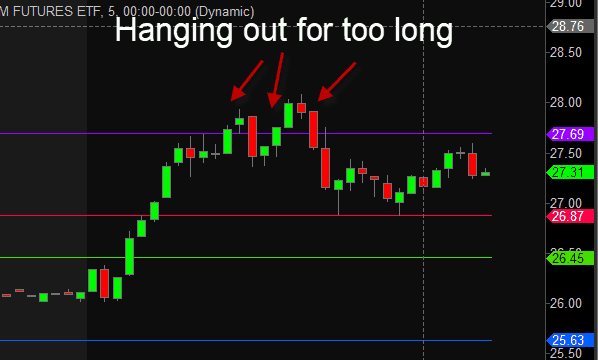
Time Lapse
The other point is to consider the amount of time that passes after you have entered your position.
If your position is sitting below or right around the breakout level 30 minutes after entering the trade – the stock is screaming warning signals.
Too Much Time
Do not over think exiting bad trades. If you find yourself in a trade that is stalling or not holding a level, just exit the trade. Waiting around for something to happen can lead to more losses.
Beyond the money, the major issue you will face is the emotional turmoil of tacking such a loss. Remember, do not think – just close the trade!
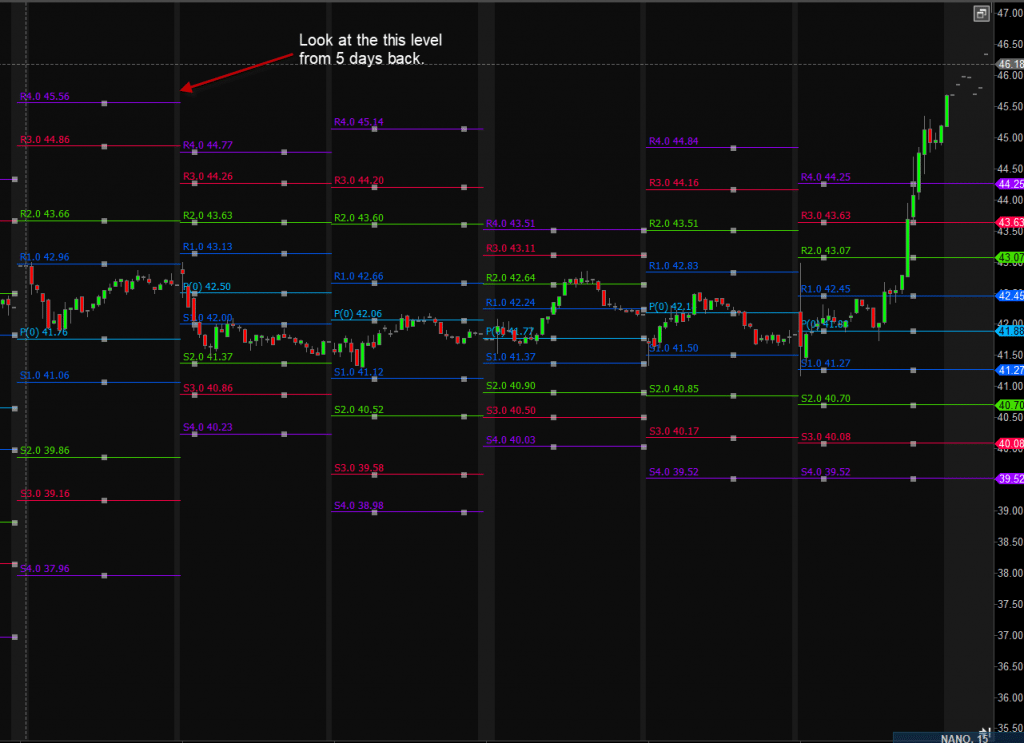
Pivot Points from Prior Days
Most charting software will allow you to select whether you want to see the current day’s pivot points or if you would like to see pivot points from prior days.
At first glance, it’s easy to want to focus on the current day levels as it provides a clean chart pattern; however, prior days levels can trigger resistance on your chart.
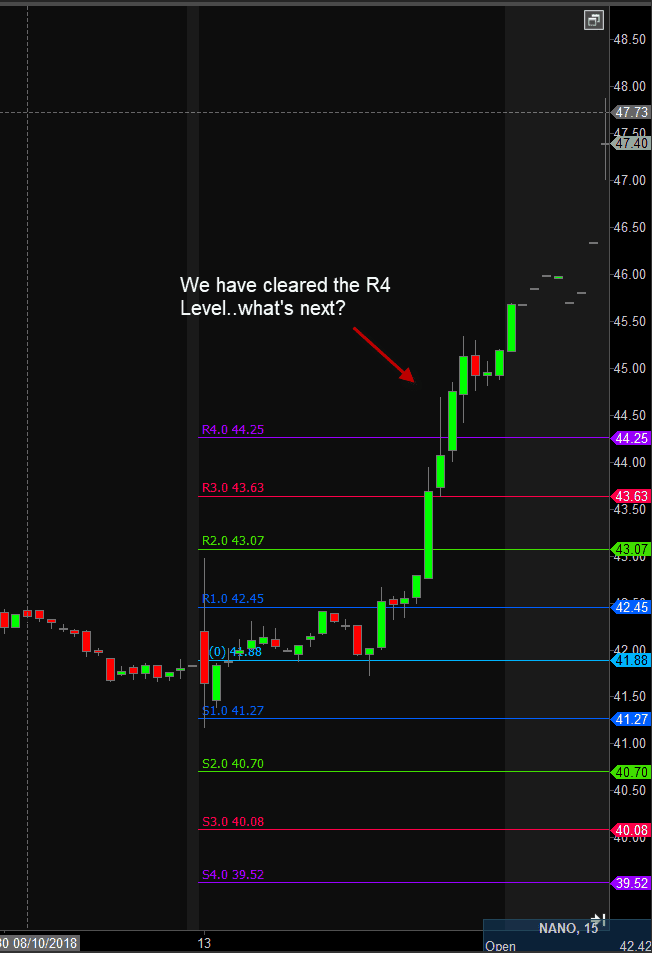
R4 Level Cleared
In the above chart of NANO you can see that the R4 level was cleared. The next question you are likely to ask yourself is where will NANO stop?
Unfortunately, simply looking at the pivot points for one day gives you no way of making that determination.
Multiple Days of Pivot Point Levels
Now, let’s take another look at that example with more than one day’s worth of pivot point data.
Multiple Days of Pivot Points
As you can see in the chart, there are a number of resistance levels near our closing price on the day. Like any other indicator, there is no guarantee the price will stop on a dime and retreat.
The point of highlighting these additional resistance levels is to show you that you should be aware of the key levels in the market at play.
You will need to look at the level 2 or time and sales to see which level you need to focus on. This is the real challenge. If you immediately sell you might possibly forego big profits.
As an option, you could sell out at the next resistance level up. You might be leaving money on the table, but there is a greater risk of being greedy and looking for too much in the trade.
Placing Stops
Trading with pivot points allows you the ability to place clear stops on your chart. What you do not want to do is simply place your stops in line with the next level up or down.
You have to take more care when identifying your stop placement.
Remember, you are not the only one that is able to see pivot point levels.
Anyone with a charting application can know the R1, R2 and R3 levels.
So, how do you still protect your trade but without risking too much?
Beyond Key Psychological Price Levels
For starters, you could place your stop just beyond the levels. In other words, you will want to hide the stop behind logical price levels.
For example, if you have an S1 level at $19.65, then you will want to place your stop at $19.44. Why at this level? 50 cents is a big mental price level for stocks under $20 bucks.
Therefore, you will likely have a large number of stops right at the level. Therefore, if you place your stop slightly beyond this point, you might avoid being stopped out of the trade as a shake out.
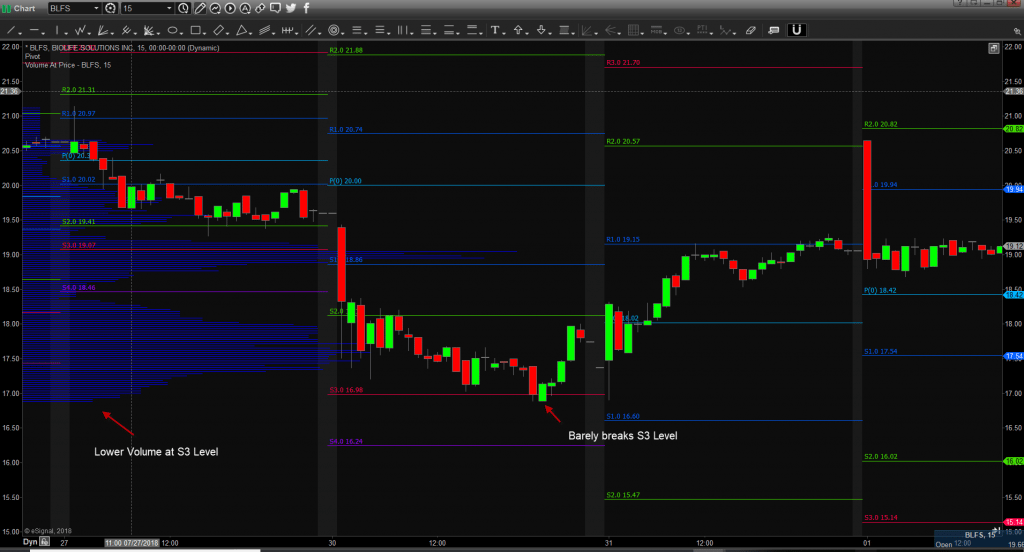
Volume at Price
Another method is to look at the amount of volume at each price level. If you are long and are eyeing an S1 level to stop the selling pressure, you can also see how much volume has been traded at a certain price level.
The idea is to then place your stop slightly below or above these levels. Let’s look at a chart to illustrate this point.
Volume at Price – Pivot Points
In the above example, notice how the volume at the support level was light. This shows you that there was not a lot of selling pressure at this point and a rebound was likely to occur at this level.
Next, notice how the price barely breached the S3 level and then reversed higher. For this type of setup, you want to see the price hold support and then set your target at a resistance level that has accompanying volume.
After BLFS bounced, it ran up to the R1 resistance before consolidating which coincidentally had a decent amount of volume at the $19.15 price level.
If you were long, a stop directly below the S3 level would have kept you in the trade.
How to Practice with Pivot Points
Hopefully you now have an intimate knowledge about Pivot Points: their formulas, strategies, and usefulness for day traders.
As with any trading strategy, it takes time and practice to really gain the upper hand on the market. For this reason, there is no better way to practice Pivot Points than in a simulator.
We suggest trying at least a 20-trade sample of this strategy and analyzing those trades before putting real money to work.
Pivot points are horizontal support/resistance levels calculated from the prior session's high, low, and close. The central line is the Pivot (P), with three support levels below (S1, S2, S3) and three resistance levels above (R1, R2, R3). Day traders use them as pre-computed decision levels that the whole market can see, which is part of what makes them self-reinforcing.
Classic pivot formulas:
P = (High + Low + Close) / 3
R1 = 2P − Low S1 = 2P − High
R2 = P + (High − Low) S2 = P − (High − Low)
R3 = High + 2(P − Low) S3 = Low − 2(High − P)
Three Practical Pivot Point Setups for Day Traders
Pivot bounce. Price opens above P, pulls back to P, prints a reversal candle, and resumes the trend. Entry on the break of the reversal candle high; stop below the candle low; first target R1.
Pivot reclaim. Price opens below P, fails at a retest, reclaims P with volume, and trends to R1–R2. The reclaim is the tell — without it, you're fighting the early-session trend.
R1 rejection for shorts. On an overall weak day, a first touch of R1 that fails and rolls back through P is a high-probability short. Works best on days with declining RVOL.
Pivot Points vs Other Support/Resistance Tools
Pivots are mechanical — everyone gets the same levels. That makes them useful as a shared reference point the way VWAP is, but the levels themselves aren't magic. They work because enough traders plot them. Key differences versus other S/R tools:
VWAP is dynamic and updates throughout the day. Pivots are static for the whole session.
Prior day high/low overlaps with pivots but only gives two levels, not seven.
Moving averages are trend-following; pivots are pure S/R.
Fibonacci levels are subjective (you pick the swing); pivots are objective (math on yesterday's bar).
Choosing a Pivot Variant
Beyond classic (floor-trader) pivots, the most common variants are Fibonacci pivots (uses 38.2% / 61.8% / 100% of yesterday's range), Camarilla pivots (closer levels for mean-reversion traders), and Woodie pivots (double-weights the close). All four calculate P roughly the same way and only diverge on S1/R1 and beyond. For day trading equities, classic pivots are the mainstream default.
Practice Pivot Point Setups in the TradingSim Simulator
The TradingSim stock trading simulator lets you replay any recent session with classic pivots plotted, so you can see how price actually reacts at P, R1, S1 before risking real money. For futures traders, the TradingSim futures simulator lets you study pivot reactions on ES, NQ, CL, and GC — markets where pivot levels are heavily watched.
Do pivot points work on all timeframes? Pivots are most commonly used intraday on 1-min, 5-min, and 15-min charts. Weekly and monthly pivots also exist for swing traders but are less popular.
When do you plot pivot points? Pivots are calculated from the prior session's high, low, and close and plotted for the entire next session — they don't move during the day.
Which pivot variant is best? Classic (floor-trader) pivots are the most widely used. Camarilla pivots are popular with mean-reversion traders because their levels are tighter.
Do futures traders use pivot points? Yes — futures markets like ES and NQ are among the most pivot-aware markets because of their institutional floor-trading history.
Are pivot points better than VWAP? Neither is "better." Pivots give seven static levels before the open; VWAP gives one dynamic line during the session. Many traders use both together.
Alton Hill is the Co-Founder of TradingSim with over 18 years of trading experience. He completed the Design Thinking Bootcamp at Stanford’s D.School and brings expertise in Product Development to create the best trading simulation experience. His strategy focuses on trend-following systems, targeting high-volatility stocks with strong primary trends using the 15-minute chart.
VDU and Pocket Pivots: “VooDoo” for your day trading
Volume Dry Up (VDU) and Pocket Pivots are some of the most powerful precursors to big moves in the stock market when interpreted correctly. Often called VooDoo, for the acronym VDU, by discoverers...
Day Trading Support and Resistance Levels | Tradingsim Video Lessons
Hi Guys, I’ve put a quick video together on a great trade from earlier in the week. The trade illustrates how you can use key support and resistance levels on the larger timeframe charts (daily,...


 Awesome Day Trading Strategies


