The most dynamic and active period of the trading day is the opening range. Since this is the most volatile time frame during the trading day, we believe it deserves special attention from our side.
In this article, we will cover three methods for trading the opening range. After reading this material, you will feel more confident when attempting to trade during a time when the market feels the most chaotic.
Open Range Definition
The opening range is simply the high and low of a given period after the market opens. This period is generally the first 30 minutes or the first hour of trading.
During this period, you want to identify the high and low of the day. In addition, you will also want to account for the pre-market highs and lows, as these levels will often act like a magnet on price action after the bell rings.
Since the opening bell is associated with big trading volumes and volatility, this time of the session provides many trading opportunities. In this manner, traders use the opening range to set entry points on the chart and to forecast the price action for the day.
Size of the Opening Range
The first thing you need to do before attempting to trade the opening bell is to measure its size.
When the market opens and you spot the open range of a stock, there will be two candles which will help you measure the size of the range.
The first candle is the one which is last from yesterday’s trading session. The second candle is the first one created when the market opens. To get the range size you need to take the high/low of the yesterday’s closing and the high/low of the today’s opening candle. The distance between these two prices is the size of the opening range. Now see how we measure the size of a range:
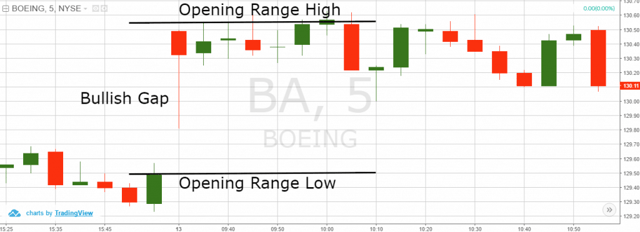
Opening Range
The image above illustrates an opening range. The black horizontal lines measure the size of the range. The upper line shows the opening range high and the lower horizontal line is the opening range low.
For a more conservative range, you could just look at the price action after the open, but this will mask the inherent risk of trading a 15% gap for example. While the morning range could be pretty tight in this scenario, if the stock decided to close the gap from the previous day, you essentially are ignoring the fact there is 15% of space between your entry and the floor of the move.
Opening Range Breakout Calculator
The most important part of the opening range trading is the breakout from the range.
In many cases, the opening range breakout determines the further price direction. When the price breaks out of the range, there is a big chance that the price action will continue in the same direction. Therefore, in most opening range trading strategies traders use the range breakout to set entry points on the chart.
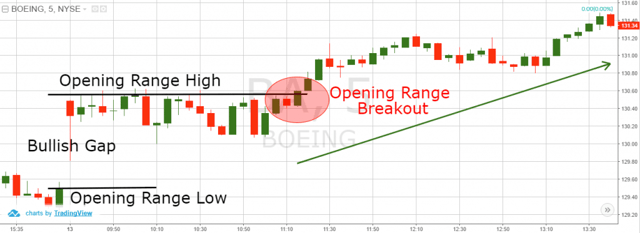
Opening Range Breakout Calculator
This is a real opening range breakout. The size of the range is marked with the black horizontal lines on the chart. The range breakout is located in the red circle. As you see, the price shoots up after the opening range breakout.
Opening Range Trading Strategy
The stock market opening bell is a specific on-chart phenomenon, which can be approached in many ways. Now that we have covered the technical structure, let’s dig further into the opening range breakout strategies.
Strategy #1 – Early Morning Range Breakout
This is probably the most popular opening range success formula. The early morning range breakout puts emphasis on the size of the gap, as well as on the breakthrough of its low/high. According to this strategy, when we identify the boundaries of the gap, we need to trade in the direction of the breakout.
One point to note is that breakouts later in the day should be taken with caution. Light volume and skilled professionals is a cocktail I don’t like to partake in often. Therefore, pull the trigger when the retail/inexperienced traders are most prevalent, which is in the morning.
You should always use a stop loss order when trading the early morning range breakout. The right place for your stop loss would be the mid-point of the gap.
You should stay in your trades for a minimum price move equal to the size of the gap. However, if the price shows symptoms to continue the trend, you can use price action rules to extend your gains or to exit a position earlier than expected.
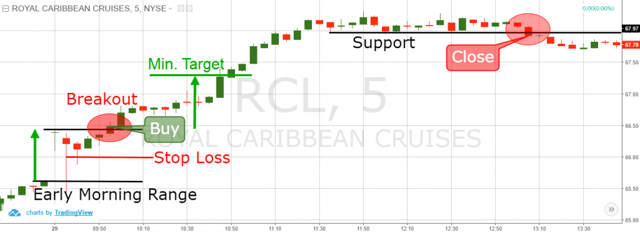
Early Morning Range Breakout
The picture above shows the 5-minute chart of Royal Caribbean, which exhibited an early morning range breakout.
The opening range is outlined with the two parallel lines at the beginning of the chart. We enter a long trade when the price breaks the upper level of the early morning range. The stop loss of this trade should be located in the middle of the range.
Ten periods after we buy RCL, the price completes the minimum target which equals the size of the opening range. However, the price increase continues and we stay in the trade for further gains.
Suddenly, the price begins to trade in a horizontal fashion. We close the trade when the price action closes a candle through this support level.
Strategy #2 – Chart Pattern Gap Pullback Buy
The gap pullback buy is another popular approach for trading the opening range. However, this trading strategy is applied only to bullish gaps.
When you spot a bullish gap on the chart, the price could immediately start moving contrary to the direction of the gap.
This phenomenon is called a pullback. Since the gap is bullish, the pullback would be bearish.
The purpose of this trading strategy is to predict the end of the pullback.
The tricky part is knowing when to purchase the pullback. This can be done in many ways; however, a simple way to get your feet wet is to look for a reversal candlestick pattern.
After identifying a reversal, wait for confirmation and then enter a long trade.
When you use this opening range trading strategy, you should use a stop loss order to protect your trades. The proper location of your stop is below the lowest point of the opening range.
You should hold your trade for a minimum bullish move equal to the size of the gap.
Now, let’s do a review of a gap pullback trading opportunity:
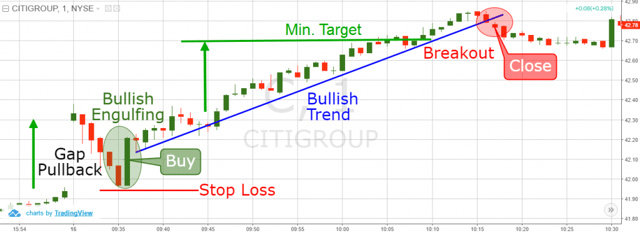
Gap Pullback
You are looking at the 1-minute chart of Citigroup from June 15, 2016. The image illustrates a gap pullback trading strategy.
As you see the chart starts with a bullish gap. Shortly after the open, the price begins to pull back to the previous days’ close.
Then Citi prints a strong bullish candle, which engulfs the previous two, and we take a long position with the anticipating the stock will make a new high.
Full disclosure, buying the pullback is my least favorite of the three strategies. This is because the high has not been broken.
I can’t tell you how many times I have purchased the pullback only to have the stock rollover or go flat.
For me, when I buy the high or sell the low, I at least know something is supposed to happen. Reason being, there could be many traders that are looking for a certain level after a pullback, but it’s really anyone’s guess which level will trigger a move higher.
However, everyone and I mean everyone knows the high and low for the day.
As you can see on the chart, Citigroup began a nice steady climb higher and got close to breaching $43.
We exited the trade when the price action breaks its blue bullish trend line.
Strategy #3 – Gap Reversal
The gap reversal is another way to approach the opening morning range of a stock. We have a gap reversal when the price creates a gap, but the range is broken in the opposite direction.
If the gap is bullish, we have a gap reversal when the price breaks the lower level of the opening range. If the gap is bearish, we have a gap reversal when the price breaks the upper level of the opening range.
The trigger of a trade with this opening range trading method is the breakout through the opposite level. When you open your gap reversal trade you should also secure the trade with a stop loss order. The right place for your gap reversal stop loss is again the mid-point of the opening range.
When you trade the gap reversal, you should hold the trade for a minimum price move equal to the size of the gap. You could hold the trade further if the trend continues in your favor but again will need to have a clear method for knowing when to exit the trade (i.e. time and sales).
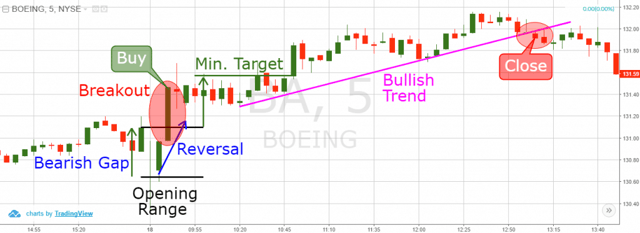
Gap Reversal
Above is the 5-minute opening range breakout of Boeing from April 18, 2016.
The image starts with a bearish gap. However, the price action suddenly reverses and breaks the opening range upwards. This creates a gap reversal pattern on the chart. Therefore, we buy BA the moment the stock makes a new high.
On a side note, these are one of my favorite setups. Essentially, you have a pullback below the low of the current day, which looks pretty bearish on the chart.
Only to have price perform a “v” move up through the high. This sort of quick impulsive move higher traps the weak bears.
The price breaks may be short-lived, but if you are able to time your exit, you can make some pretty consistent gains.
Time and Sales – My Way Out
My preferred off-chart indicator for trading opening ranges is the time and sales or the tape. The action is fast of course, but the time and sales is the one tool that keeps me “safe” in the morning. Every other indicator, leading or lagging, just isn’t fast enough and I would tend to get myself in some tricky spots.
The point I’m trying to make is that you need some method or indicator for knowing when to get out of the trade. The mid-point stop is just a last resort, but it should never be your only option.
Conclusion
- To measure the size of the range you should take the distance between the:
- High/low of the closing candle in the previous trading session
- High/low of the opening candle in the new trading session
- The most important part of the opening range trading is the breakout from the opening range.
- When the stock breaks the opening range upwards, the price action is likely to continue in a bullish direction
- When the stock breaks the opening range downwards, the price action is expected to continue in a bearish direction.
- Three of the most popular opening range trading strategies are:
- Early Morning Range Breakout – Enter a trade when the price action breaks out of the opening range. Open the trade in the direction of the breakout. Place a stop loss in the middle of the opening range. Stay in the trade for a minimum price move equal to the size of the morning gap.
- Chart Pattern Gap Pullback Buy – Open a trade when the price action finishes a pullback after the creation of a bullish gap. Confirm the end of the pullback with a chart pattern or a candle pattern. Open a long trade – in the direction of the expected pullback reversal. Place a stop loss below the bottom at the end of the pullback. Stay in the trade for a price move equal to the size of the gap, starting from the upper level of the opening range.
- Chart Pattern Gap Reversal – Open a trade when the price action breaks the level of the opening range, which is opposite to the direction of the gap. Open the trade in the direction of the breakout. Place a stop loss order in the middle of the opening range. Stay in the trade at least until the price action completes a move equal to the size of the gap.


 Trading Strategies


