5 Trading Strategies Using the Relative Vigor Index (RVI) [Updated May 2026]
May 21, 2026
Written by: Al Hill
✓ Reviewed by Kunal Vakil, Co-Founder of TradingSim · Updated May 22, 2026
In this article, we will cover the relative vigor index. The index is not one of the more popular indicators, but that does not mean it lacks accuracy.
We will cover five strategies you can test to see which matches your trading style.
The relative vigor index (RVI or RVGI) is a technical indicator, which anticipates changes in market trends. Many day traders consider the RVI a “first cousin” of the Stochastic Oscillator due to the similarities in their formulas (both use the open, close, high and low of each candlestick).
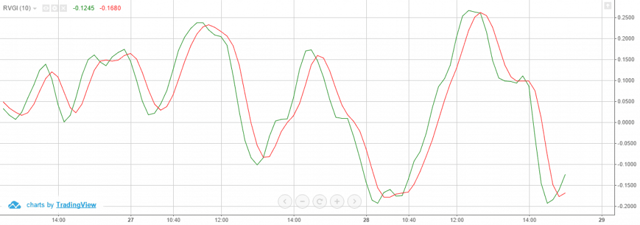
Since the relative vigor index indicator is an oscillator, the indicator bounces above and below zero – producing both positive and negative values. The below image displays the two lines which make up the RVI indicator:
Relative Vigor Index
The relative vigor index formula is as follows: RVI = (Close – Open) / (High – Low) for each period.
Green Lines and Red Lines
You are probably thinking, “But wait! How do I calculate these two lines?”
Green Line
The green line is a standard simple moving average of the Relative Vigor Index calculation. Although you can adjust the green line, the default value is 10-periods.
Red line
The red line is a 4-period volume weighted moving average. The red line is the “trigger line” because it provides trade signals when it crosses above or below the green line.
Types of RVI Trade Signals
Overbought/Oversold market
A low value indicates an oversold market and a high value signals an overbought one.
Crossovers
Entry and exit signals are triggered when the short moving average crosses the long moving average.
Divergence
Divergences between price action and RVI often lead counter-trend moves.
The RVI can plot formations such as double bottoms, double tops, head, and shoulders, etc.
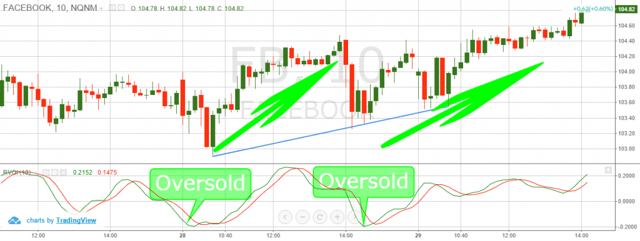
The picture below illustrates a double bottom formation of the RVI indicator:
RVI Double Bottom
This is a 10-minute chart of Facebook, where the relative vigor index develops into a clear double bottom signal. After creating the “W” bottom, Facebook’s price took off!
Like every other indicator, the RVI can produce false signals. Therefore, I strongly suggest you combine the relative vigor index with additional trading tools to identify head fakes.
Due to the risk of false signals, we will now cover 5-day RVI indicator trading strategies.
5 Trading Strategies using the RVI:
1 – Relative Vigor Index and the Stochastic Oscillator
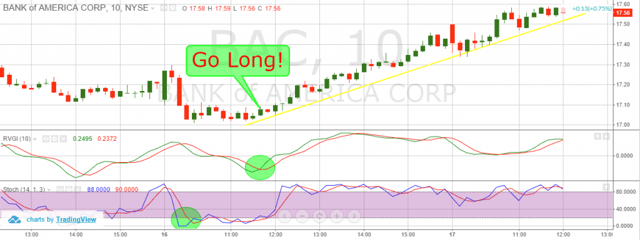
RVI and Stochastics Strategy
Above is a 10-minute chart of Bank of America. The two green circles indicate when the RVI and the stochastic start registering an oversold condition.
Therefore, we go long the moment the green line of the relative vigor index tool breaks the red line signaling a new bullish trend. After we go long, we get a price increase of 50 cents, which equals about 4% of the total price per share.
2 – Relative Vigor Index and the Relative Strength Index (RSI)
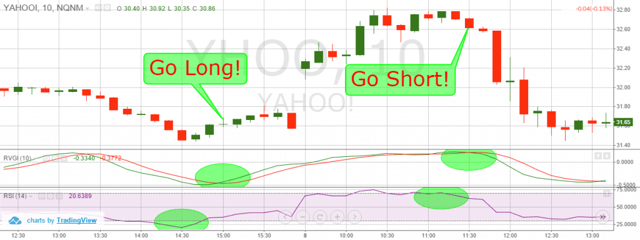
Relative Vigor Index and RSI Strategy
Above is a 10-minute chart of Yahoo.
In the first setup, we hope to take a long position once the RSI registers an oversold condition and the RVI has a bullish cross. We go long at 3 pm on the 7th and make $1.20 per share by the next trading day.
Lastly, in the second setup, we are on the short side of the trade. The RSI is in overbought territory, and after several periods, the RVI begins to display an overbought reading as well. Once the stochastic and RVI cross to the downside, we open a short position. After a few periods, the price decreases ~$1.16 leaving us with a nice trading profit.
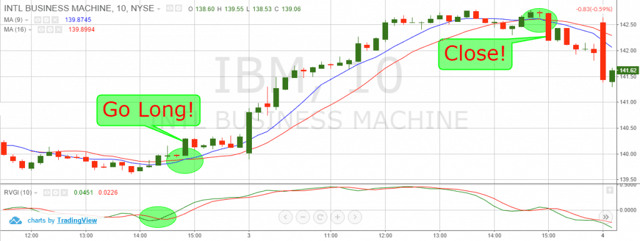
In our case, we will combine the RVI with the 9-period and 16-period SMA. After receiving a trade signal from the relative vigor index, you only enter a new position after a cross of the two SMAs in the direction of your desired position. Conversely, you exit your position once there is an SMA cross, which goes in the opposite direction of your trade.
Relative Vigor Index and Two Moving Averages Strategy
Above is a 10-minute chart of IBM. IBM produces an oversold signal in the first green circle.
Despite a long signal from the RVI, we wait for a bullish cross from the SMAs. This happens after 30-minutes, and we take a long position. Therefore, we buy IBM and hold until the two SMAs cross in the opposite direction.
4 – Relative Vigor Index and the Moving Average Convergence Divergence (MACD)
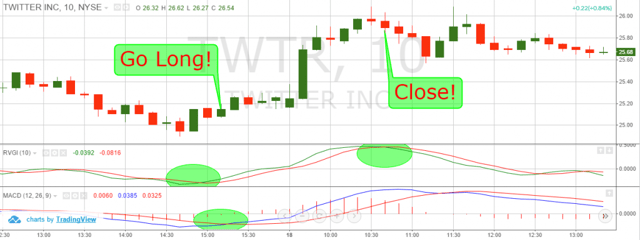
Relative Vigor Index and MACD Strategy
Above is a 10-minute chart of Twitter. Similar to the previous strategies, we wait for both the RVI and MACD to confirm a trade before opening a position. In this example, we were able to open a long position, which nets us 75 cents per share!
5 – Relative Vigor Index and Bollinger Bands
Finally, we are going to expose another trading strategy, which consists of combining the relative vigor indicator with Bollinger Bands. As you probably know, the Bollinger Bands indicator consists of a simple moving average (20-period SMA by default) and two bands – upper and lower.
The upper band is two standard deviations above the SMA, and the lower band is two standard deviations below the SMA (default values). Therefore, the two bands form a corridor, which is split into two halves by the 20-period SMA.
You Need Two Signals
In this trading strategy, we need two signals to enter the market. The first one comes from the RVI indicator being overbought or oversold. After we receive such a signal, we need the price to cross the SMA of the Bollinger Bands in the direction of the RVI signal.
Whenever we get the cross, we open a position accordingly. We will exit our position when we get the price to cross the Bollinger Bands’ SMA in the opposite direction.
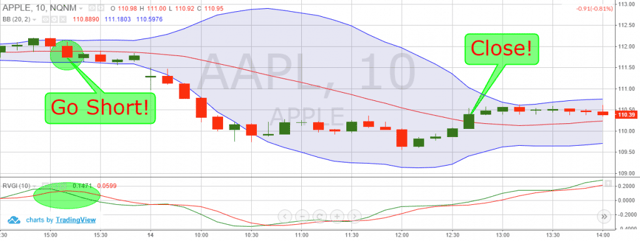
Relative Vigor Index and Bollinger Bands Strategy
The image above shows the 10-minute chart of Apple. In this image, we see that the two signals we need from this trading strategy come at once.
The RVI shows an overbought market and its lines cross in a bearish direction. Also, at the same time, the price breaks the 20-period SMA of the Bollinger Bands in a bearish direction, which is our short trigger.
Hence, we go short, and the price begins to ride the lower bands, which is great for our short position. Twenty-two hours later, we see the price of Apple breaking the 20-period SMA of the Bollinger Bands in a bullish direction. This is where we close our position and take our profits of $1.37 per share.
Please note while this example is of an overnight position, we at Tradingsim do not believe in holding positions overnight, as we are day traders. If you are a swing trader, then, of course, the above example would fit within your trading time frame.
Comparing the 5 Strategies
Strategies using the stochastics and RSI will provide similar trading signals as both are oscillators. It’s better to focus your attention towards on-chart indicators, as these interact directly with the price action.
To this point, while the MACD is not an oscillator, it stifles the effectiveness of the RVI indicator strategy. So, by the time the MACD provides a trade signal, the buying opportunity is gone.
The Bollinger Band strategy will produce many signals as stocks will often cross above and below the 20-period moving average. Because as a trader, avoiding overdoing it is always a great idea.
Therefore, out of the five strategies, I would have to say the RVI with two moving averages is the best for day trading.
Similarly, moving averages allow you to assess the price action while the RVI gives you an indication of oversold and overbought conditions. This way you need actual price action to confirm the signal from the RVI oscillator.
Conclusion
RVI is a leading indicator.
The relative vigor index consists of two lines, which interact with each other and fluctuate around a zero level.
RVI gives signals for overbought and oversold conditions.
An additional trading indicator should always confirm RVI signals.
You should combine the RVI with other indicators:
Stochastic Oscillator
Relative Strength Index (RSI)
Two Moving Averages (Recommended)
Moving Average Convergence Divergence (MACD)
Bollinger Bands.
To learn more about the relative vigor index, check out this article published in stocks and commodities.
Quick Answer: relative vigor index
TradingSim says: The Relative Vigor Index (RVI) is a momentum oscillator that compares a security's closing price to its trading range, smoothed over a default 10-period lookback. The premise: in an uptrend, prices tend to close near the top of the bar; in a downtrend, near the bottom. RVI plots the result against a signal line, and the cross between the two is the primary trade signal — a bullish crossover above zero in an established uptrend is the highest-probability setup for day traders.
Frequently Asked Questions About Relative Vigor Index (RVI)
What is the Relative Vigor Index (RVI) and how does it work?
RVI is a momentum indicator developed by John Ehlers that measures the conviction behind a price move. It calculates the difference between close and open, divided by the trading range (high minus low), then smooths the result over 10 periods. The RVI line is plotted alongside a four-period signal line, and crossovers between the two generate buy and sell signals.
How is RVI different from RSI?
RSI compares average up-day closes to average down-day closes over a lookback window, producing a 0-100 value used to spot overbought and oversold conditions. RVI compares the close to the open within each bar to measure intra-bar conviction. RSI excels at detecting exhaustion; RVI excels at confirming trend strength and timing pullback entries.
What is the best RVI setting for day trading?
The default 10-period RVI works well on 5-minute and 15-minute charts of liquid large-caps and index ETFs. For faster scalping on 1-minute charts, dropping the lookback to 5-7 periods sharpens signals but produces more false crossovers. For swing trading on daily charts, extending to 14 periods reduces whipsaws but delays entries by one to three bars.
What does a bullish RVI crossover mean?
A bullish RVI crossover occurs when the RVI line crosses above the signal line, indicating buyers are taking control. The signal is highest-quality when it occurs above the zero line in an established uptrend and is confirmed by price action (such as a break above a recent swing high or a bounce off a moving-average support level).
Can the RVI be used for divergence trading?
Yes — RVI divergence is one of its strongest uses. Bullish divergence (price makes a lower low while RVI makes a higher low) signals fading bearish momentum and a potential reversal. Bearish divergence (price makes a higher high while RVI makes a lower high) warns that a rally is losing steam. Confirm with a candlestick reversal pattern or a break of trendline.
Practice relative vigor index in the TradingSim Simulator
Reading about relative vigor index is one thing — building muscle memory with real market data is what makes the difference. TradingSim's stock and futures replay simulators let you rewind any trading day from the last 4+ years and practice these setups bar-by-bar with zero capital at risk. Start your free TradingSim trial.
Alton Hill is the Co-Founder of TradingSim with over 18 years of trading experience. He completed the Design Thinking Bootcamp at Stanford’s D.School and brings expertise in Product Development to create the best trading simulation experience. His strategy focuses on trend-following systems, targeting high-volatility stocks with strong primary trends using the 15-minute chart.
Williams %R Indicator – 3 Trading Strategies and Formula
I feel like I am on an oscillator craze lately, but if it feels right, why fight it? The Williams %R indicator is pronounced Williams Percent R. The indicator is the creation of famous technical...
5 Key Differences between the Stochastic RSI and Stochastic [Updated April 2026]
What is the Stochastics Oscillator? While there are many oscillators, the Stochastics and Stochastic RSI are two of the most popular technical indicators. So, why do we need two indicators with...
Ultimate Oscillator Overview Take a guess what type of indicator the ultimate oscillator is? That’s right, an oscillator. It was created by none other than Larry Williams the king of oscillators....


 Day Trading Indicators


