You can be up handily in one second and then give all of your profits shortly thereafter. [1]
As a trader, you need a clean way to understand when a stock is trending and when things have taken a turn for the worse. When analyzing the market, what better way to gauge the trend than a moving average?
First off, the indicator is literally on the chart, so you do not have to scan anywhere else on your screen, and secondly, it is simple to understand. If the price is moving in a direction over ‘x’ periods, then the moving average will follow that trend.
Unlike other indicators, which require you to perform additional analysis, the moving average is clean and to the point. In day trading, having the ability to make quick decisions without performing manual calculations can make the difference between leaving the day a winner or losing money.
Should You Go Long or Short?
Moving averages provide you a simple yet effective way for knowing what side of the market you should be trading. [2]
If the stock is currently trading below a moving average then you clearly should only take on a short position; conversely, if the stock is trending higher then you should enter long. When a stock is below its 10-period moving average under no circumstances will I take a long position?
I know, I know, these concepts are basic, which is the beauty of it all – day trading should be easy. I have yet to meet a trader who can effectively make money using a million indicators.
Chapter 2: Best Moving Average for Day Trading
Best Moving Average for Day Trading
There is literally an infinite number of moving averages.
There are weighted, simple, and exponential and to make matters more complicated you can select the period of your choice.
With so many options, how do you know which is the best moving average for day trading? Since you are clearly reading this article for an answer, I will share my little secret.
For day trading breakouts in the morning, the best moving average is the 10-period simple moving average. This is where, as you are reading this article, you ask the question why?
Well, it is simple; first, if you are day trading breakouts in the morning you want to use a shorter period for your average. The reason is, you need to track price action closely, as breakouts will likely fail. Please do yourself a favor and never place a 50-period or 200-period moving average on a 5-minute chart.
Once you start using larger periods this is a clear sign you are uncomfortable with the idea of active trading.
Now, back to why the best moving average for day trading is the 10-period moving average; it is one of the most popular moving average periods. The other one that comes in a close second is the 20-period. Again, the problem with the 20-period moving average is it is too large for trading breakouts.
The 10-period moving average gives you enough room to allow your stock to trend, but it also does not make you so comfortable that you give away profits.
In the next section, we will cover how I use the 10-period simple moving average to enter a trade.
Chapter 3: How to Use Moving Averages to Enter a Trade
So, let me say this upfront, I do not use the 10-period simple moving average to enter any trades.
I know that is completely contradictory to the title of this section. If you buy the break of a moving average it may feel finite; however, stocks constantly backtest their moving averages.
Now that the curveball is out of the way, let us dig into how I enter a trade. Below are my rules for trading breakouts in the morning:
Stock must be greater than 10 dollars
Greater than 40,000 shares traded every 5 minutes
Less than 2% from its moving average
Volatility has to be solid enough to hit my 1.62% profit target
Cannot have several bars that are 2% in range (high to low)
I must open the trade between 9:50 am and 10:10 am
I need to exit the trade no later than 12:00 noon
Close the trade out if the stock closes above or below its 10-period moving average after 11 am
If you are like me these rules sound great, but you need a visual.
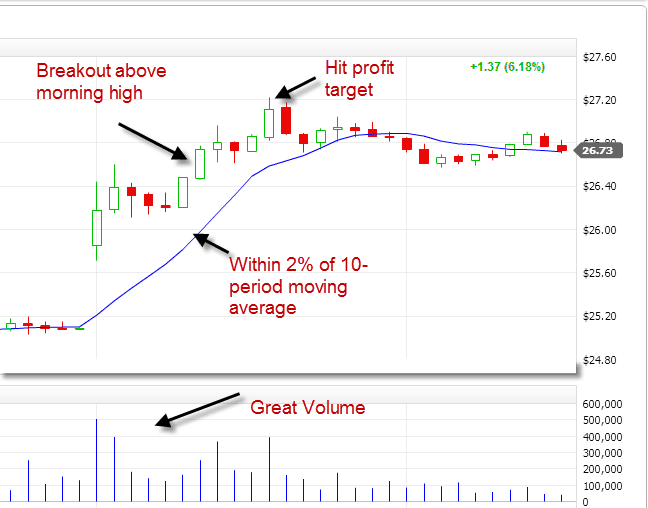
The above is a day trading breakout example of First Solar from March 6, 2013.
The stock had a nice breakout with volume. As you can see, the stock had well over 40,000 shares per 5-minute bar, jumped the morning high before 10:10 am, and was within 2% of the 10-period moving average.
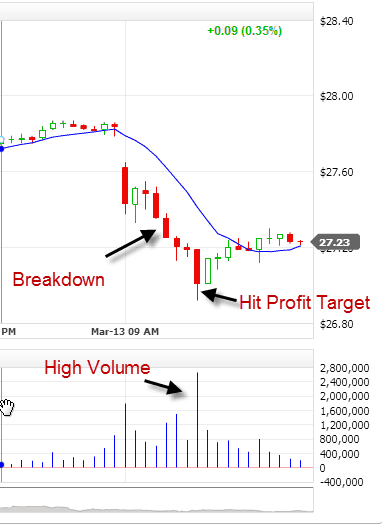
Here is one more example, but this time it is on the short side of the trade.
This is a chart of Facebook from March 13, 2013. Notice how the stock broke the morning low on the 9:50 bar and then shot straight down. The volume also began to accelerate as the stock moved in the desired direction until reaching the profit target.
This is literally the only setup I trade. I believe in keeping things simple and doing what makes money. As stated earlier in this article, notice how the simple moving average keeps you on the right side of the market and how it gives you a roadmap for exiting the trade.
Chapter 4: How to use Moving Averages to Stop out of a Trade
In theory, when buying a breakout, you will enter the trade above the 10-period moving average. This will give you the wiggle room you need if the stock does not break hard in your desired direction. The above chart is the classic breakout example but let me give you a few that are not so clean.
The above chart is of First Solar (FSLR) from April 10, 2013.
The stock had a false breakdown in the morning then snapped back to the 10-period moving average. This is your first sign that you have an issue because the stock did not move in your desired direction.
If your stock fails, the 10-period MA will provide a fail-safe to gauge the strength of the trend.
Continuing, FSLR stopped in its tracks at the 10-period moving average and reversed down again only to trade sideways. At this point, you know that something is wrong; however, you wait until the stock closes above the moving average because you never know how things will go.
Gray Zone
That last section felt clear and finite, didn’t it? What you will realize once you start active trading is that stocks will break a respective moving average intra-bar, only to wick and close back above the average.
Sitting through this type of price action is extremely difficult, especially if you are sitting on profits.
The other gray area is when a stock closes below a moving average but only by a thin margin. The stock may even hover right beneath the average, only to rise from the ashes.
Chapter 5: How to use Moving Averages to Determine if a Trade is Working
You must know when to hold them and when to fold them.
If we could all apply this logic to business and life, we would all be much further ahead.
In the market, I think we naturally look for the perfect example of our trade setup. The majority of trades will neither work nor fail, they will just underperform.
Since I trade breakouts, the moving average must always trend in one direction. For me I know it’s time to raise the caution flag once the 10-period moving average goes flat or the stock violates the moving average prior to 11 am.
Did you catch the method that you can use to determine if things are working out?
If not, it’s time.
From the moment you put on a trade, it’s like a car depreciating once you pull off the lot. The longer you are in a position and the trade is not going your way, the greater the likelihood things are going to go against your trading plan.
To this point, you need to have some idea of how you expect the price to interact with the moving average after a certain amount of time in the trade and based on the time of day if active trading.
Chapter 6: Why I Do Not Ride the Average
Why I Do Not Ride the Average
Before I get 100 emails blasting me for this one, let me qualify the title of this section.
Yes, you can make money allowing your stock to trade higher if it does not close below the moving average. For me, I was never able to make consistent sizable profits with this approach to day trading.
There was a time before automated trading systems where stocks moved in a linear fashion. However, now with the complex trading algorithms and large hedge funds in the marketplace, stocks move in erratic patterns. Couple that with the fact you are day trading breakouts, it only compounds the increased volatility you will face.
So, to avoid the back and forth present in the market, I would have a 1.62% profit target. On average, the stock would have a sharp pullback and I would give back most of my gains.
To counter this scenario, once my stock hit a certain profit target I would start using a 5-period moving average to try to lock in more profits. So, it was either give the stock room and give back most of my gains or tighten the stop only to be closed out practically immediately.
It was a vicious cycle and I advise you to avoid this type of behavior. I did not begin to make money in the market until I started selling into strength and covering into weakness. I discovered that when I would scan the market looking for examples of my trade setups I would naturally gravitate towards trades that were perfect in every sense: clean breakouts, high volume, and b-line moves of 4% to 7%.
So, on some Level, I was training my subconscious to expect these types of gains on every trade. This sort of thinking led to a lot of frustration and countless hours of analysis.
Where I ultimately landed, and you can see from the trading rules I laid out in this article, was to look at all my historical trades and see how much profit I had at the peak of my positions. I noticed on average I had a two percent profit at some point during the trade. I took that a step further and reduced it down to the golden ratio of 1.618 or 1.62% to increase my odds.
Chapter 7: Why You Need to Use the Default Moving Average
Technical analysis is clearly my method of choice when it comes to trading the markets. I am a firm believer in the Richard Wyckoff method for technical analysis and he preached about not asking for tips or looking at the news. [3]
Everything you need to know about your trade is on the chart. One thing I tried to do early on in my trading career was to outsmart the market. I would take for example the 10-period simple moving average and say to myself a simple moving average is not sophisticated enough.
This would lead me down the path of using something more colorful like a double exponential moving average and I would take it a step further and displace it by “x” periods.
If you are reading this and have no idea, what I am talking about then great for you.
What I was doing in my own mind with the double exponential moving average and a few other peculiar technical indicators was to create a toolset of custom indicators to trade the market. I believed that if I were looking at the market from a different perspective it would provide me the edge I needed to be successful.
Well, this could not have been the furthest thing from the truth. The market is nothing more than the manifestation of people’s hopes and dreams. To that point, if the majority of people are using the simple moving average, then you need to do the same, so you can see the market through the eyes of your opponent.
Sun Tzu says it best in the Art of War, “If you know the enemy and know yourself, you need not fear the result of a hundred battles. If you know yourself but not the enemy, for every victory gained you will also suffer a defeat.” [4]
Chapter 8: Common Mistakes when using Moving Averages
Common Mistakes when using Moving Averages
Using Moving Average Crossovers to Enter a Trade
Many moving average traders will use the crossing of the averages as a decision point for a trade and not the price and volume action on the chart.
For example, how many times have you heard someone say the 5-period just crossed above the 10-period moving average, so should we buy?
This action by itself means very little. Think about it, what significance does this hold for the stock? Don’t you think a moving average crossover of the 5-period and 10-period will mean very different things for different symbols?
I remember at one point I wrote easy language code for moving average crossovers in TradeStation. Then I ran backtests on a few stocks and the results were stellar. I was sure I had a winning system; then the reality of the market set in.
The stocks began to trade in different patterns and the two moving averages I was using began to provide false signals. Hence, I abandoned that system and moved more towards the price and volume parameters detailed earlier in this article.
Not Using Popular Moving Averages
Not using popular moving averages is a sure way to fail. What is the point of looking at something if you are the only one watching? I am not going to beat this one to death since we covered it earlier in this article.
Using more than One Moving Average
As a day trader, when working with breakouts you really want to limit the number of indicators you have on your monitor. I have seen traders with up to 5 averages on their screen at once.
In my opinion, it is better to be a master of one moving average than an apprentice of them all. If you don’t, believe me, there was a study published in August 2010 by Ben Marshall, Rochester Cahan, and Jared Cahan that provided a detailed analysis of trading profits when using indicators.
The study stated: “While we cannot rule out the possibility that these trading rules compliment other market timing techniques or that trading rules we do not test are profitable, we do show that over 5,000 trading rules do not add value beyond what may be expected by chance when used in isolation during the time period we consider.” [5]
I am not ready to throw out all the technical indicators in my toolbox based on this study, but don’t try to turn your indicators into the genie in a bottle.
Constantly changing the Moving Averages You Use
There was one point where I tried the 10-period moving average for a few weeks, then I switched over to the 20-period, then I started to displace the moving averages. This trial and error period went on for months. At the end of it, how do you think my results turned out?
Do yourself a favor, pick one moving average and stick with it. Over time, you will begin to develop a keen eye for how to interpret the market. Remember, the end game is not about being right, but more about knowing how to read the market.
Chapter 9: Using Moving Averages to Gauge the Risk of Your Trade
A 10-period moving average is a great tool for knowing when a stock fits my risk profile. The most I am willing to lose on any trade is 2% and as you read earlier in this article I will use the 10-period moving average as a means for stopping out of my trade.
One thing I like to do is to see how far my stock is currently trading from its 10-period simple moving average. If my stock is 4% above the moving average, I will not take the long trade. I cannot go into the position knowing that I am already exposing myself to 4% worth of risk, which is double my maximum pain point.
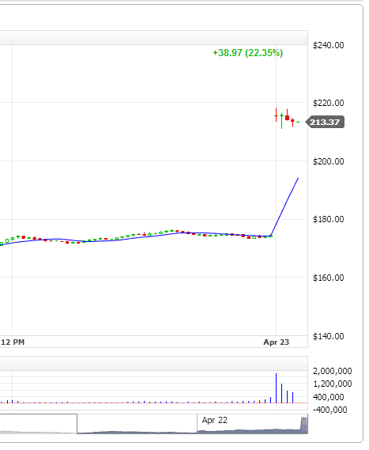
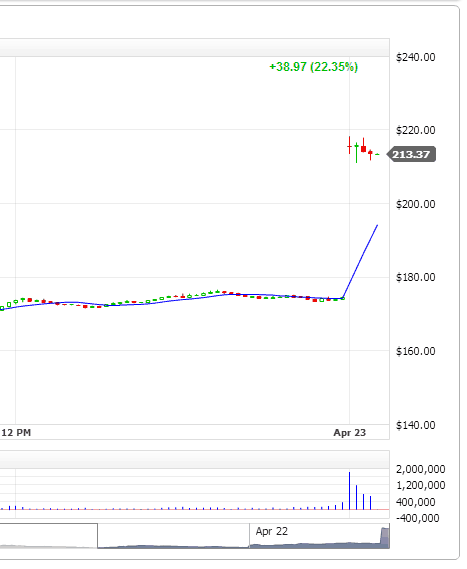
The below chart example is from NFLX on April 23, 2013. Some of you may look at this chart and think wow, the stock is up 22% and on high volume.
For me when I look at Netflix all I see is a stock trading a full six percent away from its simple moving average when it was time for me to pull the trigger. Since I use the moving average as my guidepost for stopping out of a trade this is too much risk for me to enter a new position.
The next time you look at the chart, try thinking of the simple moving average as a risk meter and not just a lagging indicator.
Chapter 10: Putting it all together
Let’s talk through an entire trade so we can see how to effectively day trade using a 10-period SMA.
The first thing you need to determine is the level of volatility you trade to establish your profit targets. Remember your appetite for volatility has to be in direct proportion to your profit target.
For a deeper dive into volatility please read the article – how to trade volatility. For me, I trade breakouts on a 5-minute period with high volatility.
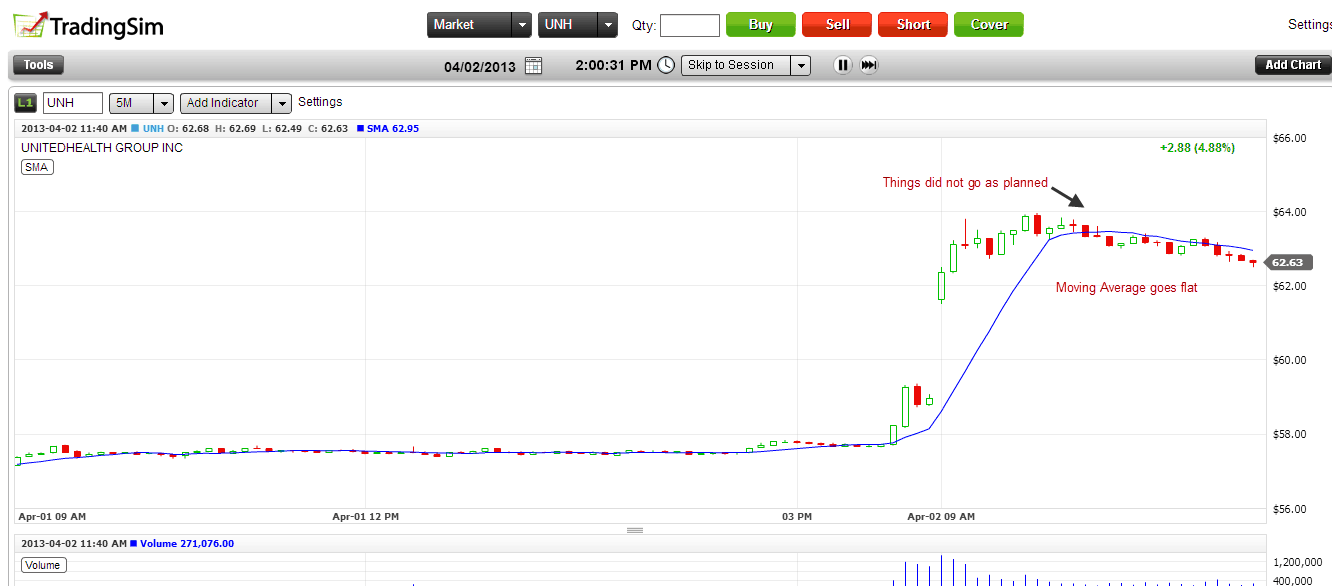
The above chart of United Health Group from 4/2/2013 has all the right ingredients for my system. There is heavy volume on the breakout.
The stock gives very little back on the first retracement and breaks the high between the time of 9:50 am and 10:10 am. Lastly, the moving average is within 2% of the stock price, so I can give the stock some wiggle room. Based on this setup should I pull the trigger?
The answer is yes, but I am purposely showing you a trade that has failed. There are enough blogs out there pumping systems and strategies that work flawlessly.
Breakouts will fail most of the time. You are simply trying to limit your risk and capitalize on your gains. In this example, the stock broke out to new highs and then reversed and turned flat. Once you saw the candlesticks start to float sideways and the 10-period moving average roll over, it was time to start planning your exit strategy.
True to my breakout methodology, I would have waited until 11 am and since the stock was slightly under the 10-period moving average, I would have exited the position with approximately a one percent loss.
Chapter 11: Bitcoin and Moving Averages
Bitcoin is very popular amongst retail traders due to the violent swings over the last few years.
After reading this article, a logical approach could be to apply the 10-period or 20-period moving average to your analysis of the market.
Let me stop you right there before things go too far.
Bitcoin Moving Averages
We have covered how to exit trades using moving averages. We stated that you can hold the position until there is a break.
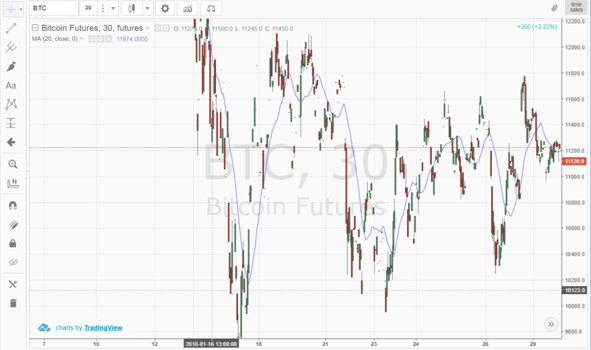
Now, that rule of thumb sounds like it makes perfect sense until you review the Bitcoin chart above.
Above is a 30-minute chart of Bitcoin with my beloved 20-period moving average. Notice how Bitcoin has no respect for the 20-period moving average. You will see this same sort of disregard for the averages if you trade volatile penny stocks.
The futures contract breaks the 20-period with ease to the upside and downside without blinking an eye.
I thought about doing a quick case study with trade results, but it’s clear the moving average has little to bear on the price movement.
If the 20-period moving average doesn’t work, does this mean Bitcoin can never work with moving averages?
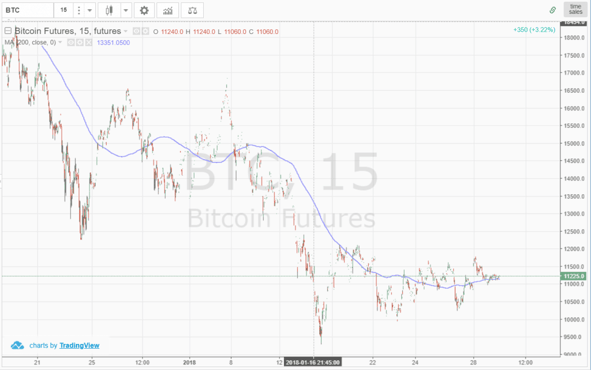
Bitcoin Moving Average – 200 Moving Average
We lowered the time frame from thirty minutes to 15 minutes for more data and increased the moving average time frame from 20 to 200.
As you can see there are fewer breaks, but I don’t know if the moving average is really doing a better job of informing you have how price will react.
Or is Bitcoin so volatile, we could have one of my kids draw a line over the chart and it would give the appearance of managing price?
In a recent article published by The Street.com, author Jim Iuorio observed that “Since the last week of June, bitcoin has had four multi-day price swings greater than 30 percent.” [6]
The point of showing the bitcoin chart is to illustrate at times moving averages add little to no value on a chart. Going back to what I mentioned earlier in this article, once you get up to the 200-day moving average, it’s time to pack it in.
Chapter 12: How to Identify the Best Moving Average for Yourself
If the 20-period moving average doesn’t feel right to you, then let’s walk through the process you can use to identify the best moving average for your trading preference.
What is your preferred time frame?
For me, I live and breathe via my 5-minute charts. What is your primary time frame for your trading (5-minute, daily, weekly)?
Simple Moving Averages or Exponential Moving Averages?
As mentioned in this article, I prefer to use the simple moving average. For me, the SMA slows down the already busy action of day trading.
Now for those of you that like the moving average to react to price closely, then EMA is likely a better option for your trading style.
What Types of Securities Do You Trade?
If you are trading low volatility stocks, you can honestly trade with any of the major moving averages (10, 20, 50).
I say this with confidence because the price action will likely respect each average. When I say respect, I don’t mean it will completely bend at the moving average’s will but rather price will at least pause before moving decisively.
If you are trading securities with high volatility like Bitcoin, you will need to focus on one or two moving averages that can advise you on the trend direction of the security.
Remember, you will want to place less emphasis on moving averages if the security is volatile.
What Time of Day do you Trade?
For me, I trade in the morning, so my time period for the moving average will be shorter (10-period simple moving average).
If you are trading during the middle of the day or if you look at daily charts, you will want to focus on a higher time frame for your average.
This will allow you to focus on major moves and not get distracted with slight the head fake price moves that occur during the middle of the day.
In Summary
Moving averages are not the holy grail of trading. If used properly, moving averages can help you gauge when to exit a trade and help limit your risk.
The rest my friend is up to you and how well you are able to analyze the market. Remember that less is more and to focus on becoming a master of one moving average.
How I Use the 20-Period Moving Average When Day Trading
There are a number of moving averages talked about across the web, so it’s pretty clear that moving averages are an important part of technical analysis. One of the most popular averages is the...
Exponential Moving Average – 5 Simple Trading Strategies
Technical analysis boils down to predicting the future directional movement by studying past market behavior. Well, you will not likely find a better way to assess the market than the exponential...
20 Moving Average Pullback Strategy: Great For Short Term Trades
The 20 moving average is an extremely popular indicator in the world of trading. It’s use is ubiquitous no matter the time frame or the type of stock, commodity, currency, or other issue being...


 Day Trading Indicators


