What is the Hull Moving Average?
In addition to the numerous moving averages in the technical analysis realm, the Hull MA is popular amongst some day traders, as the indicator attempts to give an accurate signal by eliminating lags and improving the smoothness of the line.
Alan Hull developed this moving average indicator and hence it’s called the Hull MA.
Now, let’s dissect how the Hull moving average is calculated.
The Hull MA involves the weighted moving average (WMA) in its calculation.
First, calculate the WMA with period (n / 2) and multiply this by 2. Remember ‘n’ is the time period configurable based on the trader’s requirement. The default setting in Tradingsim is 9.
Second, calculate the WMA for period “n” and subtract it from the first step. Thirdly, calculate the weighted moving average with period sqrt (n) using the data from the second step. You can take a look at the below formula:
Hull MA= WMA (2*WMA (n/2) − WMA (n)), sqrt (n))
Below is the Hull MA plotted on a 5-minute chart of Apple from July 6th, 2016. The Hull MA is highlighted in blue color.
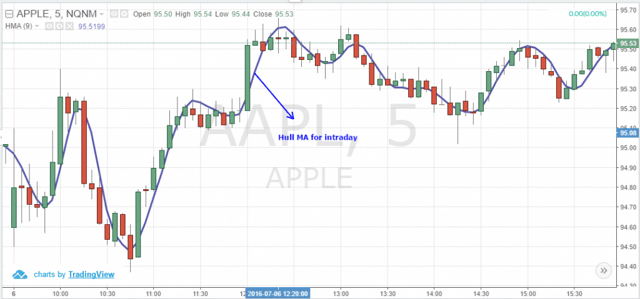
Hull MA
How does the Hull MA identify trends?
Like any other moving average, if the HMA is rising along with price, it indicates an uptrend. Conversely, if the HMA is falling along with price, it indicates a downtrend.
Traders can take a long position if prices are rising and the HMA is trending upwards. However, traders can take a short position, if the prevailing trend is falling.
In fact, the Hull MA works well as a reversal filter, and, therefore, its exit signals are more reliable at times than the entry.
Going back to the Apple chart from July 6th, 2016, we have highlighted the upward trend in blue and the downward trend in red.
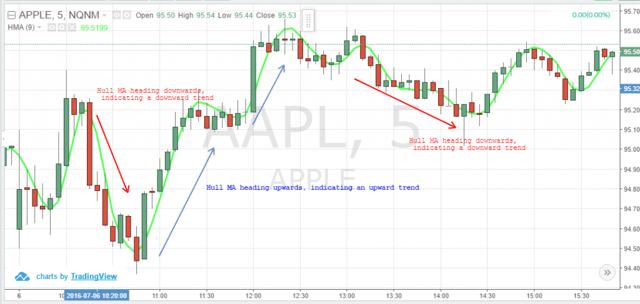
Hull MA and Trends
Apart from the basic indication of identifying the trend lines, the Hull moving average crossovers with two different time periods can also give the uptrend/downtrend signals.
To identify the uptrend, the fast HMA needs to cross the slower one to the upside.
For identifying downtrends, the fast HMA needs to cross the slower one to the downside.
For instance, I have taken the HMA (9) (the fast indicator) and HMA (18) (the slow indicator) for Affiliated Managers Group, Inc. (NYSE:AMG). The HMA (9) indicator is highlighted in blue while the HMA (18) indicator is highlighted in green.
In the below chart, you can see that I have highlighted entry signals when the HMA (9) crosses above the HMA (18). On the other hand, you can the short/sell signals as well, where the HMA (9) crossed below the HMA (18).
How the Hull MA is a better indicator when compared to the simple and exponential moving averages?
The simple moving average (SMA), exponential moving averages (EMA) and weighted moving averages (WMA) are all lag when identifying the trend. Conversely, the Hull MA is a step above these indicators as it is more dynamic in regards to price activity while maintaining a smooth curve.
The below example shows the difference between the Hull MA and the simple moving average.
This is a five minute Microsoft chart from July 5th, 2016. I have selected the Hull MA which is reflected in the top left corner of the chart. The default setting is 9 periods for the Hull MA. The Hull MA is highlighted by the blue line, while the simple moving average (with a default setting of 9 periods) is highlighted with the red line.
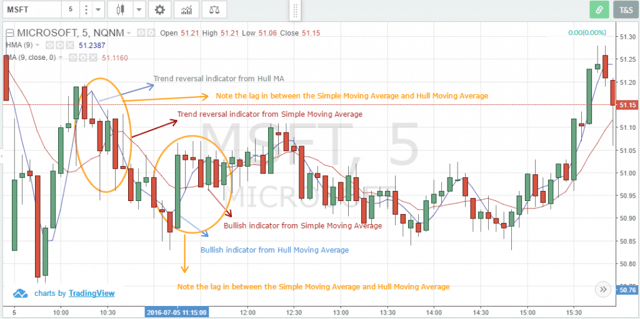
Hull MA and Reversals
As you can see in the above chart, the Hull MA is providing signals well ahead as compared to the simple moving average indicator. Traders can leverage this gap for greater profits as compared to the other moving average indicator.
Now, let’s compare the Hull MA with the exponential moving average and weighted moving averages (WMA). For the same five minute Microsoft chart from July 5th, 2016, I have highlighted the exponential moving average indicator in pink and the weighted moving average in green.
In the below image you can see on how the Hull MA gives a firm sell signal as compared to the exponential moving average and weighted moving averages, on the left side of the image. You can see the lag between the Hull MA versus EMA and WMA. This indicates that traders can gain a better success rate with the Hull MA versus the EMA and WMA.
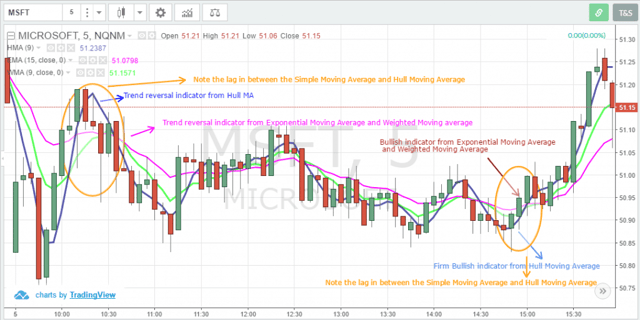
Hull MA and Simple Moving Average
Before we get too excited about the Hull MA, it has its own shortcomings and gives false entries in range bound markets. In sideways markets it is difficult to identify a slope, so tread lightly.
Hull Moving Average Trading Strategies to be used along with the MACD
Now, let’s combine the Hull MA along with another popular indicator, the MACD.
I have again taken Apple’s 5-minute chart from July 6th with an HMA (9). I have also added the MACD indicator with a default setting.
If you notice in the bottom left side, we received an uptrend signal from the HMA. Within a few minutes, we have a MACD crossover, indicating a “Buy” signal. Accordingly, we take a position at $94.90.
Around the mid-session, we see that the HMA (9) is choppy with a downtrend. After some time, we get a sell crossover signal from the MACD, indicating that it is time to exit our position. Accordingly, we close our position at over $95.46.
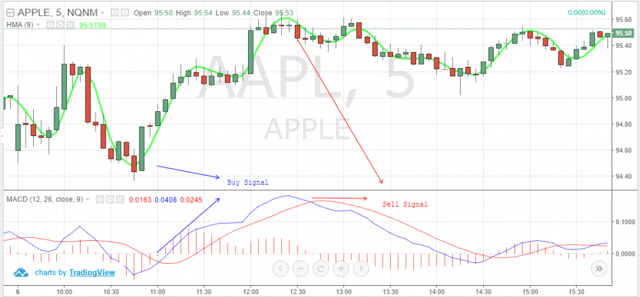
Hull MA and MACD
Hull Moving Average Trading Strategy to be used along with the Volume and Stochastic RSI
Below is a two-minute chart of Alibaba Group Holding Ltd (NYSE:BABA) from July 7th, 2016.
I have highlighted the trading action up to the mid-day session, to help focus in on the trade signals.
In the early hours of the trading session, the stochastic RSI indicated a buy signal as you can see with the crossover. I have highlighted this in blue.
This indicator is supported by the ongoing buy volumes (highlighted in green) from the volumes indicator. After a few minutes, we can see the Hull MA trend changing upwards confirming our trend. Accordingly, we take a position near $77.83.
After trading over half an hour, we get a sell crossover from the stochastic RSI coupled with huge selling activity as indicated from the volumes (note the huge red bar). This downtrend is confirmed with the Hull MA, and accordingly, we close our long position at $78.33.
We again get a buy signal from the stochastic RSI confirmed with the Hull MA and volumes. Hence we again take a long position at $78.03. After over half an hour, we get a sell signal from the stochastic RSI, while the Hull MA and volumes confirm this after a few minutes. We cover our long position at over $78.70.
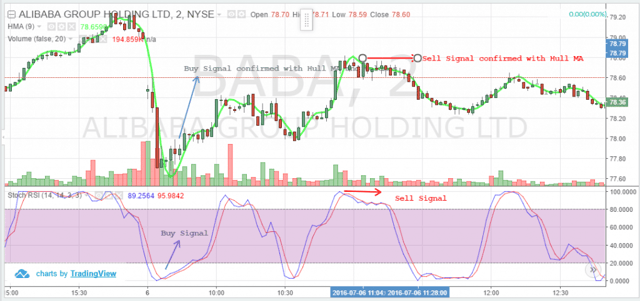
Hull MA and Stochastic RSI
Conclusion
- The Hull MA is an indicator that tries to give an accurate signal by eliminating lags and improve the smoothness of price activity.
- The Hull MA can provide more accurate signals if combined with other technical indicators to validate price movement.


 Basics of Stock Trading
