Trend lines are one of the oldest technical indicators. Trend line indicators are used to identify and confirm existing price trends. They can be drawn on any time frame and can be used on any price chart. The key to using trend line indicators effectively is the methodology used to draw them on the price chart. Simply put, a trend line is a straight line that connects two or more swing points. A positive sloping line is defined as an uptrend. A negative sloping line is defined as a downtrend.
Positive Trend Line Charting Example
A positive uptrend is when there are higher highs and higher lows on the price chart. If the price is contained by this upward sloping line, the trend is assumed to be intact. This means that there is more demand than supply as the price heads higher. Many new traders make the mistake of assuming that a break of a trend line is going to lead to a steep sell off. While this is potentially true, traders will have to assess the volume and price action on the break of the trend line. Often times the price will have a false break of the trend line only to continue higher. One method for trading positive trend lines is to buy each successful test of the trend line at support.

Uptrend Line
Downtrend Line Charting Example
A negative downtrend is when there are lower highs and lower lows on the price chart. If the price is contained by this downward sloping line, the trend is assumed to be intact. This means that there is more supply than demand as the price heads lower. Traders should look to short each failed test of the downtrend line.
Down Trend Line
Slope of Trend Line
The slope of the trend line is a key component of analyzing the strength of the primary trend. Newbie traders will often look at a steep incline and use the first break of the line to sell short the security. The steeper the slope of the line, the less reliable is the signal generated from the break of that line. When going counter to the primary trend, you will want to wait for both the trend line and the previous swing point to be broken. Remember, that a trend line break does not equal a new trend, it could just mean the slope of the trend is slowing up.
Slope
How to Draw Trend Lines
A valid trend line is comprised of two or more points on a price chart connected by a straight line. The origination point of the trend line is not necessarily the high or low point of the price move. A proper trend line starts from when the actual move begins. The two points on the trend line should be between two pivots. These swing points should have enough price movement to construct a trend line capable of containing the trend. The last component of a trend line is the third point, which is contained by the trend line constructed by the first two points. Trend lines are like every other indicator in that it may not work as intended for every security. So, if you find that the price continually breaks the trend line, do not force it on the chart. Use some other indicator to gauge the direction and trend of the security.
Elliott Wave Theory
Now that you have a basic understanding of trend lines, let’s take a look at things from a different angle.
Decades ago an accountant named Ralph Nelson Elliott discovered a pattern in the chaotic price moves. He found out that when the price is trending, it follows specific waves. According to the Elliott Wave theory, the price completes five impulsive waves when trending, followed by three corrective moves. This is why he named the pattern “The 5-3 Rule”.
Imagine we have a bullish trend. This means the price will have five specific waves on the way up. Three of these waves are in the direction of the primary trend, while the other two waves are corrections.
The three trending waves are called impulses and the other two waves are corrections. So, we have a total of five moves on the way up. When the price interrupts the general trend, we are likely to see a bigger corrective move.
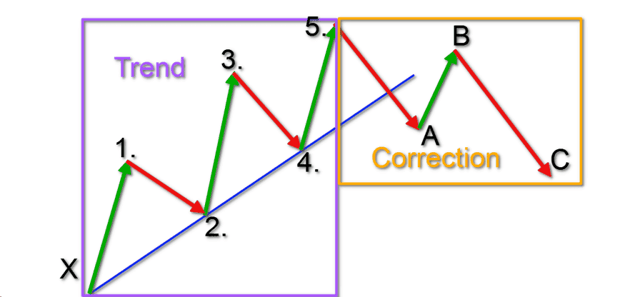
Although this might sound a bit confusing, I assure you that it is simpler than it sounds. For this reason, I have prepared a simple sketch of the Elliott Wave theory.
Elliott Wave Theory
This is an easy-to-understand sketch showing you the 5-3 Elliott Wave Principle. It is not that hard to understand after all, right?
Notice that the sketch is separated in two parts – the general trend and the correction. The green arrows indicate the impulse moves and the red moves indicate the corrective moves.
Since you are less frightened of the Elliott Wave principle and its meaning to trend building, I will now show you the 5-3 Elliott Wave trend line analysis formula applied to a real chart. Have a look at the image below.
5 Waves of Elliott Wave Pattern
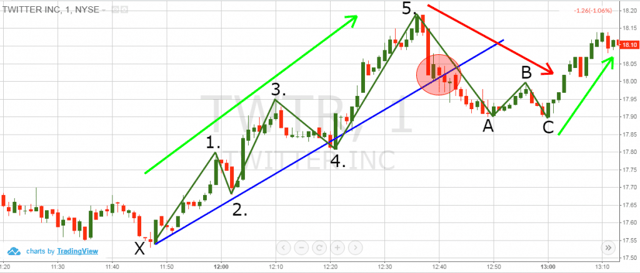
This is the 1-minute chart of Twitter from Feb 18, 2016. The chart shows you an example of the Elliott Wave theory.
We start with the trending move on the chart, which is marked with a blue bullish trend line. The five numbers on the chart indicate the five waves of the trending move:
Wave 1: This is an impulse move in the direction of the trend.
Wave 2: A small corrective move, which indicates that the bears are present.
Wave 3: This is the move traders love the most. Usually, with the bounce from the trend after move 2 comes the confirmation of the wave pattern at which point traders hop in the market.
Wave 4: Another corrective move, which takes relatively more time than the previous correction.
Wave 5: A bullish explosion, which indicates the climax of the bullish trend.
Move A: This is a move which is contrary to the trend. Notice that this move breaks the bullish trend.
Move B: This move might confuse you. The reason for this is that technically it is a correction of the correction.
Move C: This is the last move of the Elliott Wave pattern. It is opposite to the general trend and it follows the direction of the correction. In our case, this move is relatively small. However, it might get bigger in many other cases.
Notice that after the end of the 5-3 waves, we observe another strong price increase in the direction of the primary trend.
The Elliott Wave theory is a crucial part of technical price action. It gives a more detailed view of the trend lines and the expected corrections.
Fibonacci Levels in Elliott Waves
Yes, this is absolutely correct. Where do we think we are going without the good ole Fibonacci ratios?
Fibonacci levels are a crucial part of Elliott Wave theory. The reason for this is that Ralph Elliott discovered that the size of each wave responds to a specific set of psychological levels. For this reason, you should always have the Fibonacci retracement levels at hand when you create a trend line. The table below will show you the expected size of each price wave according to the Elliott Wave trend line system.
| Wave # |
Wave Size |
From Wave # |
| 1 |
N/A |
| 2 |
38.20% |
50.00% |
61.80% |
1 |
| 3 |
161.80% |
61.80% |
261.80% |
2 |
| 4 |
38.20% |
50.00% |
|
3 |
| 5 |
161.8% |
100.0% |
61.80% |
4 |
| A |
100.0% |
61.80% |
50.00% |
5 |
| B |
38.20% |
50.00% |
|
A |
| C |
161.80% |
61.80% |
50.00% |
B |
Let me now show you how to work with this table. Let’s take for example wave 3, which is considered the best wave to trade. This wave is expected to reach 261.8%, 161.8%, or 61.8% of wave 2.
Nevertheless, I would like to advise you that the market will always do what it wants to do.
Therefore, keep these ratios in mind for entry and exit targets, but do not expect the market to do what you want.
Trading With Trend Lines
We went through many informative details about the trend lines in stock trading. However, the raw information is nothing without one or two practical examples. I will now show you how to trade trend lines and impulse waves.
In order to attempt trading wave 3, we will need to observe wave 2 retracing 38.2%, 50.0%, or 61.80% of wave 1. This way we will confirm the Elliott Wave pattern and set a price target for wave 3 of a minimum price move equal to 61.8% of wave 2.
If this target is reached, we will adjust our stop loss to a tight level, in order to close the trade in case of a minimum outcome. At the same time, we will still be in the game in case of a 161.8% or 261.8% price move. If the price then completes 161.8%, we will adjust our stop again. This way we can set our target on the eventual 261.8% level and we will be protected in case of a contrary move. If the price completes 261.8%, we will consider the trade 100% successful and close the trade. We will execute the same strategy for wave 5.
Let me now show you the way this strategy works.
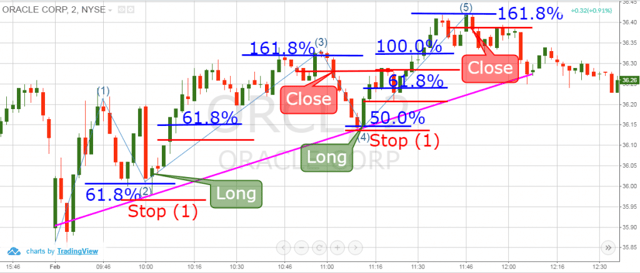
Impulsive Wave Extensions
Above you see the 2-minute chart of Oracle from Feb 1, 2016. The image illustrates the 5 waves of the Elliott Wave impulse. The blue lines respond to specific Fibonacci levels and the red lines indicate our stop-loss orders. The image shows two long trades on impulse wave 3 and impulse wave 5.
After the price completes the first impulse, the wave 2 decrease retraces 61.8% of wave 1. For this reason, we go long Oracle with the idea of riding wave 3. We put a stop-loss order right below the lower wick of the opening candle as shown on the image (Stop 1).
With the next two candles, Oracle’s stock price starts increasing, leading to wave 3. One period later, wave 3 reaches 61.8% of wave 2. This is the first target of our long trade. For this reason, we adjust our stop tighter – as shown on the image.
The price continues with a further increase and twenty periods later the price reaches the 161.8% extension of wave 2. This is the second target of this trade. Therefore, we adjust the stop loss upwards to lock in additional profits. However, this is the last increase of the price. The next two candles are bearish and Oracle hits our stop loss.
In this trade we manage to catch a price increase of $0.28 (28 cents). This equals a profit of 0.77% for one hour of work. Wave 3 is completed and we managed to hit two targets in our trade. However, the third target was not completed and our adjusted stop loss closed our trade.
The decrease, which hits our stop loss, is actually the beginning of wave 4. This is a corrective wave. Seven periods after wave 4 begins, the price reaches 50.0% of the size of wave 3. A bullish bounce occurs, which indicates that the wave might be completed.
At the same time, the bottom rests on the same line, which connects the first and second swing lows. Now we have a clearly established trend line. This means that wave 5 might be on its way.
For this reason, we go long attempting to catch the eventual increase during wave 5. We put a stop-loss order right below the bottom at the beginning of the wave, as shown on the image.
Only two periods later the price completes 61.8% of wave 4. Therefore, we adjust our stop loss a bit below this level. We now have the first target of our trade completed. Ten periods later, the price reaches 100.0% of wave 4, which completes the second target of our trade. Again, we adjust the stop loss below this level in order to lock in guaranteed profits. The price continues its increase and we have the opportunity to strike for the third potential target of wave 5. Seven periods later, Oracle’s price reached 161.8% extension level of the previous wave 4. This way, we complete the third target of the trade. We adjust the stop loss again to a level below the target. One period later the price hits our stop and we close our trade.
This time we catch a $0.37 price increase. This equals a 1.02% profit, which we manage to generate for a bit more than 30 minutes.
These two trades generate a total profit equal of 1.79% in one hour and forty minutes.
No matter the types of trend lines you trade, bearish or bullish, the Elliott Wave principles can always be applied. Remember, the Elliott Wave system is an integral part of technical analysis and trend lines.
Conclusion
- Trend lines are one of the oldest and most important on-chart indicators.
- Trends are used to measure price swings.
- Uptrend lines are created when the price prints higher tops and higher bottoms.
- Downtrend lines are created when the price prints lower tops and lower bottoms.
- A break in the trend does not mean a creation of a new trend. Sometimes it means that the slope of the trend is flattening.
- We draw trend lines with connecting two or more tops or bottoms on the chart
- When the trend is bullish, we connect the bottoms of the trend.
- When the trend is bearish, we connect the tops of the trend.
- The Elliott Wave theory is a higher form of understanding trend lines.
- The Elliott Wave principle suggests that trends consist of 5 impulse waves and 3 corrective waves.
- Fibonacci Ratios are essential for measuring the size of every wave in the Elliott Wave theory.
- The best waves to trade in the Elliott Wave theory are wave 3 and wave 5.


 Day Trading Indicators


