Exponential Moving Average – 5 Simple Trading Strategies
Aug 3, 2018
Written by: Al Hill
✓ Reviewed by Kunal Vakil, Co-Founder of TradingSim · Updated Apr 1, 2026
Technical analysis boils down to predicting the future directional movement by studying past market behavior. Well, you will not likely find a better way to assess the market than the exponential moving average (EMA).
Today, we are going to take a look at how you can use exponential moving average trading strategies to analyze price charts. Many traders consider the EMA the best EMA for day trading due to its responsiveness to recent price action.
While there are a number of moving averages for day trading, you only need to learn one or two to be successful.
In this post, we will first explain at a high level what is an exponential moving average. Then we will dive into a few strategies and lastly close out with where the indicator can fail.
If you look at a chart with a simple moving average (SMA) and an exponential moving average, you won’t be able to differentiate between the two at first glance.
However, under the hood, there are key differences in terms of how they are calculated.
Let’s say you are trading the daily chart and looking at last month’s price action. Would you agree that analyzing last week’s price action will offer a better understanding of market behaving today? Would you also agree that today’s price action will likely better dictate tomorrow’s price action?
The EMA uses this very notion that traders should pay more attention to the most recent price action. Although most modern charting packages automatically calculate the EMA for you, let’s still review the formula to help increase your understanding.
How to Calculate the Exponential Moving Average?
You need to go through three steps to calculate the exponential moving average for trading any instrument.
SMA
First, we need to figure out the simple moving average. If we want to calculate the SMA of the last 10 days, we simply sum up the values of the last 10 closing prices and divide by 10.
Next, we need to figure out the weighting multiplier for the number of periods we want to calculate for the EMA.
Weighting Multiplier
The weighting multiplier is calculated with the following formula:
After calculating the SMA and weighting multiplier values, you can easily calculate the EMA with the following calculation:
EMA Formula
(Closing price-EMA(previous day)) x multiplier + EMA(previous day) [1]
Why Professional Traders Prefer Using the Exponential Moving Average?
When it comes to live trading, professional traders and quantitative analysts tend to favor the exponential moving average versus the simple moving average or weighted moving average. [2]
The simple moving average places no emphasis on recent price action, so this isn’t even a fair fight.
When calculating the weighted moving average, you have to use a consistent weight or multiplier in the formula. For example, the WMA price may decrease by 5 for every preceding candlestick to give more weight to recent activity.
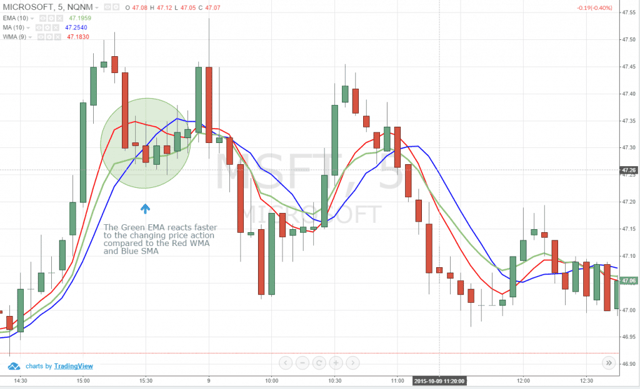
Figure 4: The EMA Reacts Faster to Changing Price Action Compared to the SMA and WMA
By contrast, when calculating the exponential moving average (EMA), the weight or multiplier is not consistent but places more importance on recent price movement.
Therefore, the exponential moving average reacts much faster to price dynamics and offers a more accurate representation of trends compared to the SMA and WMA. [3]
Trading with the Exponential Moving Average
While you can use the exponential moving average trading strategy in many ways, professional traders stick to keeping things simple.
Here are just a few ways you can trade with the indicator:
Trend Following – you essentially use the EMA to track the primary trend. If the stock does not close beyond the average – you stay in the trade.
Moving Average Crosses – by using two different exponential moving average crosses you can generate buy and/or sell signals. For example, you can have a fast average cross a slow average to trigger a trade signal.
Dynamic Support and Resistance – EMA periods like the 50 or 200 can act as support and resistance zones.
5 Exponential Moving Average Trading Strategies
Next, we will cover 5 trading strategies you can use to day trade with the exponential moving average. I will also highlight the challenges you will face when using the indicator.
#1 – Generating a Buy Signal
Figure 1: 5-Minute Chart of Ford Motor Company (NYSE:F) – October 8, 2015
In Figure 1, we have applied a green colored 13 period EMA and a red colored 21 period EMA on the 5-minute chart of Ford Motor Company (NYSE:F).
As you can see, in the far left, when the green line moved above the red line, the price soon gained bullish momentum and started to move up. If you took the trade on October 8th, you would have easily entered a long order around $14.60 per share and exited the trade near $15.10, with a 50 cent profit on each share you traded.
This is honestly the simplest strategy you will see time and time again around the web. Please note you will not turn a profit just watching averages cross. You will need to add additional indicators and chart patterns to the mix to get a winning combination.
The point of this strategy is to simply show you how buy signals can be triggered with the EMA.
#2 – Generating a Sell Signal while Trading
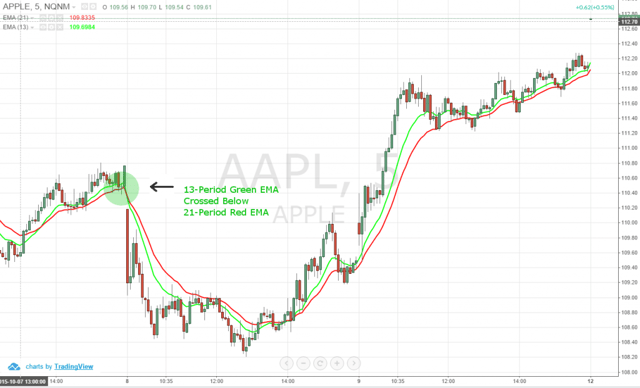
Figure 2: 5-Minute Chart of Apple Inc. (NASDAQ:AAPL) – October 8, 2015
In Figure 2, we have once again applied the 13 and 21-period exponential moving averages on a 5-minute price chart, but this time on Apple Inc (NASDAQ:AAPL).
As you can see on the second cross on the chart, when the 13-period green EMA crossed below the 21 period red EMA, the price immediately started to gain bearish momentum.
Although the volatility increased significantly, and even if you entered the market after the bar closed below the downward EMA cross, you still would have been able to short AAPL at $109.00 per share and exit near $108.20, making a quick $0.80 profit per share.
The point of illustrating this setup is to show that you can also go short. But again, please remember you need more in your trading toolkit before placing a trade solely based on this strategy.
#3 – Exponential Moving Average Example of Dynamic Support and Resistance
In Figure 1 and 2, price often pulled back towards the 13 and 21 period EMAs and then consolidated on the line.
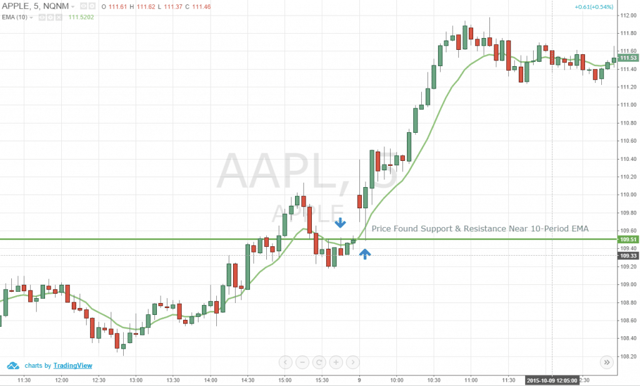
Figure 3: Price Consolidating Around the 10-Period EMA of Apple Inc 5-Minute Chart, October 9, 2015
In Figure 3, you can see that price can find both support and resistance around a major EMA level as well.
Since the EMAs are always moving up or down depending on the price action, these levels act as dynamic pivot zones to place long and short trades. However, we strongly recommend you use price action triggers to place the order instead of blindly placing limit buy or sell orders around these lines.
#4 – Using an Exponential Moving Average as a Stop for Breakouts
Breakout trading is one of the most popular strategies in the active trading world. However, one of the biggest challenges you will face trading breakouts is where to place your stops. This can get as complicated as you make it of course.
You can elect to place your stop below a key breakout level or a recent candlestick’s low. This is where the exponential moving average can come into play to provide you with a clear exit strategy.
The Setup
You want to see a stock on the verge of breaking out with a number of inside bars. This is displaying to you that the stock is building the necessary cause to breakout higher. Next look for an open close to the highs of the day if going long.
The definition of close depends on the volatility of the stock but a rule of thumb is less than 1%. Another measure you can use is to look at how close the stock is hugging the exponential moving average.
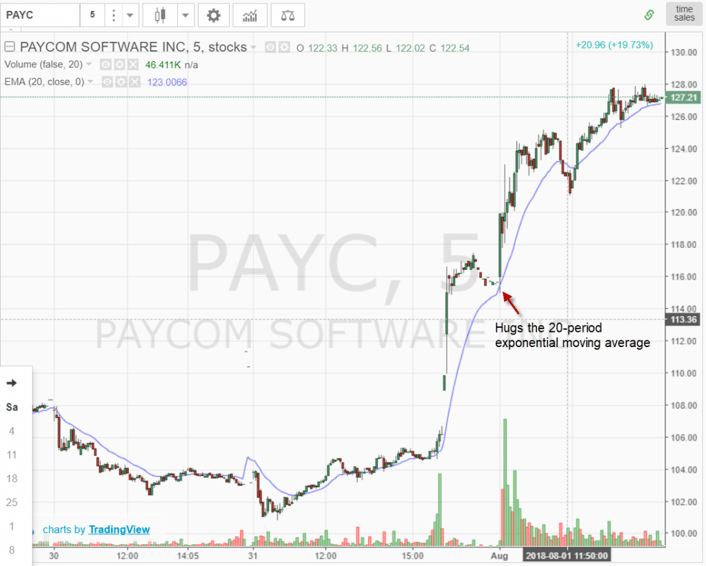
Hugging Exponential Moving Average Before Breaking Out
Notice how the stock backs into the 20-period exponential moving average and then shoots higher right on the open.
Stop Placement for Breakouts
You can use the low of the breakout candle or a close below the average to stop out the trade.
Why does this matter? Well in order to protect your account over the long haul, you need to reduce your losses. If you purchase a stock after a significant surge higher, the price will be really far from the average.
This will produce a major spread between your entry and where things are technically off the rails.
Back to the trade example, after the breakout and you see it’s a valid signal, you can then revert back to swing lows to stop out the trade or another moving average.
If you use price action or a higher period moving average, you can avoid the shakeout selloffs that occur like the one in the chart above of PAYC around the 121.50 level. Notice how price quickly found support and shot back up to hit new highs.
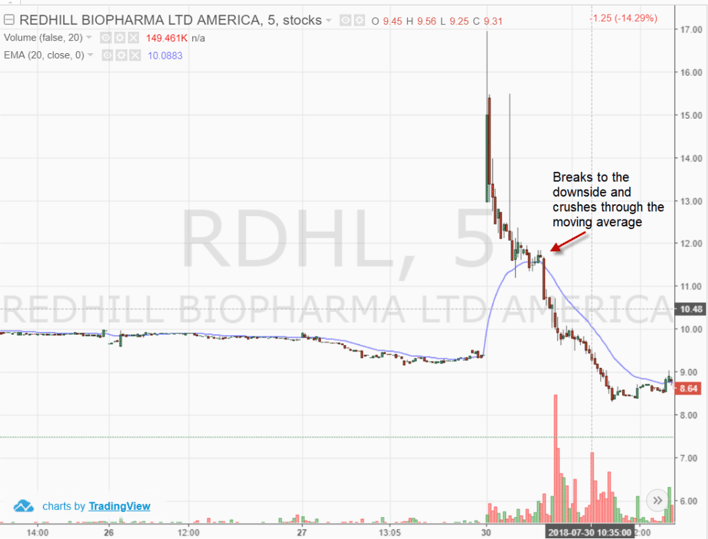
Hugging Moving Average to the Downside
This setup also works to the downside. In the above example, I wanted to grab an uncommon setup. As you can see the stock RDHL gapped up nicely on the open. Then the stock begins to roll over. Now, you could buy the weakness expecting the stock to shoot higher.
One of the key signals you would have known this would fail is that the stock never broke the high of the first candle and trended lower from the open.
As a long trader, this is a signal for you to stay away.
Next, the stock begins to test the exponential moving average repeatedly thus creating a rolling effect with the moving average. Then the stock opens and spikes through both the exponential moving average and the low of the day.
Placing Your Stop on a Short
You can now use the high of the candlestick or the moving average to stop out the initial move after entering the short position. If things go in your favor, you again can choose either another moving average or price action to stop the trade.
The reason I like using moving averages to manage the initial breakout is that it creates a great win-to-loss trade ratio, which you need to be profitable as a trader.
I don’t care how good you are, you are going to lose 30% to 40% of the time. This sort of strategy puts you back in the driver’s seat by keeping your initial stop tight, while still giving you all the upside potential on the trade.
#5 – Using Multiple Moving Averages
There are times I see traders with a ton of moving averages on one chart. Now what I would advise you to do is not use four or five averages looking for crossovers on each one to generate trade signals.
Another method you can use is to trend follow the stock with multiple averages and depending on how quickly the stock is moving, alter which moving average stops you out of the trade.
Did that just confuse you a little?
So, let’s say you are in a trade and the stock is trading sideways but has not broken any key levels. Does it make sense to then use a 5-period moving average to track price? Likely not, because you will likely enter a number of whipsaw trades.
Therefore, you would likely be better off trading with a much larger time period, so you can avoid all of the noise and wait for the price to interact with a 100 or 200 period moving average to see if bigger time frame traders can add more juice to the move.
Let me illustrate the setup to bring some clarity.
Multiple Exponential Moving Averages
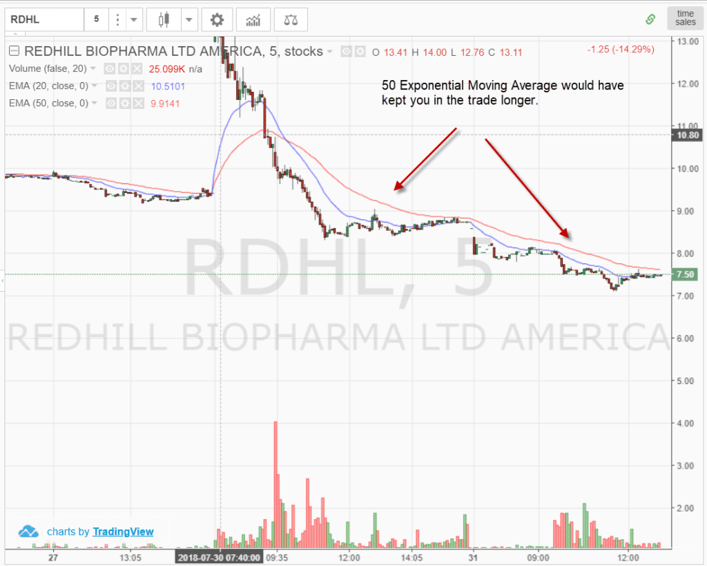
At the beginning of the selloff, the velocity of the down move was strong. The shorter 20-period average did a great job getting you in the trade on the initial break and again the speed of the immediate selloff. Then RDHL went flat from 11:45 through 3 pm.
This generated a number of false trade signals as RDHL began to violate the blue line (20 period moving average) but there was no strong counter move.
Consolidation Zones
During this consolidation period you will want to ditch the shorter EMA to avoid these head fakes. This is where you will want to turn to the longer average to keep you in the trade. In this example, we are using a 50-period exponential moving average to manage the trend.
You are likely asking the question; well how do you determine which moving average to use? The answer is somewhat involved. You will need to look at the volatility of each stock and then determine which moving average does the best job of managing the trade. This will be subjective in that you will need to make these decisions often quickly and on the fly.
Therefore, you will need to adhere to strict discipline and limit the number of averages to no more than two or three to start.
Where Exponential Moving Average Trading Strategies Can Let You Down
Every indicator has flaws and EMAs are no exception. In this section of the post, I am going to cover the most common ways the exponential moving average trading strategies can disappoint you when trading.
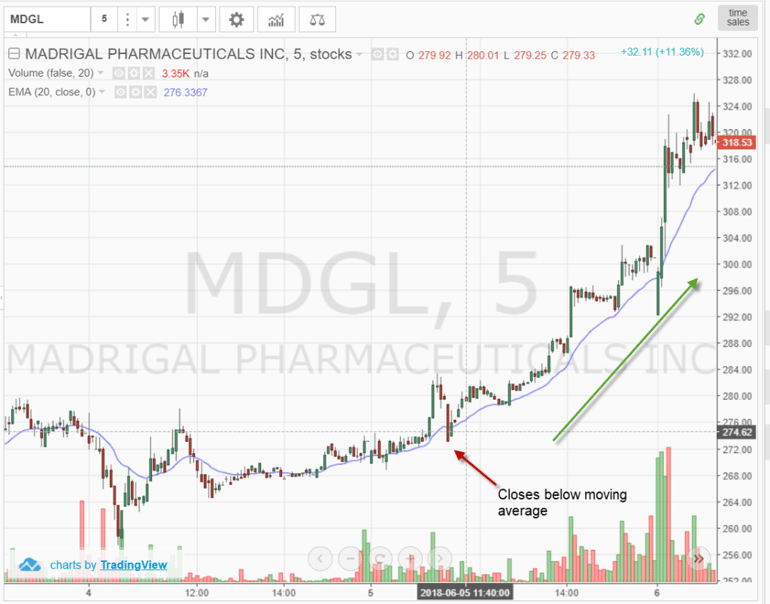
#1 – Closing Beyond the Average
This is one of the most frustrating experiences when you first start out using exponential moving average trading strategies. A stock will go in your desired direction and as expected, some sort of retracement will begin.
Then the unthinkable happens. The stock closes below the moving average.
What do you do? You close the position without hesitation and then this happens.
Notice in the above example there was one candle that closed beyond the EMA after breaking out. So, what happens next, the stock surges higher more than 10%.
Now please do not focus on the 10%, because I have personally retired from trading extremely volatile stocks.
What do you do to avoid these situations?
Well, you have two options. The first option is that you close your position and adhere to your stop loss. There is no harm in this approach as the market has little to do with charts and indicators and ultimately comes down to your discipline as a trader.
The other option is to place your stop slightly beyond the average. In this way, when the head fake shows up, you have given yourself just enough distance to avoid the light volume sucker move.
#2 – Giving Back Too Much Profit
We briefly discussed this earlier but this one just rubs me the wrong way. I know they are just paper profits and you are supposed to let things go but lost opportunity sucks.
You did everything right. You picked the right stock, managed your entry properly, did not use too much money and let your profits run. Well here comes the problem – you let things run too far with the moving average.
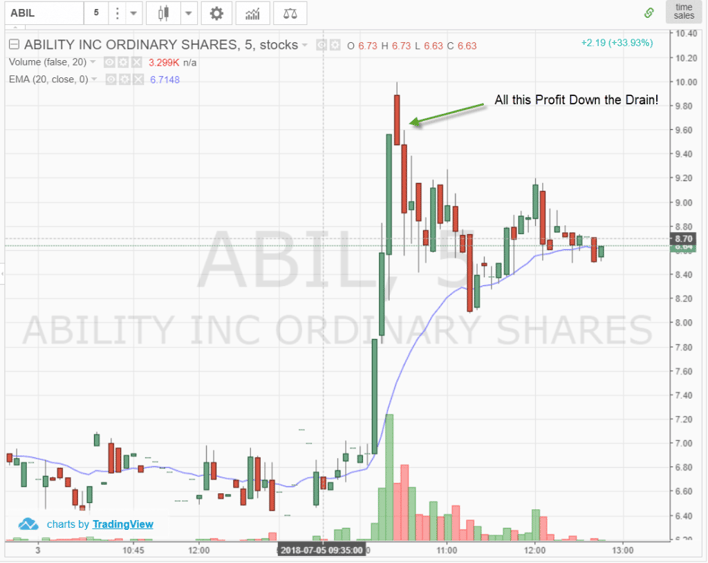
Profit Down the Drain
The above chart demonstrates why you need multiple averages on your chart if you are trading volatile issues or you need to trade on price action.
The stock ABIL ran 30% in literally 20 minutes. Now, at what point do you sell the stock? The challenge you would have faced is that if you waited on your trusted exponential moving average trading strategy, you would have given back more than half of your profits and then to add salt to the wound, closed out your trade right before a bounce.
I personally got sick and tired of finding myself in these types of situations, so I recently ditched trading low float stocks. I am able to use EMAs and other technical tools and the stocks actually adhere to them with some semblance of sanity.
So, you will need to make the decision of how you can retain profits relative to your risk appetite. But the point is not to give back the money you have earned in the market.
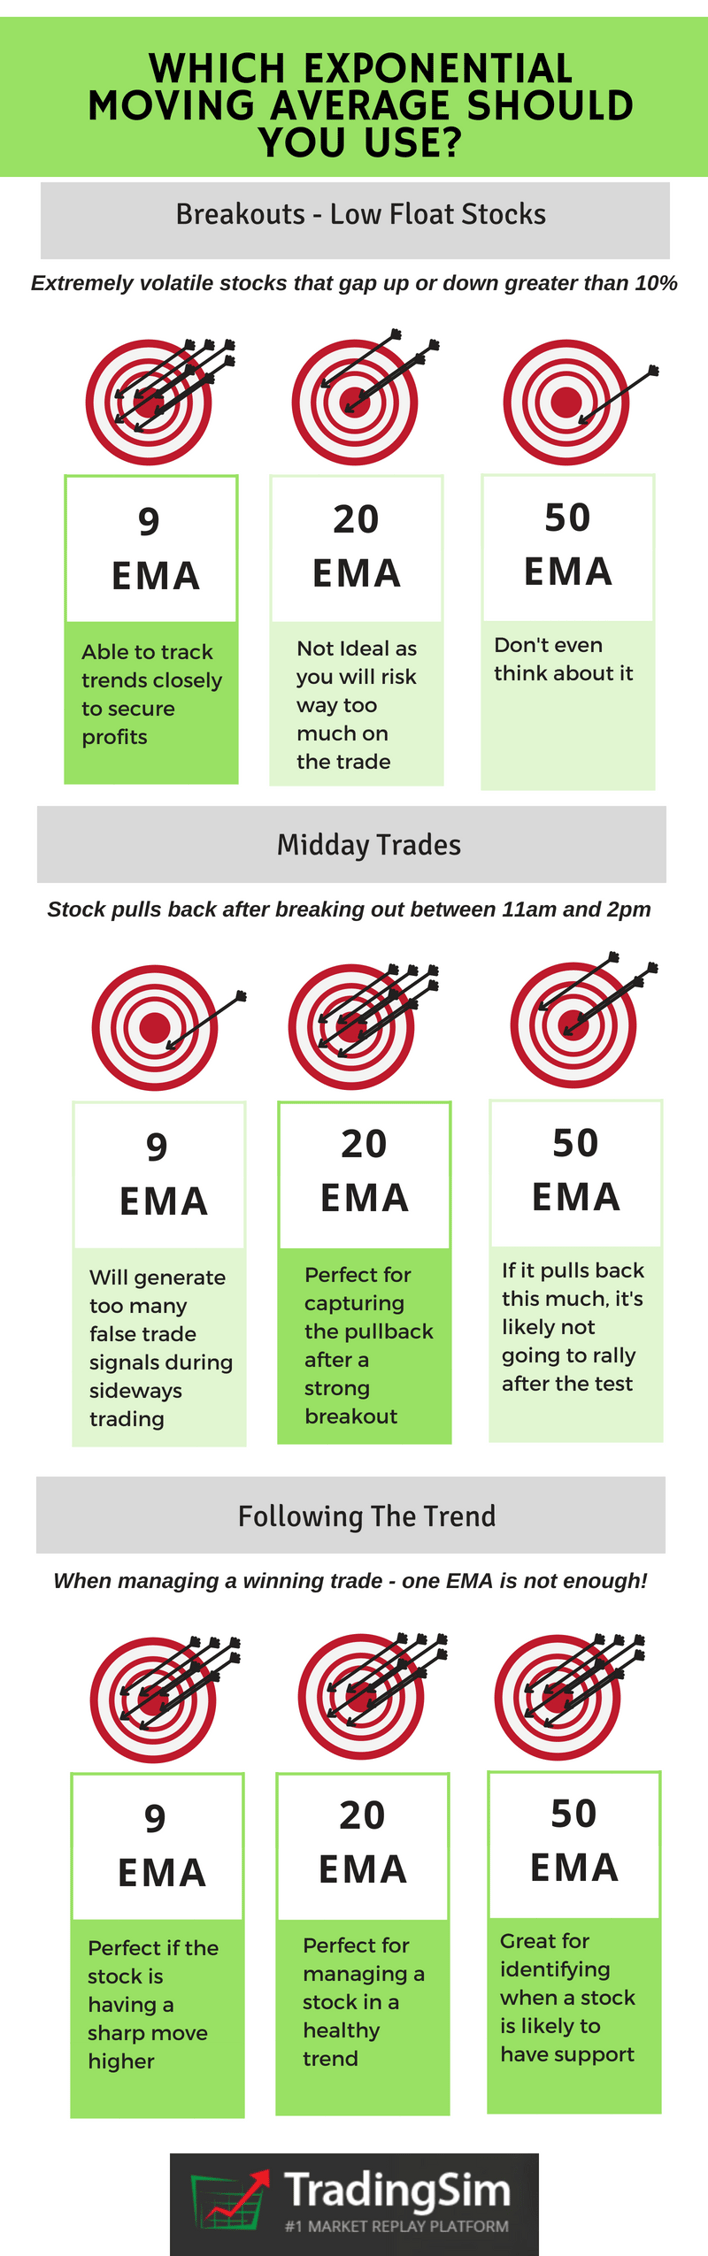
Which EMA Should You Use?
Conclusion
Exponential moving average trading strategies can be a very powerful tool in the arsenal of a savvy day trader. However, it is no holy grail.
Here are a few of the highlights you need to keep in mind:
Use multiple moving averages to manage positions and the unpredictable reality of price movement
I personally use two exponential moving averages on my charts. Not for crossover trades but to manage the volatility as my stock goes for or against me
Additional Resources
If you like slide shares, check out this awesome deck on EMAs. It’s about 11 pages and goes deeper into the formula and calculations.
To practice the exponential moving average setups listed in this post on stocks and futures, please visit our homepage at Tradingsim.com. See how we can help you achieve your trading goals.
Good luck to you as you continue to embark on your trading journey.
Alton Hill is the Co-Founder of TradingSim with over 18 years of trading experience. He completed the Design Thinking Bootcamp at Stanford’s D.School and brings expertise in Product Development to create the best trading simulation experience. His strategy focuses on trend-following systems, targeting high-volatility stocks with strong primary trends using the 15-minute chart.
TRIX – Standard Momentum Oscillator or Something More?
In this article, I will cover the TRIX indicator and the many trade signals provided by the indicator. What is the TRIX indicator? The TRIX is a momentum oscillator. [1] This means the indicator has...
Day Trading E-Mini Futures with Moving Averages Moving averages are one of the simplest and universal technical analysis indicators that are widely used across different markets and time frames....
How to Day Trade with the Least Square Moving Average
The least square moving average (LSMA) calculates the least squares regression line for the preceding time periods, thus leading to forward projections from the current period. Accordingly, the...


 – October 8, 2015")


 Day Trading Indicators


