✓ Reviewed by Kunal Vakil, Co-Founder of TradingSim · Updated Mar 31, 2026
The Harami candlestick pattern is usually considered more of a secondary candlestick pattern. These are not as powerful as the formations we went over in our Candlestick Patterns Explained article; nonetheless, they are important when reading price and volume action.
Like other candlestick patterns, the Harami can signal that a reversal may be at hand. This article will focus on these patterns and how to trade them.
When the harami candlestick pattern appears, it depicts a condition in which the market is losing its steam in the prevailing direction. The harami candlestick pattern consists of a small real body that is contained within the preceding large candles’ real body.
The preceding candle tends to be very large in relation to the other candles around it. This is important.
Harami
What does a harami tell us about the condition of the market? During a bullish move, the harami candlestick indicator tells us that strength in the previous candle is dissipating.
Bulls who have made gains in the stock may be taking a breather to either accumulate more shares or sell out of their existing positions. The large preceding candle would signify climactic conditions in that regard.
In order to understand this, compare the Harami candle above against the Three White Soldiers below:
The obvious difference here is follow through versus hesitation after that first bar.
An Exception
While the bias of the harami candlestick pattern indicates a reversal, the appearance of a harami formation in day trading can actually be quite bullish if the highs of the bar prior to the harami are broken to the upside.
This would indicate that there was, in fact, buying going on within the harami bar.
Harami Cross
The harami cross is a more powerful version of the harami. It is characterized by having a very small real body almost to the point of being a doji.
Harami Cross
The smaller the real body, the better for this formation.
The lack of a real body after a strong move in the prior candle tells us with more certainty that the previous trend is coming to an end and that a reversal may be at hand.
Bulls could not continue the upper hand and bears are putting on heavy selling pressure.
The high or low of a harami cross setup tends to provide resistance or support for any further price moves. Let’s take a look at a simple example that a day trader could have profited handsomely off of.
Harami Cross Example
As you can see, this was a perfect harami cross setup. But the important point was the fact that we saw other candlestick formations confirm what the harami cross was telling us.
Context is everything when interpreting candlestick patterns.
The double top that came in the form of a bearish engulfing candlestick gave us that added confirmation that we really did see a top of some sort.
Later, a triple top came in the form of a shooting star which also led us to believe that we could be in store for yet another pullback.
This is the power of candlesticks and using various methods to confirm each other.
Trading the Harami
Now that we have covered the basics of the harami candlestick pattern, it’s now time to dive into tradeable strategies. Please note all of the subsequent examples are on a 5-minute time frame, but the rules apply to other time frames just as well.
#1 – Trading Harami with Price Action
Since the harami candlestick pattern is a price action component in itself, we should always include price action analysis in our strategies.
Trading with price action means to rely fully on the price action on the chart. This means: no indicators, no oscillators, no moving averages, etc. You rely solely on chart patterns, candle patterns, support, resistance, and Fibonacci levels.
This is the 5-minute chart of Facebook from Sep 29, 2015. On the chart, you will see many colorful lines illustrating different price action patterns.
Harami + Price Action Trading
The Harami
First, we start with the red circle at the beginning of the chart. This is a 100% Harami candle! Yet, we do not enter the market, because the next set of candles do not validate a reversal.
We get one tiny red candle and the next one is a strong bullish candlestick. However, after the big green candle that follows, we get a second tiny red candle.
Notice how its body is contained by the bigger bullish candle. It is a bearish Harami!
Confirmation
In addition, with the next two red candles we confirm a Three Black Crows candle pattern, shown in the green circle. This is when we sell Facebook short and begin to follow the price action.
Within the orange lines, you will see a consolidation, which looks like a bearish pennant. Suddenly, Facebook’s price breaks the pennant to the downside and thus we continue to hold our short position.
Harami + Price Action Trading
Temporary Resistance
The further decrease in price then creates a bottom, marked with a green line. Then, we see a resistance level develop – the blue line. These are our next support and resistance levels for Facebook.
If the price breaks the support, we hold our position. If the price breaks the resistance, we exit the trade – literally that simple!
The price breaks the green support and we continue holding our short position. The new bottom after the decrease is now marked with a yellow line.
Note that the price retraces to the blue resistance level and then bounces back. Did you notice that we now have two tops on the same line and two bottoms on the same line? This is how we draw our bearish channel.
Capitulation
The price breaks the yellow support in a bearish direction giving us the confidence to hold our short position.
Harami + Price Action Trading
The price then drops to the lower level of the channel and starts to form a bottom. This looks like a regular correction, doesn’t it?
However, the blue lines at the end of the chart show how the price confirms a double bottom pattern. The double bottom is an early indication that price is likely to stabilize and lead to a potential rally.
The Exit
On that token, the next price increase confirms the double bottom pattern and the price closes outside of the downtrend channel, which has held the price down the entire trading day. At this point, the writing is on the wall and we exit our short position.
This short trade with Facebook brings us a profit of $3.30 per share for about 5 hours of work. What a great trade!
#2 – Trading Harami with a Fast EMA and Fibonacci Levels
This time, we will combine the Harami candle chart pattern with an exponential moving average and Fibonacci levels.
When you spot a Harami candlestick pattern, the key here is to use the moving average to set an entry point.
If the price moves in your favor, follow the retracement with the Fibonacci levels. Similarly, close the position when the price breaks a key Fibonacci support level or when the exponential moving average is broken in the opposite direction of the primary trend.
Harami + Fast EMA + Fibonacci Levels
This is a 5-minute chart of Apple from Nov 19, 2015. I am using a 5-period EMA for this example.
The first black line shows the overall bullish trend. At the top, we spot a bearish Harami candlestick pattern, which leads us to place the Fibonacci levels on the chart.
Confirmation
Two candles later, Apple’s price breaks the 5-period EMA downwards. This is when we go short.
Notice that there is definitely a strong support around the 23.6% Fibonacci level (the shaded red to green area of the chart). However, the price doesn’t close above the EMA with its full body.
For this reason, we hold our trade.
Capitulation and Exit
Eventually, Apple breaks 23.6% and keeps decreasing. A new drop to the 38.2% Fibonacci level appears (the bottom of the green shaded area). This is exactly when we close our position.
The reason for this is that we see a hammer candle after the price touches 38.2%. This gives us a sign to exit the position. Otherwise, we could hold until the price closes above the EMA.
This trade brought us a profit of $.77 cents per share in less than an hour.
#3 – Trading Harami with a Fast Oscillator
Since the Harami is a reversal pattern, we need a way to measure the likelihood of successful signal to reduce the noise. This is where a fast oscillator can be of great assistance in terms of trade validation.
Oscillators Explained
In daytrading, a fast oscillator can give more signals than the slower ones, so focus on these.
If you use the money flow or the price oscillator, the chance to match a Harami with an overbought/oversold signal is minimal. The stochastic oscillator on the other hand is great for trading haramis.
If you have an uptrend and you get a bearish harami candle, try confirming this signal with the stochastic. In this case, you will need an overbought signal from the stochastic.
Confirmation
Once you receive this additional signal, open a trade – a short position in our case. Then you can stay in the market until you get a contrary signal from the oscillator at the other end of the trade.
Let’s now see how this strategy works with the help of the stochastic oscillator:
Harami + Fast Oscillator
This is the 5-minute chart of Citigroup from Nov 19, 2015.
After a steady price increase, a bearish harami develops which is shown in the green circle on the chart. At the same time, the stochastic at the bottom of the chart has already been in the overbought area for about 7 periods.
This gives us a short signal.
Now that we are short Citigroup, we wait for an opposite signal from the stochastic. 5 periods later, the blue stochastic line hops into the oversold area for a moment.
Exit
This is the signal we were waiting for in order to close our trade. We exit the position and collect a profit of $.30 cents per share for 25 minutes of work.
#4 – Trading Harami with Bollinger Bands
In this trading strategy, we will combine the harami with bollinger bands. We will only trade the haramis that form at the outer edges, when the price touches a level of the upper or lower bollinger bands.
Entry & Exit
Once the price touches the upper bollinger band at the same time a harami is formed, open a short position. Likewise, hold the position until the price touches the lower bollinger band.
Harami + Bollinger Bands
This is the 5-minute chart of IBM from Dec 8, 2015.
The first black arrow shows an increase of IBM and price interaction with the upper bollinger band. In the green circle, you see a bearish harami candle.
This gives us a short signal and we open the trade.
We hold our trade until the price meets the lower bollinger band level –closing our position when the price closes the first bullish candle after touching the lower bollinger band level.
This happens 28 periods later, almost 2 hours after we entered the trade. This trade makes us a total profit of $1.07 per share on IBM.
Which strategy is better?
All four strategies are great for trading candlestick reversal patterns like the harami. Yet, according to our in-house trading expert Al Hill, if he had to pick a strategy, he’d prefer trading haramis with bollinger bands.
“I believe that bollinger bands are likely to give you less false signals and keep you in winning trades longer.”
Al Hill
Price action trading is often insufficient for making a trading decision, as it requires years of experience mastering chart patterns.
The EMA plus Fibonacci strategy is strongly profitable, but sometimes the fast EMA could knock you out of a winning trade relatively early.
Although the stochastics are one of the faster oscillators, it might take forever until you match your candle pattern with an overbought/oversold signal.
Consideration
One point to note is that these four trading strategies can be used in combination with all other candlestick reversal patterns.
Therefore, candlestick patterns like doji, hammer, inverted hammer, hanging man, shooting star, morning star, evening star, engulfing, etc. will provide you similar trading results as the harami candlestick pattern.
The harami candlestick pattern has trend reversal characteristics.
We confirm a harami at the end of a trend when a candle’s body fully contains the size of the next candle.
Since a harami is a secondary candle pattern, we need to confirm its signals with additional trading tools.
The four strategies covered in this article are applicable to other candlestick reversal patterns.
How to Practice
As with any pattern or strategy in the stock market, it takes time and effort to recognize them in real-time.
We recommend trading in a simulator with at least 20 successful attempts on this reversal pattern before employing real money in the market. The best part is that TradingSim has all the indicators you need to practice this strategy!
Once you have your dataset, you can measure your success. Then you will have confidence to take the trade knowing your ratio of wins to losses.
Alton Hill is the Co-Founder of TradingSim with over 18 years of trading experience. He completed the Design Thinking Bootcamp at Stanford’s D.School and brings expertise in Product Development to create the best trading simulation experience. His strategy focuses on trend-following systems, targeting high-volatility stocks with strong primary trends using the 15-minute chart.
Trade review of an earnings gap down | Tradingsim Video Lessons
This is Kunal from Tradingsim. We have received a ton of requests from you all on day trading education. I wanted to experiment by creating videos which include reviews of trades that we actually...
Pharmaceutical companies are some of the most volatile stocks making them ideal for day trading due to the large trading ranges that allows for day traders to make profits off the volatility. The...
What is a Descending Top Pattern? Descending tops develop when the price action produces lower tops between swing lows. As the tops are lowering with each successive move, a bearish trend is forming...


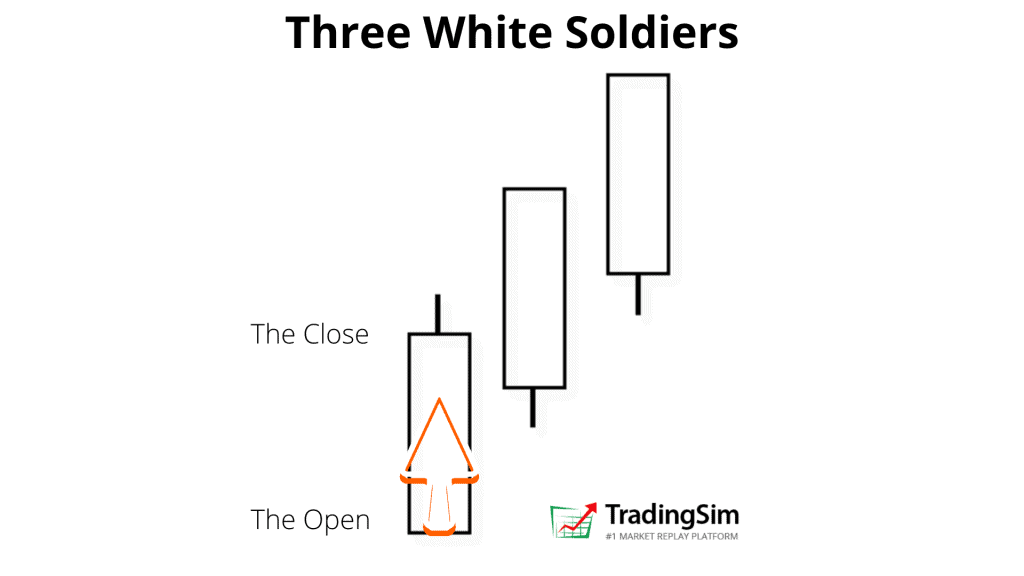

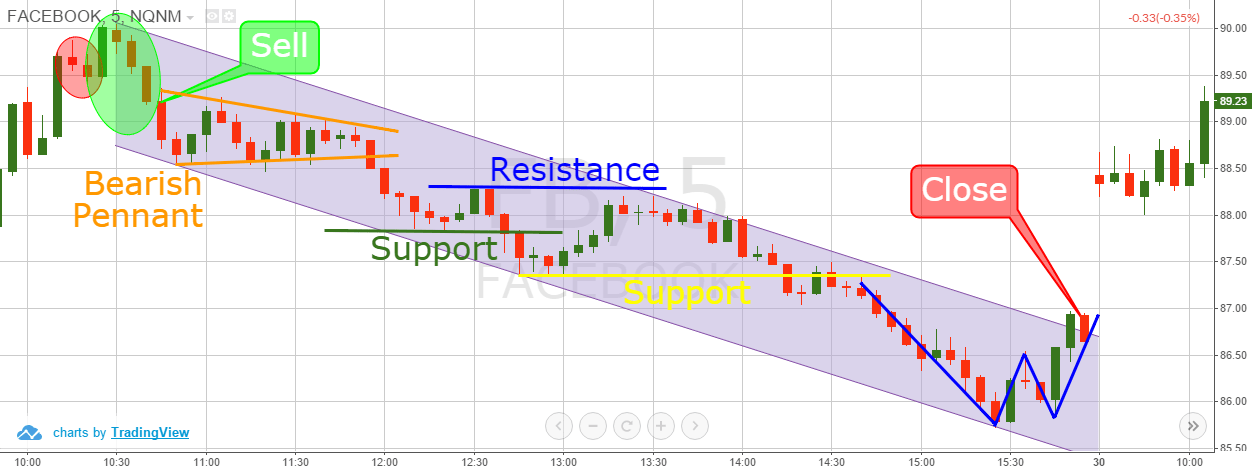

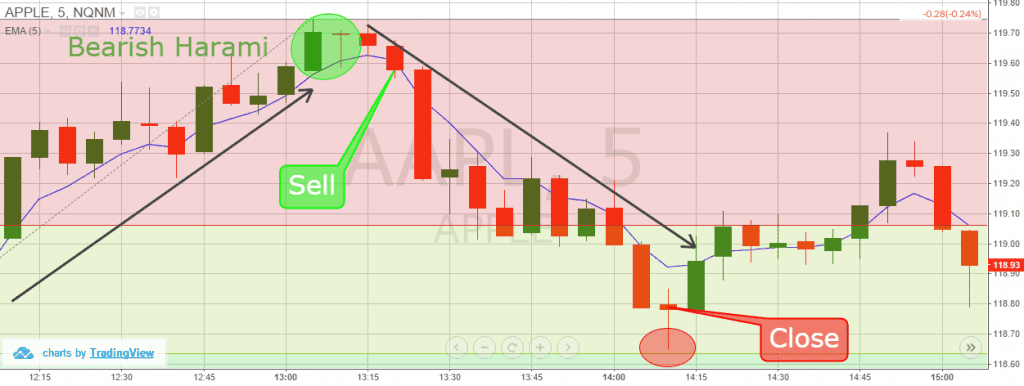
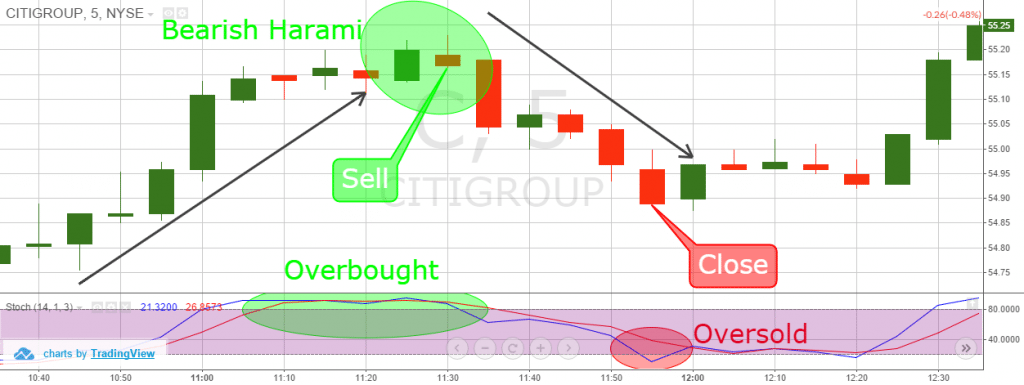
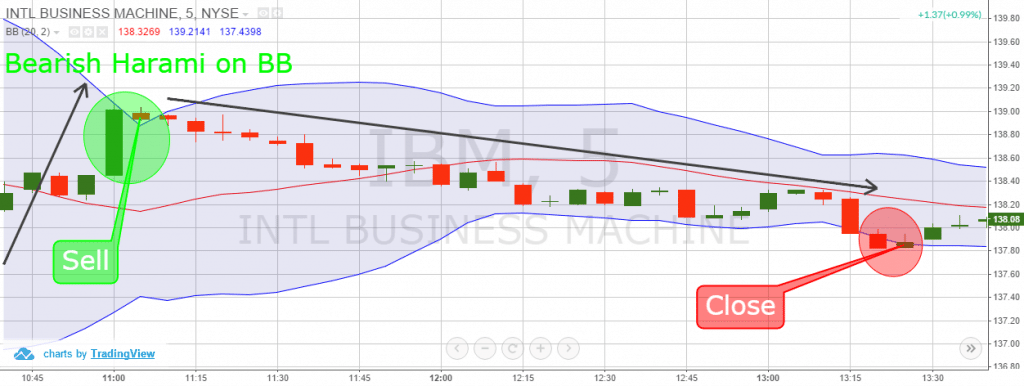


 Chart Patterns


