Flags and pennants are foundational chart patterns of technical analysis. What I mean by this is most technical traders have heard of the patterns, as these are easy to recognize. Most of the trading strategies documented for flags and pennants are straightforward and somewhat boring to be honest.
In this article, I plan to challenge the norm and coming up with some creative ways you can start to trade these patterns.
Let’s first ground ourselves on the definitions of flags and pennants.
Definition of Flags and Pennants
So, when you think of a flag, it is literally talking about the shape of a flag. This is why when you search for flag patterns on the web, you will often see in the search results flags of countries for sale.

US Flag
As you can see in the above picture of the American flag, a flag blows in the wind. It’s not like a note card, with a perfect rectangle. The flag is in motion and will drift towards the direction the wind is blowing, which essentially is the same as trading in the direction of the primary trend.
Pennants again are another common shape that we see not only in the trading world, but also in the real world. It’s a triangle that is converging tightly on both sides to a point. As a kid, I remember my Dad buying me pennants at the Orioles game so I could cheer on the hometown team.

Pennant Flag
If you can understand these two images, you will be able to recognize these patterns on a price chart.
Now that we all have the same base understanding of the pattern, let’s dive into the three strategies for trading the flag and pennant patterns.
Strategy #1 – Trade Flags and Pennants that retrace less than 23.6%
If you are not familiar with Fibonacci, 23.6% is part of the Fibonacci series and is in the default series for most trading platforms including Tradingsim.
The point of looking for patterns with less than 23.6% retracements is a way to only identify the flags and pennants, which are trending strongly.
Let’s take it to the charts to really drive home this concept.
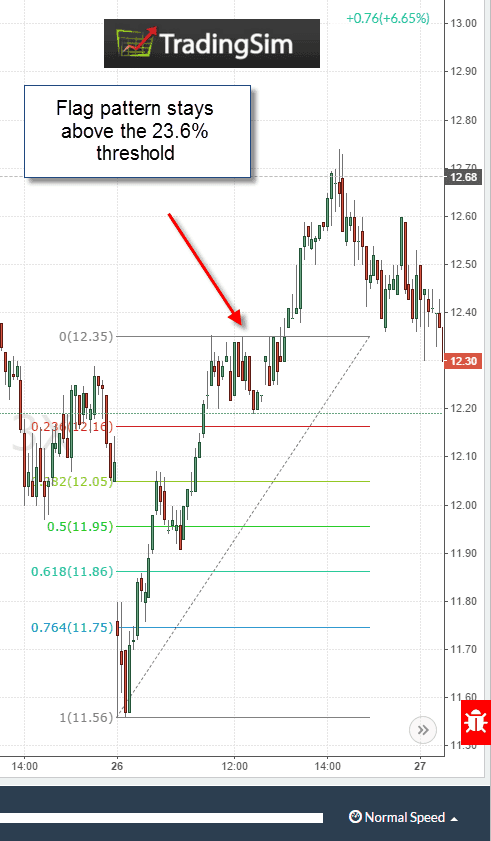
Flag Pattern
In the above example, we have a flag pattern, which had an impulsive move higher. Then the stock began to trend sideways for a few hours on the 5-minute chart. As you can see, RUSS never broke the 23.6% retracement line, before screaming higher.
Trade Setup
For the trade setup, you could place a buy order on a break of the high, with a stop below the low of the range. Again, the stock cannot retrace more than 23.6%.
In the next example, we will be covering the same setup, but on the bearish side.
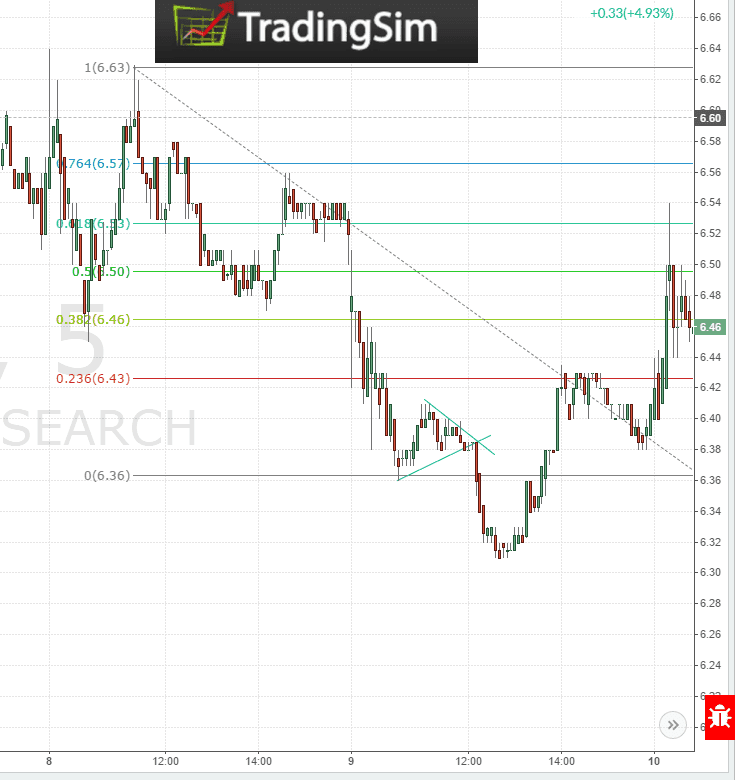
Pennant Charts
After the pennant developed on the chart, ARWR experienced a breakdown right after lunch.
The key thing to remember in both the flag and pennant formations is that there was an impulsive move with little to no retracement. Jumping on this bandwagon reduces the likelihood of the trade going against you.
Pennant Trade Setup
In the above example, you would want to short the break of the pennant trend line, with a stop above the middle of the upper trend line. The reason you should use the middle of the trend line, is due to the possibility of a quick fake out before resuming the direction of the breakout.
Strategy #2 – Buy a break of the Flag or Pennant on the Open
In full disclosure, I do not trade during the first 20 minutes; however, this doesn’t mean there aren’t opportunities for other traders. A formation that I have noticed over the years is one that blends both day trading and swing trading.
The setup consists of an impulsive move in a stock that lasts over 2 or 3 days. The stock will run all day and then towards the end of the day, form a flag or pennant pattern. The next day, the stock will gap through the resistance or support levels and then repeat the same trading pattern.
To illustrate this point, have a look at the below chart:
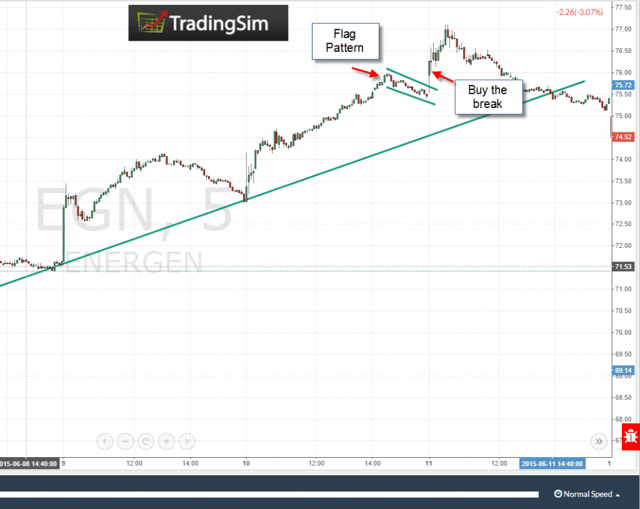
Multiple Day Breakout
Notice how the stock was stair stepping higher and higher throughout the week. Finally, a flag pattern developed and on the open of 6/11, EGN gapped higher through the previous day flag pattern.
The Trade Setup
Identify a stock that has been trending over a number of days. Look for the trend line to help define the trend to ensure there is continuity over multiple days. Once you can see the larger formation, look to buy the open of the stock once it gaps through the previous day’s flag or pennant.
Strategy #3 – Use Ichimoku to Validate the Breakout
Because flags and pennants are such common patterns, you need to have a method for weeding out the noise. One method you can use to filter out the possible trading opportunities is to use an on-chart indicator like the Ichimoku Cloud.
The definition of the Ichimoku Cloud is out of the scope of this article, but to quickly summarize, above the cloud is bullish and below the cloud is bearish.
Therefore, when reviewing flag and pennant patterns you can look to see how the price action is trending relative to the Ichimoku Cloud.
To further illustrate this point, let’s take it to the charts.
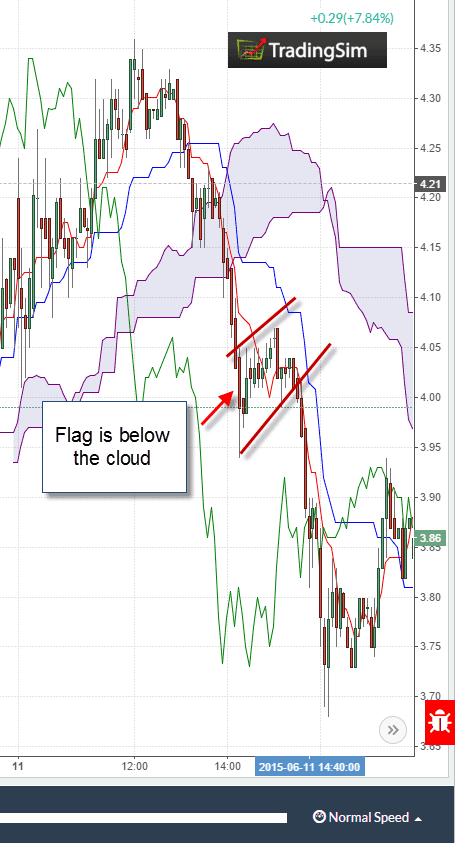
Flag below the Cloud
If you are not familiar with the Ichimoku cloud, the chart is going to look really busy. The only thing you need to focus on in the above example is that the break down through the flag occurred while price action was below the flag. As a trader, this gives you additional confirmation that the bearish trend will continue and you are less likely to be caught in a bear trap.
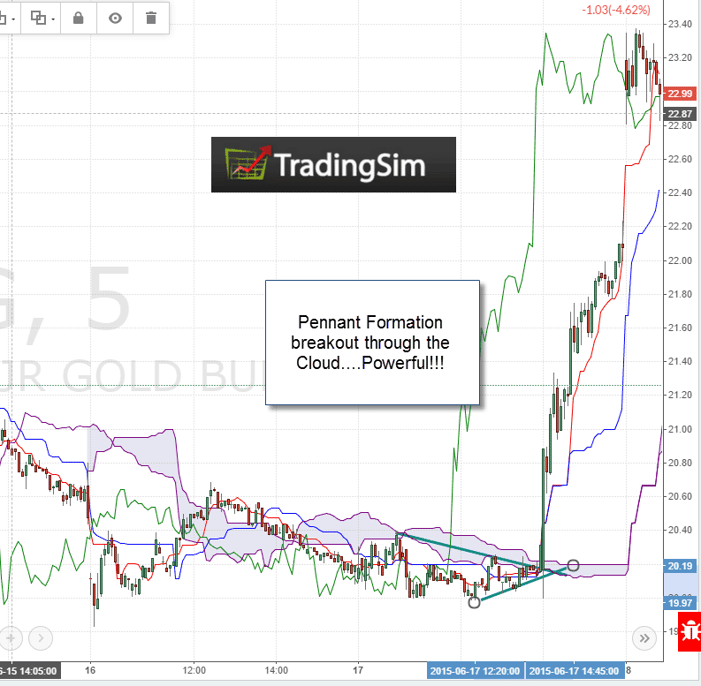
Pennant Ichimoku Cloud Breakout
Just to level set your expectations, it’s extremely difficult to find charts that converge into a pennant and then break through the cloud with such momentum as the above example. However, if you are able to identify the setup, you will be able to recognize you may have a real winner on your hands.
The Trade Setup
Identify a stock that has developed a flag or pennant. If the stock is breaking out of the pattern and is going in the direction of the cloud, then you have confirmation the trend will likely continue.
If you are looking to trade a trend reversal, wait for the flag or pennant to line up directly below or within the cloud. Then wait for the market to send the stock screaming higher through the cloud. At this point, you are essentially entering the position right as the trend changed, which will leave a number of traders trapped and covering their positions.
In Summary
Trading flags and pennants isn’t anything new to most traders. However, if you are able to identify another perspective on the formation, you essentially can develop an edge over other market participants.
To quickly recap, in this article we covered three strategies for trading flags and pennants:
- Identify the strongest trends with retracements less than 23.6%
- Identify multi-day trends that break through a flag or pennant on the open
- Use the Ichimoku Cloud to validate flag or pennant breakout
Much Success,
Al
Photo Credit
American Flag by Mike Mozart
Pennant Flag by Toronto History
Quick Answer: What is the difference between a flag and a pennant pattern?
A flag is a short, parallel-channel consolidation that slopes gently against the prior trend. A pennant is a small symmetrical triangle that forms after a sharp move — converging trendlines with no clear slope. Both are continuation patterns that typically resolve in the direction of the flagpole (the sharp move that preceded the consolidation). The measured move target is the length of the flagpole added to the breakout price.
Updated 2026-04-24 by Al Hill, Co-Founder of TradingSim. Verified against current TradingSim market replay data.
The Flagpole Is the Whole Trade
Traders obsess over the flag or pennant itself and miss that the quality of the setup is decided before the pattern forms. If the flagpole — the sharp run-up or run-down that precedes the consolidation — is weak, the pattern is not tradeable no matter how clean the consolidation looks.
A tradeable flagpole has three features: it covers at least four times the average true range of the prior fifteen bars, it prints rising volume into the move, and it closes in the top (or bottom) quarter of its total range. Moves that lack those three traits produce flags that break out and fizzle.
Flag vs Pennant at a Glance
| Feature | Flag | Pennant |
|---|
| Shape | Parallel channel | Converging triangle |
| Slope | Against prior trend | Roughly horizontal |
| Duration (intraday) | 5–15 bars | 5–10 bars |
| Volume during consolidation | Declining steadily | Sharp contraction |
| Typical breakout volume | 1.5–2x average | 2–3x average |
| Measured move | Flagpole length added to breakout | Flagpole length added to breakout |
The Entry Rules I Trust on Flags and Pennants
Primary entry: A buy-stop one tick above the upper trendline of the consolidation (sell-stop below for bear flags). This guarantees you only enter on the break itself and not on internal noise.
Confirmation entry: Wait for one full bar to close above the upper trendline, then enter on a pullback to the broken line. This filters false breaks but costs you 20–30% of the measured move.
Stop placement: For bull flags, place the stop one tick below the lowest low of the consolidation. For pennants, place the stop one tick below the lower converging trendline at the moment of the break. If either stop is more than 1.5x ATR away, the setup is too sloppy to trade.
Target: The measured move is the length of the flagpole projected from the breakout price. Scale half off at 1R, trail the remainder using a 2-bar low (for longs). If the measured move completes in a single impulse, exit into the target — flags rarely extend beyond their projection without first pulling back.
Which Timeframes Actually Work for Flags and Pennants
- 1-minute chart: Useful only for scalps during the first 30 minutes. Too much noise the rest of the session.
- 5-minute chart: My bread-and-butter for intraday flags on liquid large-caps and index ETFs.
- 15-minute chart: Best timeframe for futures traders running ES or NQ continuation setups.
- Daily chart: Flags become multi-session swing setups. Hold through overnight gaps only if the flagpole was sector-driven, not single-stock news.
How Flags Fail — and How to Avoid Getting Caught
Flags fail in three predictable ways. First, the consolidation stretches past fifteen bars — longer consolidations indicate genuine supply or demand rather than a pause. Exit or stand aside. Second, the breakout prints on weak volume. Without at least 1.5x average volume, the break is almost certainly a fake-out; tighten your stop or exit before the target. Third, the flagpole itself was stair-stepped rather than impulsive. Stair-step moves lack the compressed energy that powers the post-break continuation.
A 15-Session Flag-Hunting Drill
Open TradingSim and replay fifteen sessions of SPY, QQQ, or a high-beta large-cap. Mark every bull flag and pennant that meets the flagpole quality rules above. For each one, note: did the measured move complete? If not, how much of the move did it capture before failing? A dataset of twenty to thirty marked setups will tell you more about your ability to spot flags than any amount of reading.
Frequently Asked Questions
What is a bull flag pattern?
A bull flag is a continuation pattern consisting of a sharp upward move (the flagpole) followed by a short, gently down-sloping parallel-channel consolidation (the flag). It resolves by breaking above the upper trendline of the channel and typically projects a measured move equal to the flagpole's length added to the breakout price.
How long should a flag pattern last?
On intraday charts, flags should consolidate for 5 to 15 bars. Patterns that stretch beyond 15 bars lose their compressed-energy character and start behaving like ranges. On daily charts, a flag typically lasts 5 to 10 sessions before resolving.
What is the measured move of a flag pattern?
The measured move is the length of the flagpole (the initial sharp move) added to the breakout price. If a stock ran from $100 to $110 in a sharp impulse, consolidated between $108 and $110 in a flag, then broke out at $110, the measured move target is $110 + $10 = $120.
Are flags bullish or bearish?
Flags can be either. A bull flag forms after a sharp up-move and resolves higher; a bear flag forms after a sharp down-move and resolves lower. The pattern takes its bias from the preceding flagpole — it is a continuation pattern, not a reversal pattern.
What is the difference between a flag and a pennant?
A flag is a parallel-channel consolidation that slopes against the prior trend. A pennant is a small symmetrical triangle with converging trendlines and no clear slope. Both are continuation patterns with the same measured-move calculation, but pennants typically resolve faster and with sharper volume contractions during the consolidation phase.
Practice This Setup on TradingSim
Reading about flag and pennant patterns only gets you so far. The shift from concept to instinct happens when you drill the setup across hundreds of sessions. TradingSim's day trading simulator replays real historical market data tick-by-tick, so you can practice identifying and trading flag and pennant patterns under live-market conditions without risking a dollar. For futures-oriented traders, the futures simulator covers ES, NQ, CL, and GC with the same realistic replay engine.


 Day Trading


