Three White Soldiers: 3 Things You Must Consider Before Trading [Updated May 2026]
May 16, 2026
Written by: Al Hill
✓ Reviewed by Kunal Vakil, Co-Founder of TradingSim · Updated May 16, 2026
The Three White Soldiers pattern is a popular bullish candlestick pattern. It is fairly easy for most traders to spot in real time given the 3 large range successive candles. Moreover, in the right context it can signal a reversal of a trend. In this post we’ll discuss the context, requirements, and a free video on how to trade this pattern.
TL;DR — Three White Soldiers Pattern
The three white soldiers is a bullish reversal candlestick pattern made of three consecutive long green candles, each opening within the prior body and closing near its high. It has one of the highest win rates among candlestick patterns (~70%) but the signal often arrives late — meaning the easy upside is already gone by the time the third candle confirms.
Structure: Three consecutive long bullish candles, each opening inside the previous body and closing at or near the session high.
Win rate: ~70% when the pattern prints at the end of a downtrend on rising volume.
Late-signal risk: By the third candle, price has already moved 5–15% off the low — entries here have poor reward-to-risk.
Volume confirmation: All three candles should print above-average volume; the third on the highest volume of the three.
Failure mode: Pattern prints in an overbought market and immediately reverses — check RSI and the prior 5-day range before entering.
If you aren’t familiar with candlesticks in general, be sure to check out our Candlestick Pattern Guide. In that post we’ve put together a free infographic cheat sheet for you to use with your trading, along with many bullish and bearish examples!
Three White Soldiers Video Tutorial
Our in house trading expert, Al Hill has put together a quick video explaining the pattern. Have a look before you get started with the tutorial.
Overview
The three white soldiers is a Japanese candlestick pattern that is comprised of three or more bullish candles. [1]
The candles are white because positive price movement in eastern technical analysis is represented white and not green (as most charting platforms default to these days).
The reference to soldiers is in the context of the battle between the bulls and bears. Visually, they are marching forward with no impediment.
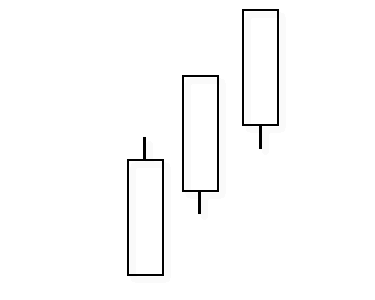
Three White Soldiers
3 Requirements for Confirmation
Now that you have the image of the three white soldiers candlestick pattern in your mind, hopefully you’ll begin to see the pattern on your charts more often. Sometimes studying candlestick patterns can be a lot like listening to a new song, it gets stuck in your mind.
But not every sighting of a pattern is tradeable.
With most candlestick patterns, one trader may see a bullish setup, while another may see bearish signs. For this reason, it is imperative to qualify the context of the candlestick patterns before making a trade.
Next, we will dive into three clear requirements you should look for when the candles present themselves on the chart.
1st Requirement – Three Bullish Broad-Range Candles
The first rule for the pattern is that you need clean candles with decent size. By clean, we mean without a lot of selling pressure. Ideally, you don’t want long upper or lower wicks.
These candles all need to finish in the positive and the candles cannot breach the low of the prior candlestick. For reference, please see the above image.
Next, the candles need to be healthy in size, where the open is essentially the low of the period and the candlestick closes near its high. The price advancement for each candle should be considerable compared to other candles on the chart
We aren’t looking at a doji or narrow body candle here.
In the right context, this suggests ease of upward movement. A bullish sign.
2nd Requirement – Formation at the End of a Bearish Move
This requirement is a bit more subjective and tougher to identify. You essentially need to identify weakness in a stock and then the three white soldiers show up to the rescue.
Contextually, it can come when there is a lack of supply in the market after a heavy sell off, signaling a big reversal. Short covering can fuel the Three White Soldiers off the lows.
This can occur after a clear bear trend down or after a stock retreats to the bottom of a trading range.
3rd Requirement – Heavy Volume Signature
This one is not discussed as often, but you need to see volume in the setup to validate its strength. [2] If you encounter three white soldiers that are on light volume this could mean there was a handful of weak retail traders that jumped in too soon.
Without volume this pattern has a higher probability of rolling over, thus stopping you out of your position.
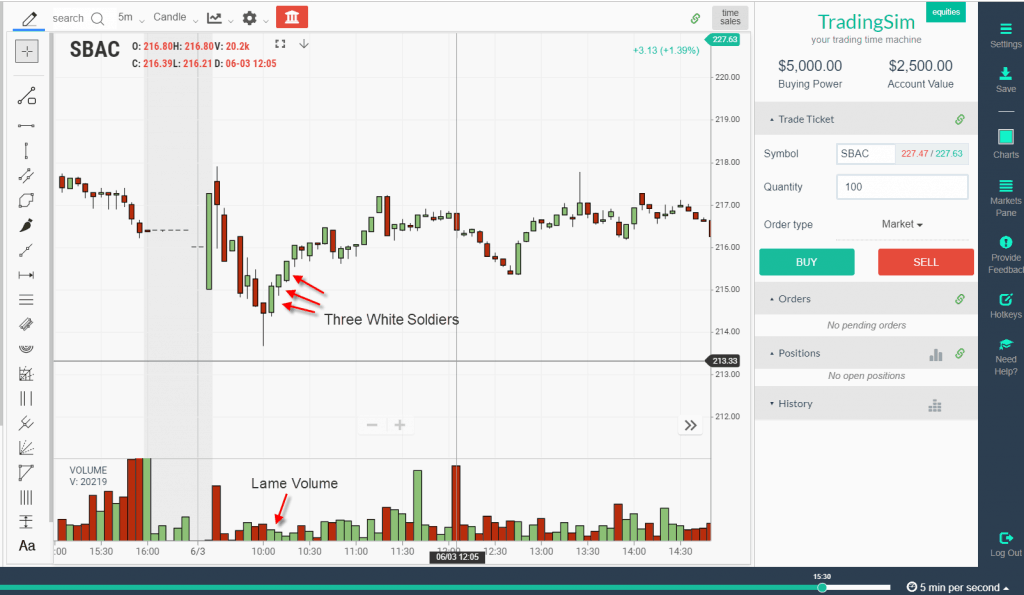
Three White Soldiers Chart – Example 1
Weak Three White Soldiers
In the first chart example, we’re reviewing the symbol SBAC. One of the first interesting points is that the stock has a sharp move upward at the open and then immediately rolls over.
Out of this weakness, SBAC then prints Three White Soldiers. This was an indication that the weakness had subsided and the stock would then attempt to develop some sort of base.
The one issue with this particular setup is the volume. As we stated earlier, the volume must accompany the setup in order for the signal to carry real weight.
The light volume in the Three White Soldiers pattern for SBAC did not ruin the trade as the stock was able to make a run for the daily highs.
However, the stock topped out at that point and developed a range.
So, in this example, while SBAC did not roll over, the stock also did not make the sizeable move we would have hoped for with this setup.
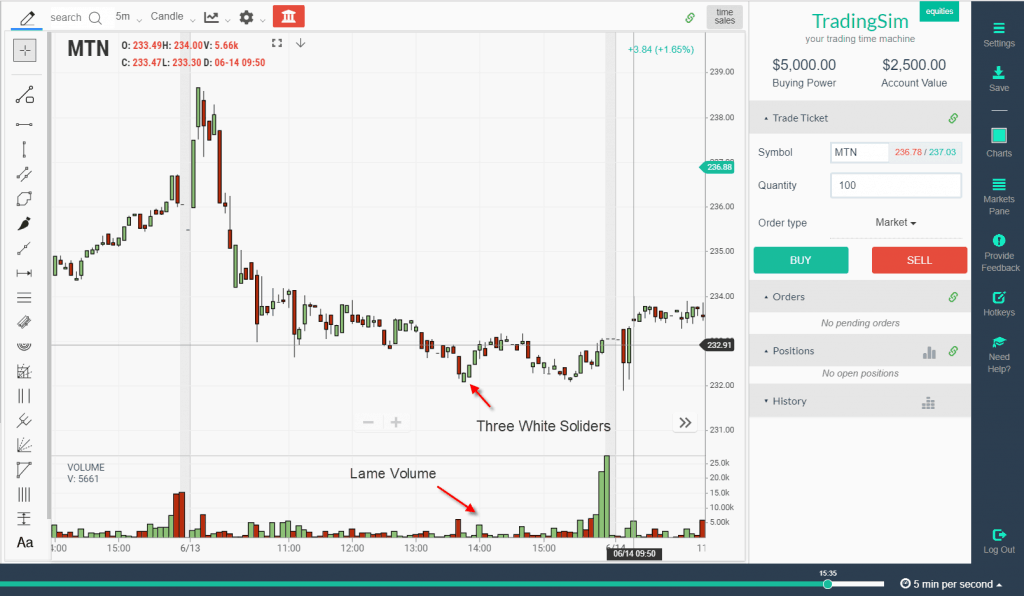
Three White Soldiers Chart – Example 2
Weak Three White Soldiers
In this example, do you see how MTN sold off the entire day? The stock had a high volume down event followed by three white soldiers. Yet again, the volume did not follow through with the soldiers.
So, what happened next?
The stock had a minor pop back up to the downtrend line only to drag lower into the close.
Are you starting to see a trend with weak volume?
That’s right, sometimes the soldiers may print on the chart, but these are not always your front line heroes.
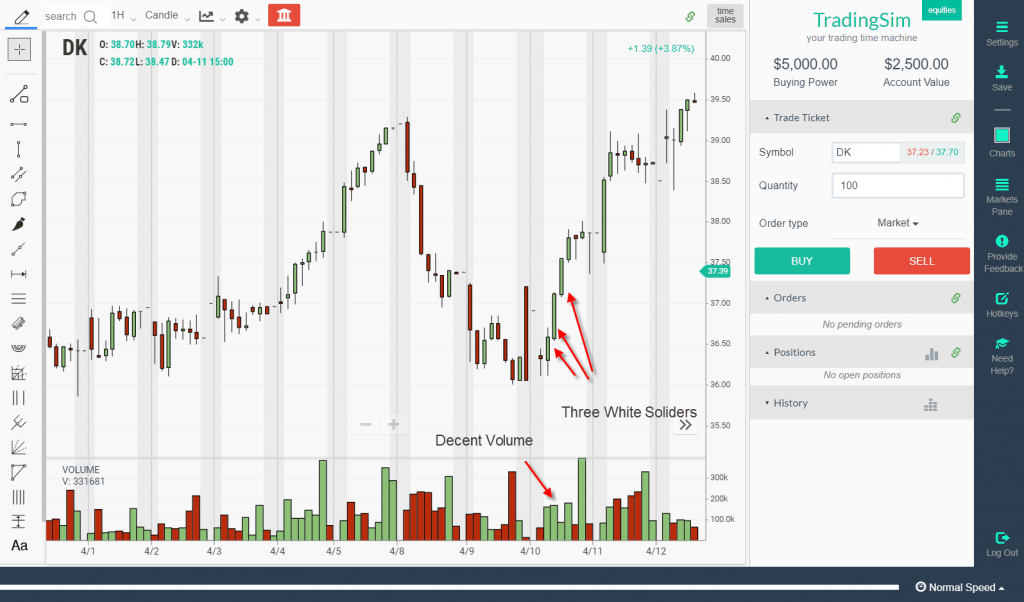
Three White Soldiers Chart – Example 3
Now that the failed examples are out of the way (it is always good to have a healthy does of skepticism with any pattern), let’s turn our attention to a Three White Soldiers formation that works out nicely.
Clean Three White Soldiers
After a steep selloff into a support zone, DK prints three white soldiers with decent volume and the stock shot back up to the most recent swing high.
Three White Soldiers Chart – Example 4
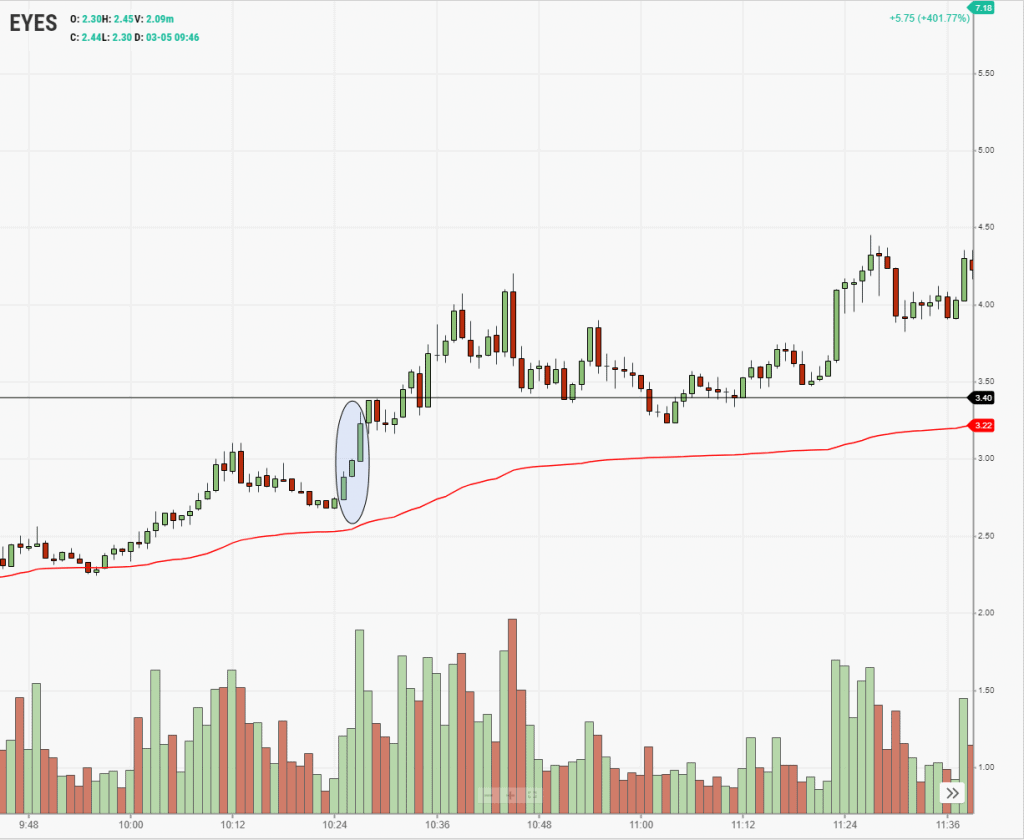
We’ll save the best for last. In this example, EYES is trending upward from a consolidation in the morning. Now that it is above its prior resistance, we get a little pullback in the price action — just enough to suck shorts into the trade.
EYES Three White Soldier
Once shorts are getting nice and cozy, bulls come with a vengeance to reclaim their trend.
Like the other examples, note the massive volume signature on these Three White Soldiers marching to new highs.
This particular stock ran another 400% from this point. So you can see that context is everything.
Why The Three White Soldiers Candlestick Pattern Is Difficult To Trade
Everything you have read on the internet probably praises this formation and the power of its trend forecasting capabilities. And it can be a great pattern for that reason, no doubt.
However, depending on your trading style, you may find this pattern difficult to trade for a few reasons shared below.
1. Difficulty Buying Selloffs
Many traders do not like to buy selloffs or stocks floating lower. You may have heard of the old adage, “don’t try to catch a falling knife?” Well, this is no different.
Trying to time the bottom can be difficult and risky, you never know when the stock could flush lower, stopping you out. Or even worse, stopping you out with a horrible fill.
2. Risk Is Too Wide
The difficulty with buying the Three White Soldiers is that they are very wide-bodied candles. As you notice from the examples above, waiting for the last soldier to form may create an emotional hurdle if you plan to set your risk at the low of the day.
If you were to buy three white soldiers at the confirmation of the last candle, that’s three really large candles to set a stop against. It’s simply too much risk in the trade relative to the profit potential on the upside.
As a consolation, if the pattern is extremely bullish with accompanying volume, you might decide to put your stop at the low of the last soldier candle. This could be a work around for the risk issue.
Otherwise, you might wait for a pull back to retest the demand in these three candles and take your long position there.
3. Buying The Pullback May Not Work
Those of you familiar with the setup will say, “well, duh, don’t buy the break of the third candle.” As mentioned above, you could just wait for a slight pullback on light volume after the three white soldiers develops.
Perhaps buy a 50% retracement from the high of the pattern, if you get that.
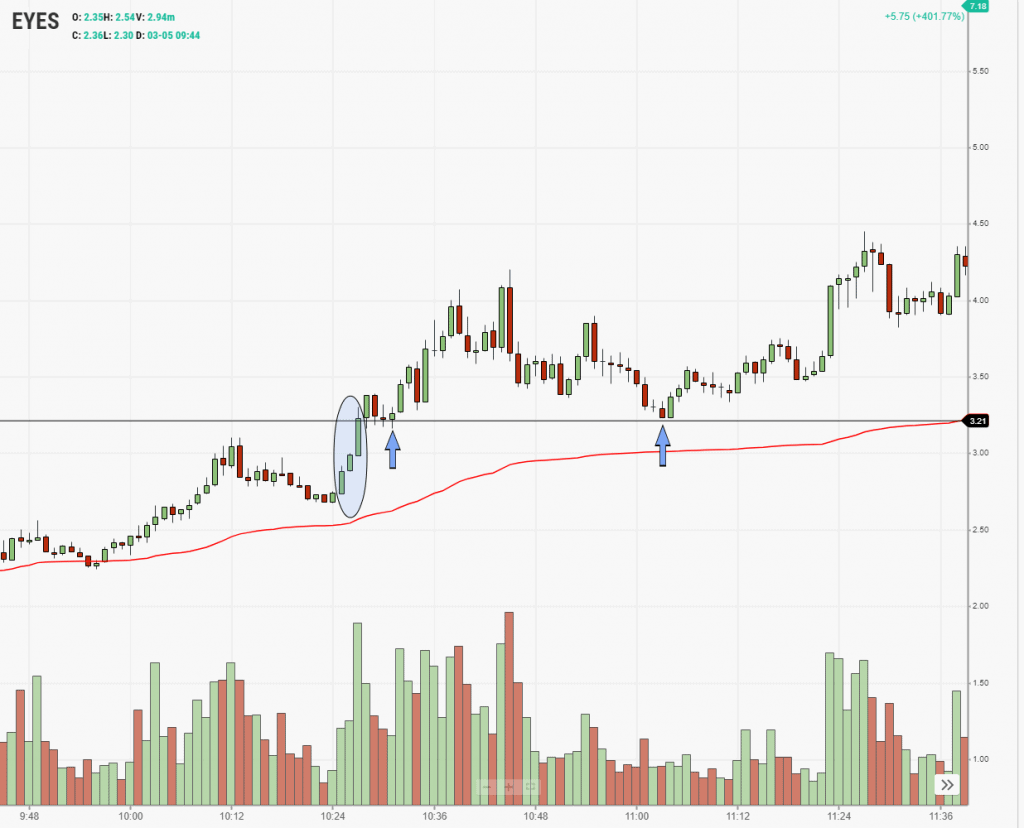
This doesn’t always work. As you can see with the EYES example above, we never got that retest.
However, the silver lining in the EYES example is that we did retest the high of the third soldier candle two times, and both times held the new trend well.
EYES holds support at the Three White Soldiers
Again, the key is context and the ability to set risk according to the potential profit you might make in the trade.
An Alternative Buy Point
Experienced traders prefer their patterns to start and move with a sense of urgency. For this reason, you could initiate a position into the runup of the three white soldiers, adding as volume confirms.
This is more of an anticipatory strategy if you sense heavy demand in the tape or Level II. After the completion of the formation you can make a decision to add or cut the trade depending on the context.
How To Practice the Three White Soldiers
If you are contemplating trading the three white soldiers pattern you can practice identifying the setup within a simulator by replaying tick data for over 11,000 symbols for the last 3 years.
You can then work on developing your own specific rules for entries, stops, and targets.
As always, be sure to ask yourself the following questions when practicing any setup:
what qualities work for each particular setup
what criteria were met, or not met
how was volume associated with the pattern
where could you have set your risk and profit target
how many of your trades worked or didn’t work
For more information on candlestick patterns, please check out our free technical analysis section devoted to these great trading tools.
Three White Soldiers vs Three Black Crows: The Bullish-Bearish Mirror
The three white soldiers has a mirror-image bearish counterpart called three black crows — three consecutive long red candles after an uptrend. Both patterns share the same structural logic: three consecutive sessions of one-sided pressure indicate institutional conviction has shifted. The differences come down to context and execution.
Three white soldiers at the end of a downtrend signals capitulation by sellers and accumulation by buyers. Three black crows at the top of an uptrend signals exhaustion by buyers and distribution by sellers. Both are 3-bar patterns that take days to confirm — meaning both arrive late. The professional play is to use them as confirmation of a trade thesis already developed from earlier signals (volume divergence, support/resistance breaks, sector strength), not as standalone triggers.
The Late-Entry Trap: Why Most Traders Lose Money on Three White Soldiers
The pattern has a 70% win rate — but most traders still lose money on it. The reason is the late-entry trap.
By the time the third candle closes and the pattern is confirmed, price has typically already moved 5–15% off the recent low. If you enter on the close of the third candle with a stop below the first candle's low, your risk is the entire 3-bar move. Your reward target is usually a measured move of similar size. That gives you a roughly 1:1 reward-to-risk ratio — which means 70% win rate translates to barely profitable after commissions and slippage.
Three ways to fix the math:
Enter on the second candle, not the third. Higher false-signal rate, but the entry is closer to the low and the reward-to-risk improves to 2:1 or better.
Use a partial-entry approach. Take half the position at the close of the second candle, the other half on a pullback after the third. Average price ends up lower than waiting for full confirmation.
Use the pattern as a continuation signal, not a reversal. Three white soldiers after a breakout (not after a downtrend) confirms institutional buying and tends to extend the move with better reward-to-risk.
Volume Profile of a Valid Three White Soldiers Pattern
Volume is what separates institutional accumulation from algorithmic noise. A valid three white soldiers pattern has a specific volume signature:
Candle 1: Volume should be at least 1.2× the 20-day average. This is the “something changed” bar.
Candle 2: Volume should equal or exceed candle 1 — the trend continuation needs participation.
Candle 3: Volume should be the highest of the three. This is the confirmation bar.
If volume declines across the three candles, the pattern is suspect. Declining volume on rising price means fewer and fewer participants are pushing the move — classic divergence and often the setup for a reversal. The volume analysis guide covers the full toolkit for reading volume alongside candlestick patterns.
How to Backtest the Three White Soldiers Pattern
The fastest way to develop pattern recognition is repetition. Open a 5-year daily chart of any liquid stock or futures contract. Mark every instance of three consecutive green candles where each opens inside the prior body. Tag each one with what happened next: continuation, reversal, or chop. After 50–100 examples, you will spot the high-quality setups in real time.
This is the value of replay-based paper trading — you can compress months of pattern recognition into a few weekend sessions. The replay engine on TradingSim lets you walk forward bar-by-bar through any historical chart, so you can grade the pattern in real time without the bias of knowing the outcome.
Frequently Asked Questions
What is the three white soldiers candlestick pattern?
Three white soldiers is a bullish reversal pattern made of three consecutive long green candles. Each candle opens within the prior candle's body and closes near or at the session high. It signals that sellers have exhausted themselves and buyers are stepping in with conviction.
Is three white soldiers bullish or bearish?
Three white soldiers is a bullish pattern. It signals a reversal from a downtrend or a continuation within an existing uptrend. The bearish mirror image is three black crows — three consecutive long red candles after an uptrend.
What is the win rate of three white soldiers?
The pattern wins about 70% of the time when it prints at the end of a downtrend on rising volume — one of the highest win rates among candlestick patterns. However, the late entry typically gives a poor reward-to-risk ratio, so many traders still lose money on it.
How do you confirm three white soldiers?
Look for three filters: (1) all three candles print above-average volume with the third on the highest, (2) the pattern emerges from a clear downtrend or pullback, not in the middle of nowhere, and (3) RSI is below 70 — patterns that print in overbought conditions often fail immediately.
What is the difference between three white soldiers and a bullish marubozu?
A marubozu is a single candle with no wicks (open at the low, close at the high). Three white soldiers is a 3-candle pattern made of three long green candles that are not necessarily marubozus — they can have small wicks but the bodies must dominate the range.
Related Trading Resources
Continue your trading education with these related guides from TradingSim:
Alton Hill is the Co-Founder of TradingSim with over 18 years of trading experience. He completed the Design Thinking Bootcamp at Stanford’s D.School and brings expertise in Product Development to create the best trading simulation experience. His strategy focuses on trend-following systems, targeting high-volatility stocks with strong primary trends using the 15-minute chart.
What is the Kicker Candlestick Pattern? The kicker formation is a reversal pattern that starts with a candle in the direction of the primary trend, followed by a gap contrary to the trend. Talk about...
How to Trade Diamond Chart Patterns – Winning Strategies
Diamond Chart Pattern Definition A diamond chart formation is a rare chart pattern that looks similar to a head and shoulders pattern with a V-shaped neckline. Diamond chart reversals rarely happen...
If you’ve traded stocks long enough, you’ve probably experienced it—that moment when you see a breakout reversal pattern that looks unstoppable, you buy in with confidence, and then the stock...


 Candlesticks


