Key Takeaways (Updated June 2026)
- Equity trading is the buying and selling of company shares on exchanges like the NYSE and Nasdaq.
- Traders use two core approaches: fundamental analysis (valuing the business) and technical analysis (reading price and volume).
- A repeatable strategy needs a watchlist, an event calendar, money-management rules, two confirming indicators, and a stop loss.
- Backtesting a strategy against historical data is the fastest way to build confidence before risking capital.
- TradingSim lets you practice equity trading on real historical market data without risking money.
What is Equities Trading?
The term equity trading and stock trading are sometimes used synonymously; however, there are a few minor differences between the two. Let’s start with the basic definition; equity trading is essentially the purchase or sale of company stock through one of the major stock exchanges, just as stock trading is. An equity trade can be placed by the owner of the shares, through a brokerage account, or through an agent or broker; again, similar to stock trading.
The key difference between equity trading and stock trading lies in their investment options and management firms. Equity trading firms specialize in offering in-depth market research, trading expertise, unique trading systems (even algorithmic), and have direct access to the trading floor for better executions. These equities trading firms predominately exist in the form of hedge funds and are set up to trade within a larger investment bank; such as Morgan Stanley, Goldman, Sachs, JPMorgan, and Bank of America to name a few.
Hedge Funds
Hedge funds have more leeway in their investing activities and are generally far more active than traditional mutual funds that believe in the long term buy and hold approach; however, this tends to be a double-edged sword. There have been many instances where hedge funds have significantly outperformed mutual funds and actually profited handsomely during down markets. Conversely, they take risks and these risks can wipe a large portion of your capital out if the hedge fund manager goes through a dry spell.
Hedge funds allow a fund manager with the flexibility to invest in any type of asset class that they choose, as long as it fits within their trading strategy or plan; this can include stock trading, equity trading, bond trading, equity option trading, or even foreign currency trading.
Private Equity Trading Firms
There has been a flood of private equity day trading firms which have come to market, also known as “prop” firms. These companies grow their capital by allowing successful traders to have access to the firm’s capital. In many cases, these equities trading firms will design their own formula for success and require each trader to use this formula. Others will allow their traders to have free reign to use any strategy that they choose as long as they consistently remain profitable. For the most part, private equity trading firms utilize technical analysis and their ability to track money flow to take advantage of short-term trading opportunities in the markets.
Where Can I Trade Equities?
In the past, equity traders conducted business in-person. Back in the day, you as an investor would call your order into your brokerage firm, at which point the order would flow down to the trading floor. We all remember seeing pictures of men yelling at each other to fill orders while holding small sheets of papers in their hands. There were huge blackboards with people sliding up and down the ladder updating prices with chalk.
Well, needless to say, we have progressed quite a bit from chalkboards.
Today, trading is automated and completely electronic. Many stock exchanges no longer have pits and use supercomputing to fill orders. Traders are able to purchase stocks remotely using their computer or smartphone. This happens through easy-to-use trading platforms, where equity traders have access to real-life charts and market execution capabilities such as trade tickets.
Now, you can buy or sell stocks with a simple click of the mouse or push of a finger using your tablet. The only thing stopping you from placing a trade is opening an online brokerage account.
Oh, how things have changed!
Now that we have covered equities trading, let’s dig into stock trading, which is where the common person will likely conduct their trading activity.
Stock Trading
If you think that you will start making money in a flash after opening a trading account, you are absolutely wrong. Stock trading is all about having the odds on your side. When trading, 100% success is a fairytale.
In order to be successful at stock trading, you must be detailed oriented and have a methodical system for interpreting market behavior.
If your analysis is sound and you are a disciplined trader, you just might have a shot at this the greatest of all games.
Now, I would like to introduce you to the two types of analysis every stock trader should be aware of prior to investing one dime in the market: fundamental versus technical analysis.
Fundamental Analysis
Fundamental analysis covers all of the financial aspects of a company which are made available to the public in the form of quarterly reports and annual statements.
Additional information sources include the quality of the executive management team, news events, and overall economic data which could impact the company’s performance.
In other words, you should be aware of micro and macro events that could impact the company’s bottom line.
I will give you an example of a Bulgarian bank. Its clients were falsely informed that the bank is performing poorly and that the company is on the brink of bankruptcy. As a result of this misinformation, there were numerous deposit withdrawals from that bank. This led to lack of operative capital and the bears were then able to run the stock price down.
The inability to secure financing due to the perceived market risk ultimately led to the bank filing for bankruptcy.
News can be a powerful market driver; therefore, you should always be abreast of what’s going on if you decide to use fundamental analysis as your method for interpreting market performance.
Technical Analysis
Let me be clear, technical analysis is my preferred method for making investment decisions – point blank.
Technical analysis of a security involves a detailed examination of the stock price on a chart. If you have read some of our previous materials you know that price moves represent not what traders think, but what they are willing to pay.
If there are more buyers than sellers, then the price will increase. If there are more people looking to exit a trade, the price will fall like a rock.
Below are just a few items technical analysis provides:
1. Support and Resistance
The areas where buyers are willing to step in are called support. The areas where sellers are looking to exit or add to short positions are called resistance.
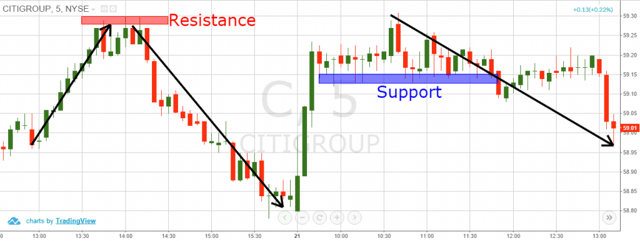
Support and Resistance Levels
2. Trend Lines
When price increases, we can very often follow the move with a straight line. This line is called a trend line. When the trend line is inclined, we have a bullish trend. When the trend line is declining, we have a bearish trend line.
Trend lines are a great method for adding to existing positions that are going in the direction of the primary trend.
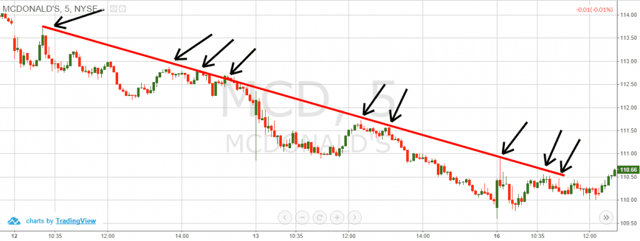
Trend Lines
Above is an example of a bearish trend line. Notice how the line is tested a total of 9 times as the stock continues lower.
For the most part, you want to trade in the direction of the primary trend, especially if you are somewhat new to trading – remember the trend is your friend!
3. Indicators
Technical indicators are used to gauge the price action in a repeatable fashion. This way you can use these indicators to confirm market conditions such as overbought and oversold conditions.
There are two types of equity trading indicators:
- Leading Indicators: These are the tools, which give us a trading signal before the event actually occurs.
Benefit – early entry in trades
Negative – many fake signals
Top Leading Indicators: RSI, Stochastic, Parabolic SAR
- Lagging Indicators: These are the tools, which give you a confirmation signal after the event has already started.
Negative – later entry in trades
Benefit – relatively less fake signals
Top Lagging Indicators: Moving Average, MACD
Building Your Stock Trading Strategy
Since you are now familiar with the two types of stock analysis, you next need to develop your trading strategy. I will give you a few equity trading tips, which will help you to find your place in the markets.
1. Build a portfolio
You simply cannot follow all the stocks in the market. If you are a newbie, I will advise you to pick five stocks from the same sector, so you will also get familiar with their industry. This way you will concentrate on one place instead of blindly trading every market.
2. Make a list of events
When the markets close on Friday you have a whole weekend to prepare for the upcoming week. List the upcoming news events for your five stocks. This way, you will know what to expect from the securities you trade and what events could impact your positions.
3. Plan your money management
Most brokerage firms will throw money at you in the form of leverage, but please resist the urge.
As a beginner, try not to risk more than 1% of your total cash on any trade. This means that with $10,000 you should maximum risk $100 per trade.
You should decide how much of your buying power to invest in each of your trades. I believe that for a beginner trader, 10% of your buying power is an optimal investment. However, remember to exit your losing trades with a maximum 1% loss of your cash.
4. Pick two trading indicators
Test a number of indicators to figure out how which one suits your trading needs the best. You will want to pick indicators that help validate signals but serve different functions. For example, you may want to use an oscillator with an on-chart indicator to confirm the price action.
If you were to use two oscillators, they will both say the same thing, just in different ways.
5. Always use a stop loss order
Trading platforms let you chose specific levels where you will exit losing trades. This feature is called a stop loss. We discussed that with a $10,000 account value, you should not risk more than $100 per trade (1%).
Although you are protected with a stop, don’t always let your stop trigger. Remember, the goal is to walk away with money in your pocket. If you see the price moving against you, simply exit the trade with a small loss. The 1% stop is for protection against a very rapid and volatile price moves, not an entitlement program for other traders.
How to Back Test a Trading Strategy
Today you can actually test your strategy without risking any money!
You simply need a trading platform that replays real market data for you to test drive all of the items we have outlined in this article.
The best platform for testing your strategy is TradingSim!
Have a look at the image below:
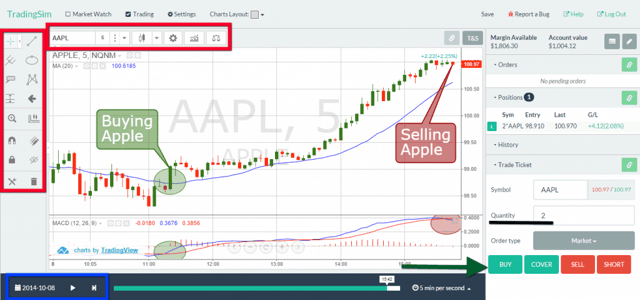
Back Testing Trading Strategies
This is a screenshot of the TradingSim platform with an Apple Inc. chart. I have included two indicators which are the MACD and the 20-period simple moving average (blue line).
In the red rectangles, you see the variety of tools the platform offers. You have a host of drawing tools, including Fibonacci levels and harmonic patterns. Also, you have a huge set of trading tools at your disposal.
The right sidebar on the image is the order panel.
Simply enter the “quantity” for the number of shares you want to trade. You can then “buy” or “short” the stock. It’s literally that simple! You can also adjust your account balance for all of you out there that want to see what it feels like to trade with a million dollars.
The blue rectangle shows the chart control panel. The playback controls are very similar to what you might see in YouTube or your home DVR. This allows you to take your back testing to a more granular level not present in other trading platforms.
The chart above shows a successful long trade. We have the price breaking the 20-period SMA and a bullish MACD crossover. Notice how you can see the number of shares purchased and the total gain make on the position.
You, my friend, can place hundreds or thousands of trades just like this in order to hone your skills prior to investing in the market.
Conclusion
All in all, we can say that equity trading can be viewed as a niche within the general stock trading arena. It is geared for more aggressive individuals, money managers and investors, who have either developed solid trading strategies or want to invest in them. These strategies are usually very intricate in design and one should do their due diligence before they consider investing in them. There are usually very heavy minimum investment amounts and heavy profit sharing models which can take up to 40% of your profits. While it can be risky and seem expensive, the rewards can also be commensurate if you find the right money manager.
Frequently Asked Questions
What is equity trading?
Equity trading is the purchase and sale of company stock through stock exchanges such as the NYSE and Nasdaq. It can be done by individuals, hedge funds, and private equity firms.
What is the difference between equity trading and stock trading?
The terms are often used interchangeably; both describe buying and selling shares. 'Equity' can also refer more broadly to ownership stakes, including private equity, while 'stock' usually refers to publicly listed shares.
Do I need fundamental or technical analysis to trade equities?
Many traders use both: fundamentals to decide what to trade and technicals to decide when. Short-term traders lean technical; long-term investors lean fundamental.
How much money do I need to start equity trading?
You can open a brokerage account with very little, but U.S. pattern day trading rules require $25,000 in a margin account to day trade frequently. Swing trading has no such minimum.
How can I practice equity trading safely?
Use a market simulator like TradingSim to trade historical sessions with virtual money so you can test strategies without financial risk.
Related TradingSim Guides


 Basics of Stock Trading


