In this article, I will discuss several key things related to the Parabolic SAR indicator. The topics will range from how to compute the indicator, all the way to how to interpret buy and sell signals. I will cover the indicator from a day, swing, and long-term trading perspective.
Background
J. Welles Wilder Jr. wrote a book called New Concepts in Technical Trading Systems, where he introduced the Parabolic SAR which stands for stop and reverse. This indicator does an amazing job of finding support and resistance levels.
The goal of the indicator is to provide you a visual of where to exit your trading position. The indicator also has a sensitivity to price, so as the stock accelerates, the indicator can weigh that movement accordingly.
Also, unlike other indicators like oscillators which provide oversold and overbought readings, the Parabolic SAR is here to help you identify stops.
While some traders will use it as a signal for both entries and exits, the primary purpose of the tool is to help you with where to stop out of a trade.
So, if you are looking for a quick visual approach for stop-loss management, this indicator is a great starting point.
Parabolic SAR Chart Example
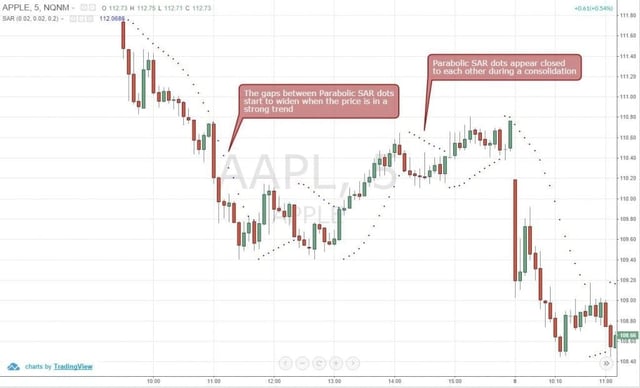
Figure 1: Parabolic SAR
Parabolic SAR During Bullish and Bearish Markets
Most popular charting platforms include the Parabolic SAR. The indicator is plotted on the price chart above and below the candlesticks.
During an uptrend, the Parabolic SAR dots are below the price. Conversely, during a bearish trend, the dots print above the price.
Parabolic SAR and Price Action
During strong trends, the gap between the price and dots widens. However, if the market is flat or choppy, the dots and price interact with one another quite frequently.
Understanding the Parabolic
Parabolic SAR Formula
SARn+1= SARn + α (EP – SARn)
SARn is the current period and+1 is the next period’s SAR value.
EP represents the highest price in an uptrend and the lowest in a downtrend.
The most important variable in the Parabolic SAR formula is the α. This represents the acceleration factor in the formula.
Parabolic SAR Settings
Charting packages by default will set the α value to 0.02.
Once the price makes a new high or low, the acceleration factor increases by 0.02, this explains the reason why the gaps between the Parabolic SAR and price increase during strong trends.
Focusing on the Tool as a Stop
You will find that the Parabolic SAR provides several signals. These signals are sometimes interpreted as buying or selling opportunities.
In my opinion, the strength of the indicator is in its ability to close you out of a trade. You should rely on your trading system for getting you in and out of positions.
Do not place this burden on the Parabolic SAR.
Long Stop
Let’s revisit what a long stop looks like. Again, the parabolic SAR is going to print beneath the price action. Now, the hard part for you is to determine whether you are going to use the default settings or make tweaks to the indicator based on how the security is trading.
Long Stops on Volatile Stocks
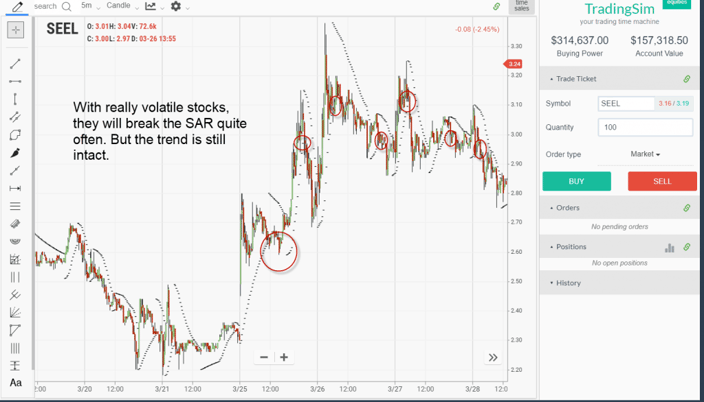
For example, let’s look at a volatile stock like SEEL.
Long Stops – Parabolic SAR
When reviewing the chart, it likely looks like the stop orders are clear. However, the move after these stops are hit is swift and strong.
In all but the first break, the retracements are greater than 75% of the prior move. This is where trading becomes difficult.
If you have made a decent profit, at what point do you exit the position? At what point do you hold for bigger profits?
As you can see, the indicator stops you out, but the money management aspect of the trade can be lost by focusing solely on the chart with fast movers.
Parabolic SAR Stop Exit Strategies
Here are a few things you can do to protect your profits on the way up. There is no perfect strategy, and each stock will react differently, but you can test each out to see which one increases your odds of profitability.
Exit a Portion of Your Position On The Way Up
Some traders will exit a portion of their position on a breakdown thru the SAR to limit their loss potential. This can work, but a better approach is to close out a portion of your position as the stock spikes higher in your favor.
On really strong moves up, one thing I have noticed when day trading is that the stock will on average have three pushes higher. Each push will give you an opportunity to lighten your position.
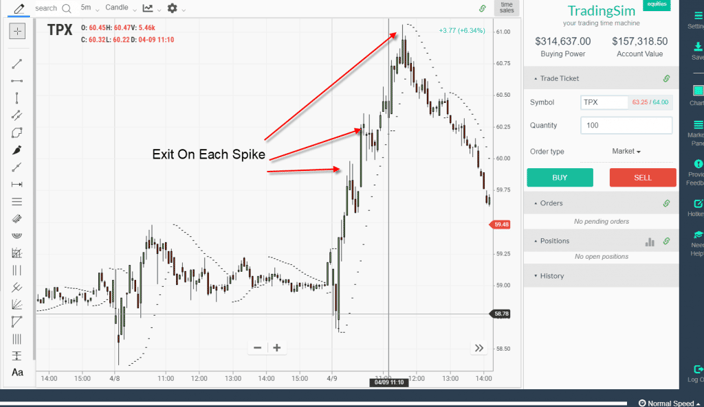
Exit on Each Push Higher
In the image above, notice how as TPX moved higher, we rewarded ourselves on each push. Please note, most charts will not look this clean.
Which leads me to the next set of options for managing trades with the indicator.
Increase the Timeframe or Reduce the Accelerator
Going back to the earlier portion of the post. You can always give a stock more room on its path to your target. The obvious benefit with this approach is that you will avoid being shaken out of a winning trade.
The downside is that you will potentially give back more than you would like on the trade.
Increasing the Timeframe
Increasing the timeframe is an oldie but goodie in terms of reducing the noise once in a position.
Here is a chart of TSLA on a 5-minute timeframe. During the trading day, the indicator triggered two stops on a long position.
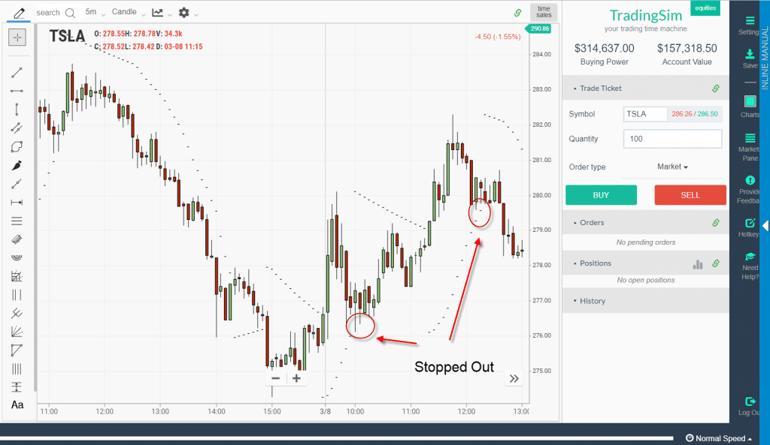
Switching to a 15-minute timeframe, you will notice that TSLA did not trigger one sell signal on the day.
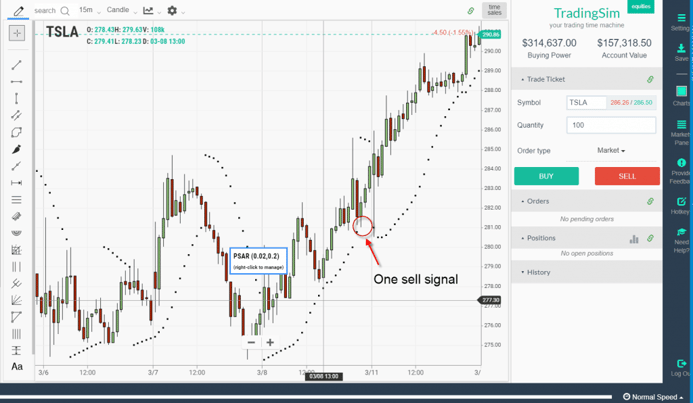
One Sell Signal
For me, I like to hyper-focus on one timeframe once in a position.
Once you start introducing too many timeframes, you may start to see things that just aren’t there.
Also, you never know the timeframe the trader that is controlling the stock is trading. Therefore, it’s best to fully understand how a stock should perform ou your desired timeframe and react to its movements accordingly.
Modifying the Acceleration Factor
In order to focus on one timeframe, another option is to widen the stop on the indicator. You do this by decreasing the value of the accelerator, so it does not react as quickly.
For example, let’s look at the recent LYFT IPO as a working example.
.02 Acceleration
Again .02 is the default setting for most trading applications.
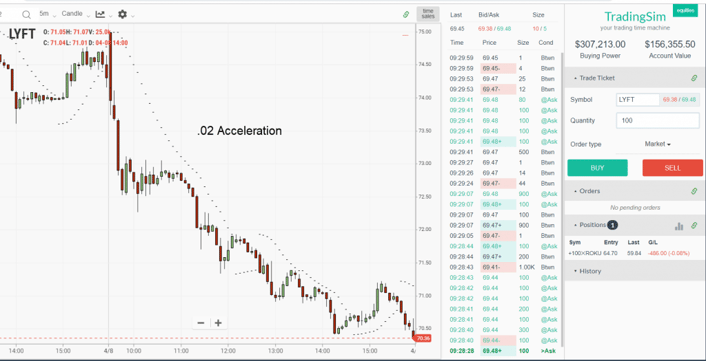
.02 Acceleration
.01 Acceleration
Now take a look at the same chart after modifying the accelerator to .01 to widen the stop.
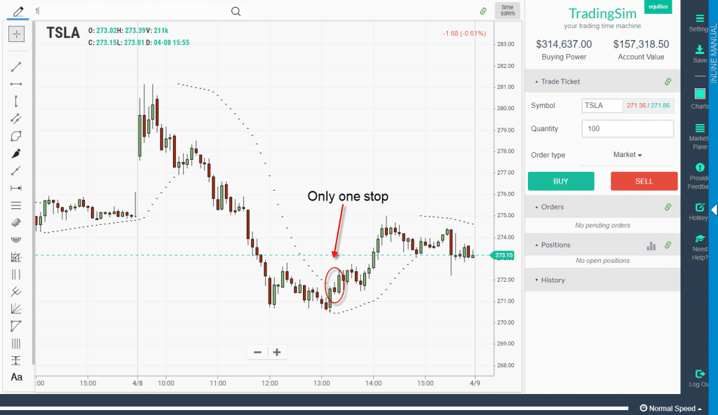
TSLA – One Stop
As you can see, the same stock, on the same timeframe, but reducing the accelerator has allowed us to stay in the trade a little longer.
So, out of the two approaches for staying in the trade longer, reducing the accelerator feels more natural to me and again does not introduce another dimension of another timeframe when managing the open position.
Parabolic SAR – Swing Trading and Long-Term Investing
Believe it or not, the indicator works just as well when day trading as swing trading or even long-term investing.
Swing Trading
Swing trading will require you to focus on a daily chart timeframe most likely. Below is a daily chart of TSLA.
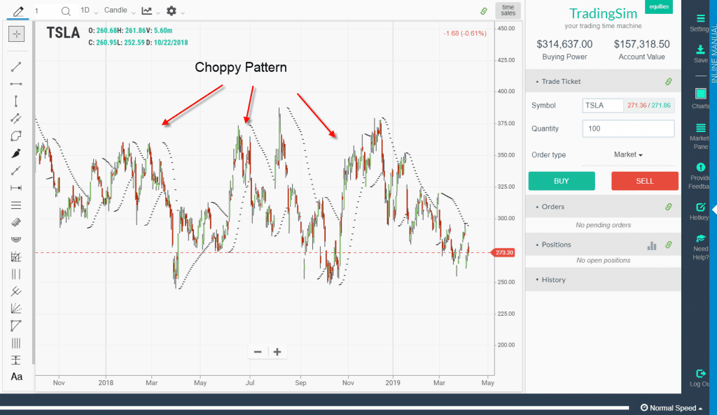
Choppy Pattern
I know the above chart is not what you were expecting. You were likely looking for a clean daily chart, where TSLA goes straight to the moon.
When reviewing charts, at times you are going to come across plays like TSLA. These are going to be the plays where you see a nice range, but the stock has several head fakes.
This is where the Parabolic SAR can not only help you with stopping out trades but also as an entry tool.
Parabolic SAR as a Filter
Going back to our swing trading example with TSLA, notice how the chart is displaying several areas where you would have been stopped out of both long and short positions.
At this point, the indicator and price action are giving you a clear indication of TSLA’s behavior. Since the stock is not trending hard, any gains you make will be evaporated once the stock falls back inside of the range.
This gives you two clear choices.
Don’t take any Setups
If you are looking to ride the trend, at a glance, you will see that this is not going to work for that sort of trading approach. Therefore, you can just skip TSLA and look for other trading opportunities.
Trade the Range
The other option is to understand that TSLA is in a trading range based on the number of stops triggered. You can then increase the accelerator, so you do not give back so much of your gains.
Then a buy order can be placed at the low of the range and a sell at the high of the range. You also will want to increase the value of the accelerator so that you can keep your profits in the bank.
Long-Term Investing
I’m not going to go into depth with this section, as it is a rinse and repeat of the prior portions of the article. Again, the indicator works the same on all timeframes. Providing you clear entry and exit positions.
The key differential for you is you will have a wider range for your stops as you are likely using a weekly timeframe for long-term investing.
Please check out the below chart as a working example.
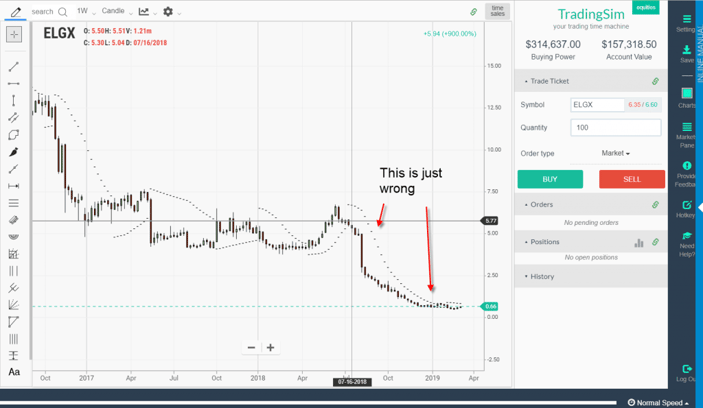
This is Just Wrong
In the above chart is the stock ELGX. Now, I’m not going to jump on the bashing bandwagon, but looking at the Parabolic SAR on a weekly timeframe, would you touch the stock right now?
Now, remember, this is for long-term investing purposes. I’m hoping the answer is no.
You are better off placing your money in something safer that does not have the potential to continue cratering lower.
Again, the indicator can do so much more than just stop you out of trades; it can help guide you on when to avoid certain setups.
How Can Tradingsim Help?
After reading this article, I hope it’s apparent that simply adding the indicator and starting to trade is not realistic. You are going to have to document each setup, volatility of the security you are trading and the overall strategy you are using.
You have to monitor all of these factors to determine the optimal Parabolic SAR stop strategy for your respective system.
Tradingsim provides the most realistic market replay experience in the world. You can choose intraday, daily and even weekly timeframes to identify the best method for using the Parabolic SAR.


 Chart Patterns


