✓ Reviewed by Al Hill, Co-Founder of TradingSim · Updated Mar 31, 2026
Day trading scans are an integral part to any day trading strategy. How else will you know what to trade? Yet, in a universe of thousands of stocks, finding the best candidates each morning can be a daunting task. In this post, we’ll share our top 4 criteria for finding the best tickers to trade each day.
In addition, we’ve created this quick tutorial for how to use the TradingSim scanning tools. Be sure to check it out as a primer for the content below.
Why Scan for Stocks?
On any given day, you’ve got the option to trade somewhere between 6000-8000 publicly listed companies. Not to mention all the OTC stocks, derivatives, and more.
No one can trade that many securities at once, for obvious reasons. Nor would you want to. You want to find the best tickers that will bring you the biggest reward.
Day trading scans offer a way to funnel that list into proper categories of equities that match your trading style or system. This way, you can focus on patterns you recognize, and discard the rest.
To that end, let’s look at few reasons why you might want to scan for stocks:
Volatility/Momentum
Volume/Liquidity
Short or Long Bias
Strategy
This is just a short list, but it encompasses a lot of what day traders are looking for each day as they scan the markets. Let’s take each one and look at why it is important, plus offer some scanning tips.
1. Volatility and Momentum
Day traders want to make the most of their money in the shortest amount of time. As opposed to swing trading, day traders expect to earn a decent percentage of their portfolio by buying and selling during the day. By the end of the day, they are back in cash.
Whereas a swing trade may take days or weeks or months to realize a big return, day traders scan for and capitalize on big moves each day.
Therein lies the importance of volatility and momentum.
Volatility and momentum are important for two reasons:
Without volatility, large intraday swings are not likely
Momentum gives the trader a big picture setup
Meme Stock Example
Meme stocks have been all the rage in 2020 and 2021. Stocks like AMC, GME, and others, have catapulted from their meager single digit values, to double and even triple digit per share valuations.
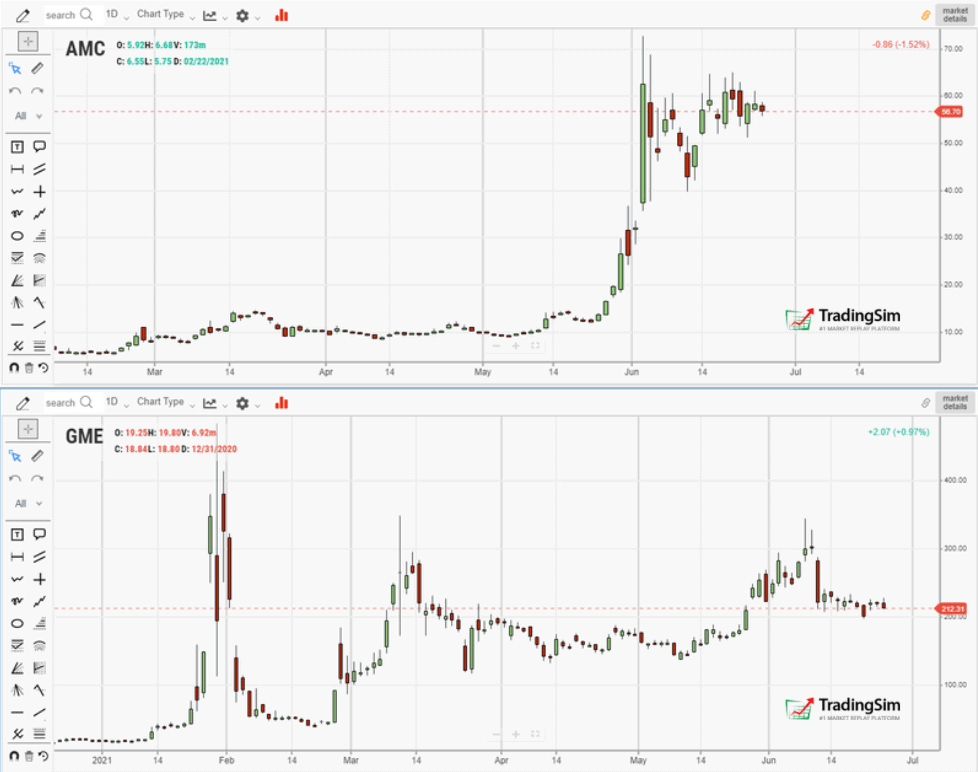
Take a look at the range that some of these daily candles have on AMC and GME:
AMC and GME volatility
On one day in January of 2021, GME gapped to $500+ and then fell almost $400 in a that same day. Likewise, AMC doubled its value in a single day in June 2021.
And as you can see, it can run both ways, up or down.
While these might be “outlier” moves in a normal market, they are perfect examples of the results you should seek for day trading scans — if volatility and momentum fit your strategy.
Filtering for Volatility and Momentum
In keeping with the meme stock examples above, let’s use our TradingSim scanner and see how we could have narrowed our results to include these big days.
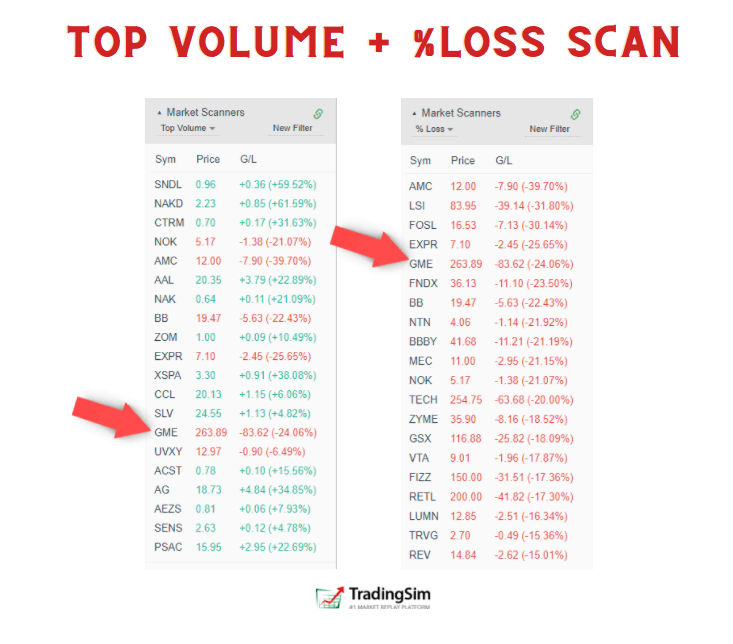
An easy way to scan for volatility and momentum is to filter for %gain or %loss on high volume. What this tells us is that the stock is either gapping up or down with a lot of interest from speculators.
A simple premarket scan on January 28, 2021, filtering for %loss and highest volume, gives us the following results:
Top Volume + % Loss day trading scans
In the results populated, we see GME in both columns. GME had the 14th highest amount of shares traded in the premarket that day, for the entire market. It was also the 5th biggest % decline at -24.06% by the time of market open.
That is a big fluctuation!
And now that you have your scan results, it is up to you to look at the chart and decide when and how you want to trade the ticker.
Scanners and filters don’t tell you how to trade, they simply show you the best opportunities for the day.
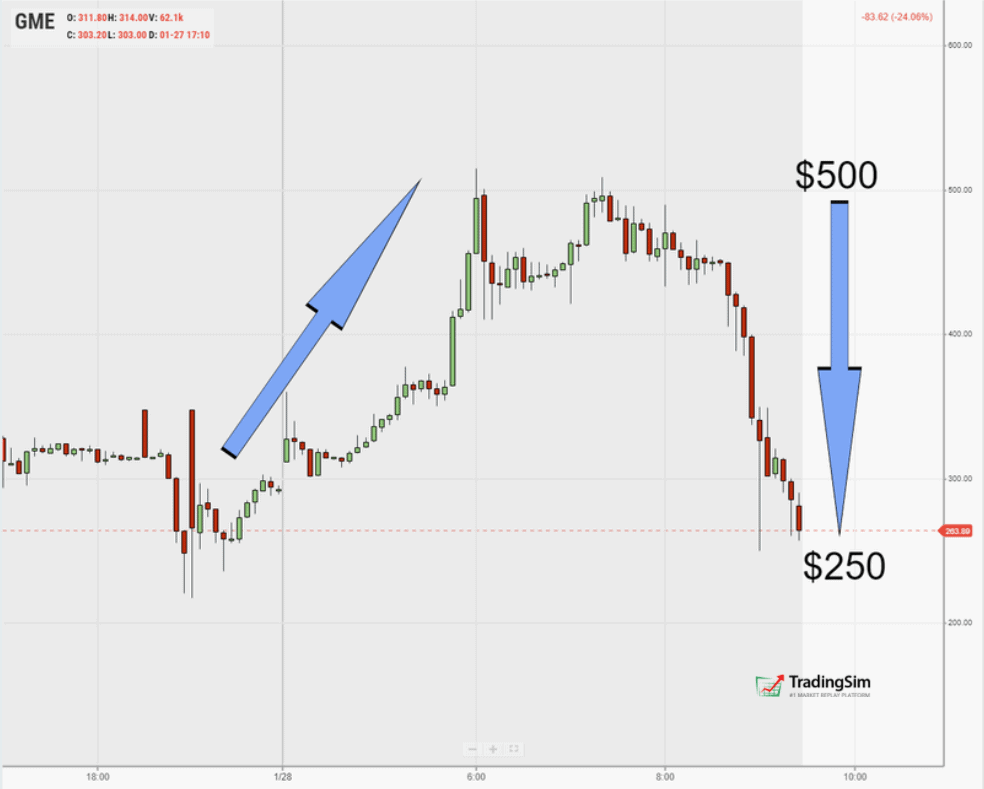
By the time 9:30am came around, GME had doubled in value, then retraced that entire move:
GME momentum up and down
This is a perfect representation of how volatility and momentum complement each other. The extraordinary intraday swings create a myriad of opportunities for the nimble day trader.
2. Volume and Liquidity
Volume and liquidity determine how easily you can get into and out of a position. In general, the higher the liquidity and volume, the easier it is to place larger orders at will.
In our GME example, over 5 million shares had been traded in the premarket for that day. That’s over $2,000,000,000 in shares traded in the premarket alone!
By the end of the day, it had traded over 23 million shares.
Why Volume and Liquidity Matter
Scanning for day trades with high volume and liquidity is important for a handful of reasons. Without proper liquidity, you may find yourself in one of the following predicaments:
You won’t get filled when trying to sell limit orders.
Market orders may experience massive slippage.
You might ended up being a bag holder.
You’ll be tempted to average down to support your position.
None of these options are ideal.
In similar fashion to volatility and momentum, volume and liquidity give you the steady stream of buying and selling you need to enter and exit positions.
To give an analogy, if volatility and momentum are the class 5 rapids you’re floating down, volume and liquidity are the water that keeps you from running aground.
Turn the volume off, the momentum stops.
Low Liquidity Example
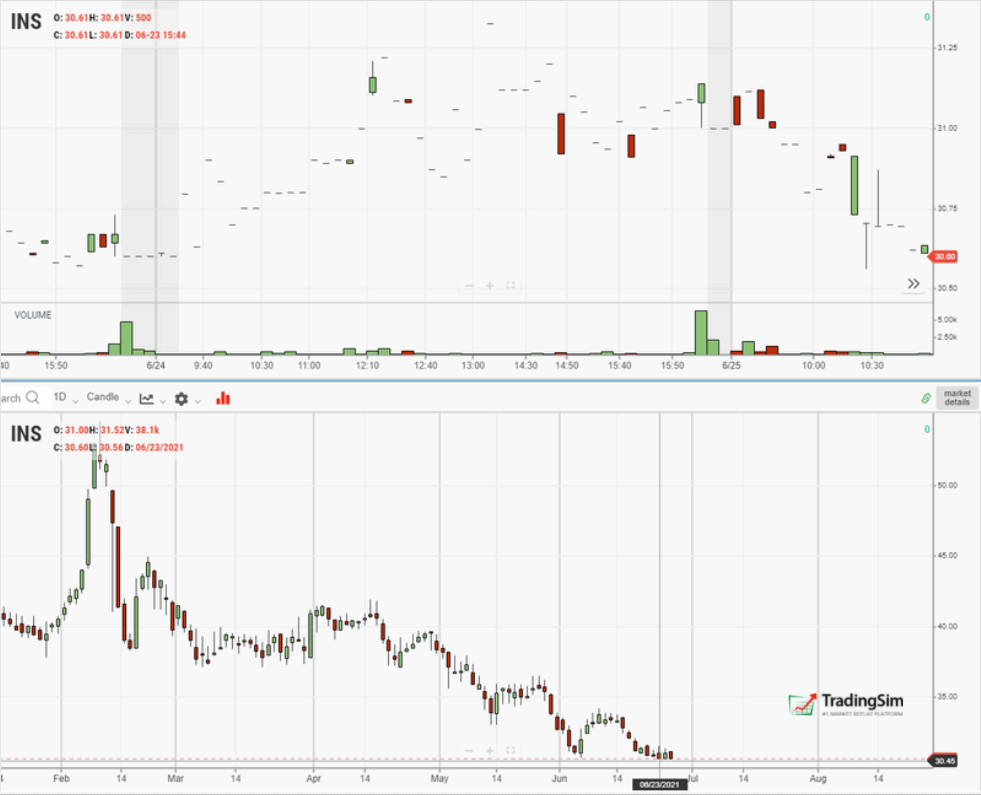
To visualize this imagine trying to trade INS on this day in June 2021. Crickets are chirping and no one is home.
INS low volume example
At only 26,600 shares traded on the day, what’s the point in even placing an order? You’ll be down $0.20 – $0.30 immediately, and good luck getting filled on anything with size.
Hopefully you can see the difference between low liquidity like the example above, and high liquidity like the GME example.
Filtering for High Volume and Liquidity
There are a number of ways to scan for volume and liquidity. We’ve shown two ways in the volatility example above.
However, if you want to increase your filter criteria, we suggest searching for stocks with higher market caps.
Scanning for larger cap liquidity
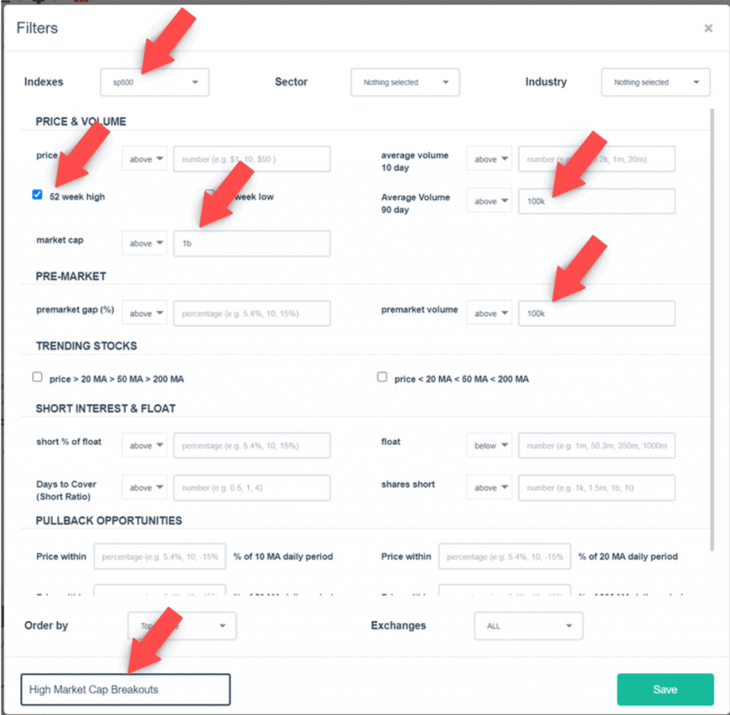
In the day trading scan above, we pick stocks with a minimum of $1 billion market cap or higher with a minimum of 100k shares traded over the past three months and 100k shares traded in the premarket. We’ve also limited the results to only stocks traded in the S&P 500.
We then sort those by highest volume, name the filter, then click save.
This way, you’re eliminating smaller cap stocks of lower valuation. Plus, the volume criteria eliminates a lot of the thinly traded stocks in the market.
3. Short or Long Bias
The great thing about filtering your day trading scans is that you can limit your results to a directional bias. Not all traders want to go long, and not all traders want to go short.
Depending on your preference, the market may be presenting more opportunities in one direction or the other. Thankfully, we can filter for either direction.
Long Scan Ideas
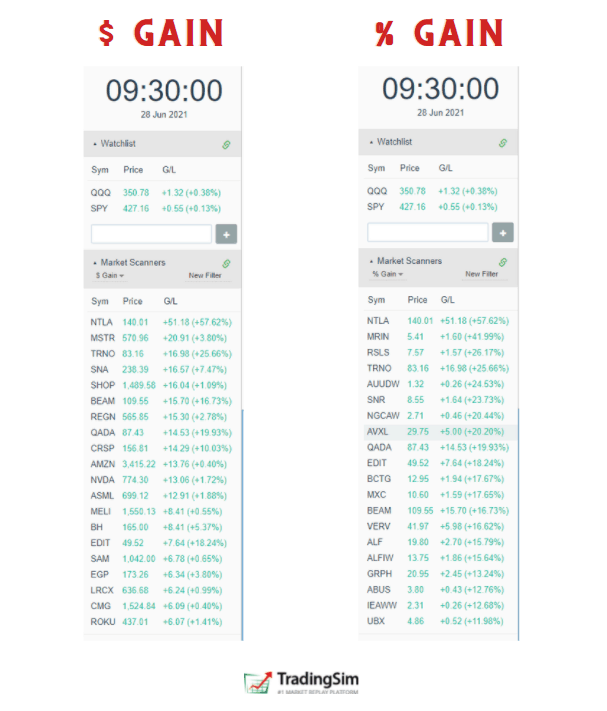
The simple method for scanning for long ideas is to look for premarket gappers. Here are a couple of methods you can use to scan for either % gain or $ gain.
$Gain and %Gain day trading scans
This populates a great starting list to narrow down your trade ideas for the day. As we’ve said before, not all the stocks will be great trading candidates.
It will be up to you to run through the charts and identify your setups, volume, and other criteria you like.
The reverse side to this scan is simply the $ Loss and % Loss scans. Run these if you’re looking for an opportunity to short a continuation move, or go long on an oversold bounce.
More Long/Short Scan Ideas
Perhaps you want to get a bit more granular on the daily chart before you zoom into the intraday price action. That’s a great plan.
Maybe you like to play breakout plays, or you only want to trade stocks that are breaking down?
Here is an example of scanning for 52-week highs with similar criteria from the last scan:
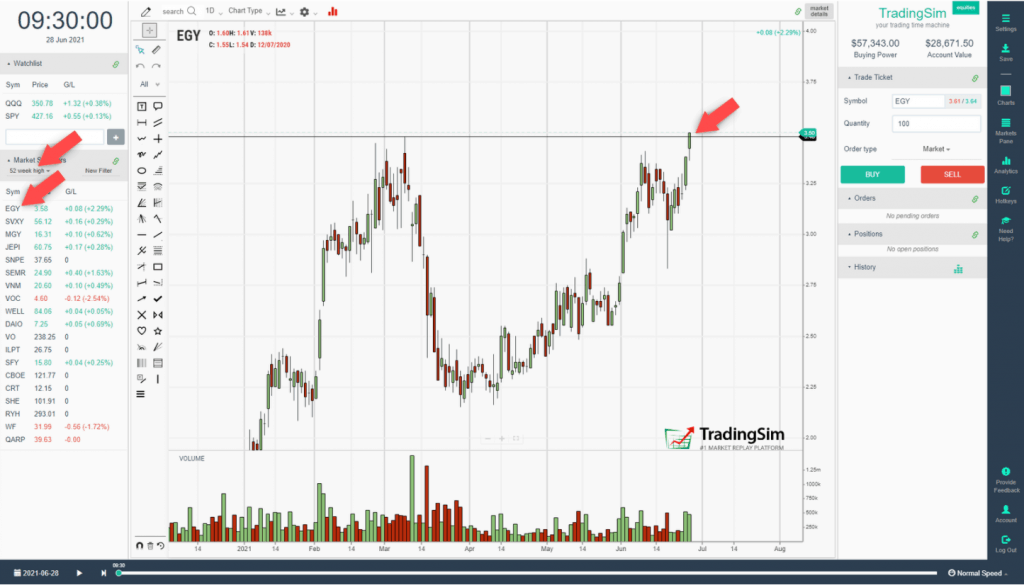
Select the 52 week high button, filter by top volume, name your scan, and then save! The results will populate with potential breakout plays, as seen in this example of EGY below.
52 week high day trading scan result
On the left, we have our list of stocks. Selecting the first one, we see a potential breakout candidate on the daily chart.
Now, it is just a matter of matching the stock’s intraday action with our own day trading strategies.
To do the opposite of this scan, simply choose the 52-week low option.
4. Scanning for Strategies
Speaking of strategies, we’ve come to our fourth and final tip for narrowing down day trading scan results. In all honesty, though, the other scan tips we’ve already mentioned are centered around strategies:
The great thing about scanning for day trades, is that just a handful of simple filters can generate a myriad of ideas. It all depends on what you want to trade.
Have you ever heard of a short squeeze? In light of the meme stock craze lately, short squeezes are becoming a household phrase.
Generally speaking, a short squeeze occurs when too many traders are betting that the stock will go down. They borrow the shares to sell from their broker, and hope to buy back those shares at a lower price, expecting to make money in the opposite direction of bulls.
However, sometimes the bulls smell an opportunity. The more demand they create, the more they “squeeze” the traders betting against the upward momentum.
As short traders are forced to “buy back” the shares they were selling short, the stock price is driven higher and higher.
The GME discussion above was a great example of a catastrophic short squeeze. Many institutions blew up their funds in that trade.
Bloomberg short squeeze headline
But if you want to be long and take advantage of these events, you need to be able to find stocks with a high short interest.
Here’s how we do that:
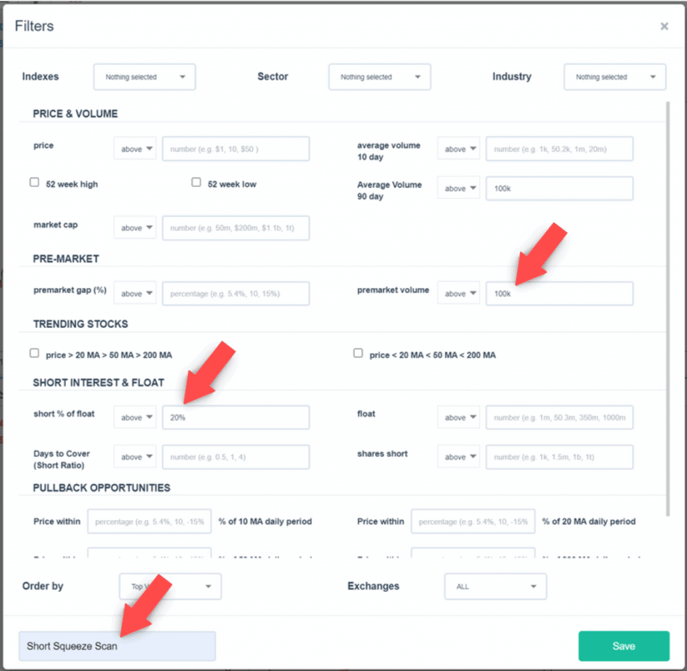
Filtering for Short Squeezes
Inside the TradingSim simulator, we create a new filter.
Short % of Float Scanner
We select a high “short % of float” amount, like greater than 20% in this case. Then we order our results by top volume so as to filter out thinly traded stocks.
The alternative order would be to simply choose “%Gain”. Either one should give good results.
Give the scan a name and save it.
The results should give you plenty of stocks that are being shorted heavily by institutions, but which are also trading with high volume.
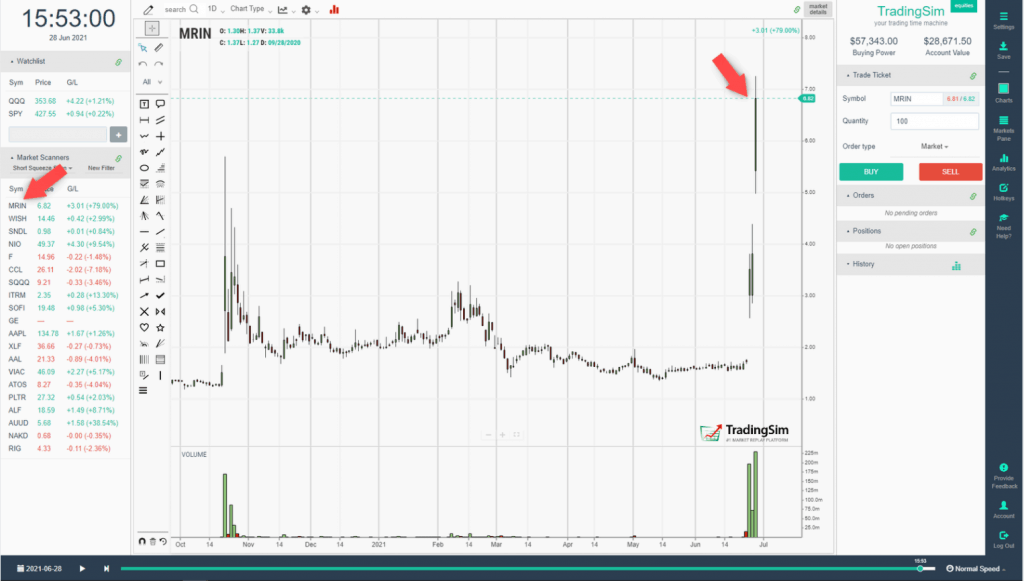
Short Squeeze List Results
For the list we’ve created, notice that the top candidate on our list is MRIN. In the daily chart provided here, we’ve forwarded the time stamp to the end of the day so that you can see just how powerful the move was.
The short interest and demand pressure squeezed shorts for almost a 100% gain that day!
Conclusion
Day Trading Scans can offer traders a multitude of different ways to narrow their focus for the day.
That being said, we understand that not every trader is going to have the same strategy, bias, or techniques. However, we’ve hopefully created some very simple, generalized, yet effective ideas for you.
Feel free to put these filters to the test in our simulator as you practice your day trading strategies, and leave us some feedback on how they’re working for you!
John McDowell is the Lead Content Strategist at TradingSim. His journey into day trading began in 2016 after conversations with a retired hedge fund manager. John is passionate about teaching and educating traders, curating content that helps others succeed in the stock market.
The Liquidity Trap: A Short Seller’s 3-day Nightmare | TradingSim
In the sordid world of low float, lower-priced stocks, a lot of what goes on often defies typical volume and price logic. Often, you’ll see trading firms and high-net-worth traders going head to head...
What Are Meme Stocks? Where were you in January of 2021 when the meme stock phenomenon first started with AMC and GameStop stocks? While these are the two most well-known of the meme stocks, there is...
US Stock Exchange Calendar: Trading Days in a Year 2024
What are the Stock Market Holidays for 2024? It’s a common question that investors have as it seems like the stock market is closed on some holidays but not others. While the New York Stock Exchange...


 Swing Trading Strategies


