Early Morning Range Breakouts – 4 Trading Strategies
Dec 4, 2018
Written by: Al Hill
✓ Reviewed by Kunal Vakil, Co-Founder of TradingSim · Updated Mar 31, 2026
The early morning range breakouts are the bread and butter for many a trader. If you look at trading gurus like Ross Caremoun, Tim Sykes and Steven Dux, they all have a strategy centered around early morning breakouts.
In this article, we will cover four strategies for how to trade early morning range breakouts (EMRB). These are also known as opening range breakouts (ORB).
One last point to note, trading opening range breakouts takes skill. You will need to practice until you can turn a profit. It’s not about rushing into the market swinging for the fences on this one.
I have personally gone into low float movers and have them go against me by 7% in 30 seconds flat. Sounds crazy right?
Well, if you elect to trade highly volatile stocks this is a possibility, so you must be up for the challenge.
The early morning range breakout indicator allows traders to take advantage of the violent action from the flurry of buy and sell orders on the market open.
It’s critical that you don’t come to your computer right as the market is opening looking for breakouts.
You should have been surveying the pre-market looking for the best trading opportunities.
You can take a few approaches when identifying the range. First, you can size up the range again from pre-market trading activity. There should be at least 50k shares or more traded, so you are not over-inflating the quality of the volume in the range.
Trading Ranges
Next, you can then trade the first 20 to 30-minute range or 60-minute.
I prefer both the break of the premarket high or the first 20 to 30 minutes. What I have noticed is the 60-minute breakout can often fall victim to false breakouts.
For new traders, I recommend you either use very little money to trade the high flying stocks or stick with high float, slow movers to get a hang on the mechanics of the market. This ensures you do not risk blowing up your account.
Ideally, the stock should trade within a range, which is smaller than the average daily range of the stock. The upper and lower boundaries of the range can be identified by the high and low of the first 30 or 60 minutes.
If you are trading the pre-market you will want to keep an eye out for the high and low of the session.
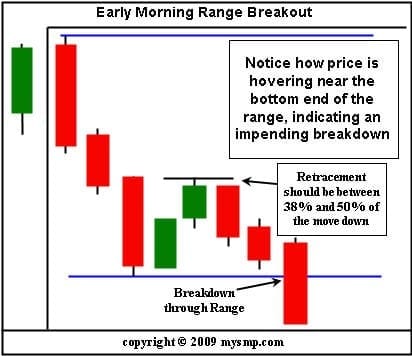
Early Morning Range Breakouts
The idea is to go long on a break above resistance, or short on a break below support. Is it that easy? Not quite. You need to understand how to read the order flow, discern which day trading time zone you are trading within, and understand the volume relationships that are being formed.
Understanding Order Flow
Let’s start with the order flow; the time and sales window will be an invaluable tool for day traders to use to understand if the breakout is real or not. As we have discussed in detail in our lesson on tape reading, it is essential that there is conviction behind a move above or below the range. We need heavy volume but also the right type of volume; meaning, if we have a stock breaking out to the upside, we want to see heavy bids coming into the market rather than heavy offers at these levels. Secondly, different times during the day bring in different types of traders and could result in a perfectly good technical setup, which fights against the prevailing market dynamics at that time.
Price and Volume
Finally, price and volume must be in harmony. If you plan to short a stock, which has gapped down, you want to see the stock gap down on heavy volume and then retrace on lighter volume (indicating a lack of buying). This confirms that the sellers are in control.
The early morning range breakout indicator is a great trade from a risk perspective because you will want to exit the position quickly if there is no continuation after the breakout. Traders should not wait around and hope that the breakout is legitimate even though it has fallen back into the range.
Know When to Get In and When to Get Out
It is paramount that we protect our capital at all times. Learning when to stay in and when to get out is partly following your rules but also being able to process what you see on the tape very quickly. Practice, practice, practice. You will start to feel the market after you get used to trading this type of setup. Be aware that some stocks will have very large bid-ask spreads, which could alter your money management and open you up to higher levels of risk than you are willing to assume.
Trading Early Morning Range Breakouts Tools
First, traders should be aware of the support and resistance levels on a larger timeframe.
Fibonacci and Pivot Points
By using Fibonacci retracement levels and pivot points, you can get a good idea of where your trade will find friction. If this level is too close to your entry, it may be a trade not worth taking or at least one that requires very tight stop loss parameters.
Let’s now go through some of the tools, which assist us during ORB trading: Please remember to apply these levels to your charts for every method mentioned below.
These levels will give you some indication of where price action can pause.
#1 – Volume
Volume is crucial for every type of breakout as it confirms the breakout before entry.
If the equity breaks the morning support/resistance level with low volume, there is a high likelihood the breakout will fail.
Valid Breakout
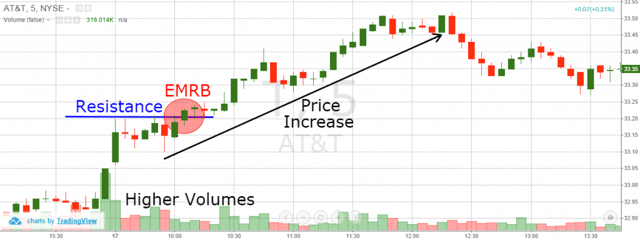
The image below shows how high volume during a breakout is likely to push price through key resistance:
Early Range Morning Breakout – Volume
This is the 5-minute chart of AT&T. In the image, you see that after a break of early morning resistance with high volume, the price starts increasing.
Fake Breakouts
When trading volumes are low, there isn’t enough pressure to push the market to new highs or lows.
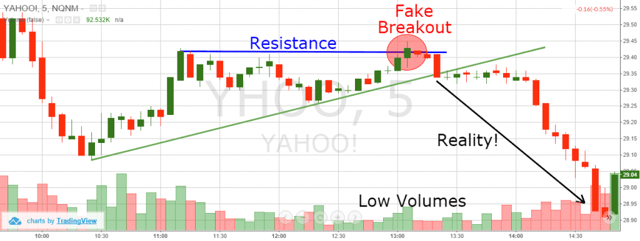
Early Morning Range Breakout – False Breakout
This is the 5-minute chart of Yahoo. The blue line indicates a resistance level. In the red circle, you see a breakout, which later fails.
This breakout occurs with low trading volume, which implies that the breakout is not reliable. As you can see from the chart, within three candlesticks, Yahoo created a bull trap and began to roll over.
The hard thing about using volume as an indicator is that you have split seconds at times to make the call of whether the stock will break higher or rollover.
Volume is tricky in that you only need one or two big orders to come into spike the price. This means you have to be ready to pull the trigger if things are not right.
This is something I struggle with until this very day when things go against me quickly and in a hurry.
#2 – Early Morning Range Breakout Indicator and Trend Lines
Trend lines are one of the basic components in price action trading.
Since the EMRB is all about price action and chart patterns, it is crucial to discuss trend lines for opening range breakout trading. Every time you encounter an EMRB, the price is likely to start moving according to a trend line.
You should hold your trade until the price breaks your trend line in the opposite direction. How simple is that? Let’s see how a trend line applies to the same AT&T chart we used in one of the examples above:
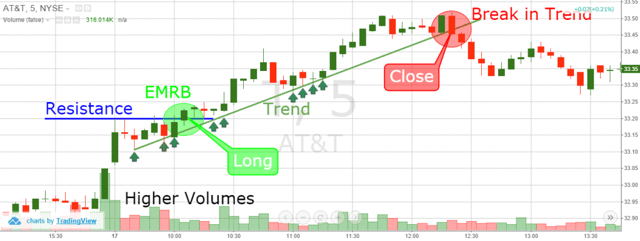
Early Morning Range Breakout – Trend Lines
At the beginning of the chart, you will see two big bullish candles. Then you will see a resistance area formed by the next six candles (blue line). This is what we consider as the early morning resistance and a signal line for a long trade.
Long Position AT&T
We open a long position when AT&T price breaks this resistance in a bullish direction. This happens in the green circle on the chart. As you see, the breakout appears with relatively high volume, which means the breakout is reliable. The next three candles allow us to build a bullish trend line, which is the green bullish line on the chart. Then we follow the trend line with our long position.
As you see, during its increase, the price tests the trend line a few more times. This confirms the credibility of the trend. We close our position when AT&T’s price breaks in a bearish direction through the green bullish trend.
This is a clear example of the trend line breakout trading strategy after an early morning range breakout.
One point to highlight is that if you are trading extremely volatile stocks, the price may move far away from the line. This is where you have to make a decision to either book profits or risk them coming back.
In my experience, you should take profits on each spike higher in thirds. This will allow you to book some profits as the market goes in your favor.
#3 – Early Morning Range Breakout Indicator and the Mass Index (My Least Favorite Strategy)
Another opening range breakout trading strategy is to combine price action with the 25-period Mass Index indicator.
We use the mass index as a trigger for an exit point for the position.
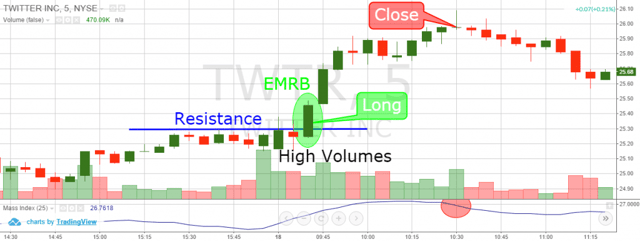
Early Morning Range Breakout – Mass Index
This is the 5-minute chart of Twitter.
There is a clear level of resistance at the blue line.
After the market opens, Twitter breaks through this resistance. At the same time, volumes are high, which is a sign that the break is reliable and we go long. Price immediately starts moving in our favor.
For our sell signal to be activated, the mass index needs to clear 27.
Next, we wait for the MI to break this level in a bearish direction. Six candles after the mass index got above 27 we get our bearish break and exit our trade.
#4 – Early Morning Range Breakout Indicator + Simple Moving Average + Volume Weighted Moving Average (My Favorite!!!)
This is a stock breakout trading strategy based on volumes.
In this strategy, we are going to use the SMA and VWMA.
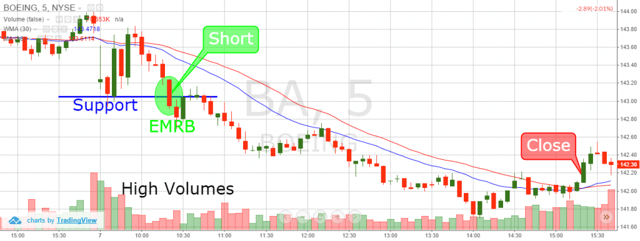
Early Morning Range Breakout – SMA – VWMA
This is the 5-minute chart of Boeing.
The red line on the chart is a 30-period SMA. The blue line is a 30-period VWMA.
On the opening of Aug 7, Boeing has a strong gap down which quickly found support. Later, the price breaks this support in a bearish direction, with relatively high volume, so we short Boeing.
At the same time, the two MAs begin to separate from each other due to higher trading volumes.
We stay with this trade for 59 periods on the 5-minute chart and exit the stock when the two MAs cross, which implies volume has dried up. Notice that when we closed our trade, the volume begins to increase. However, the volume increase is not in the direction of our bearish trend but for the start of a new bullish counter move.
Which EMRB Strategy?
Each of these intraday breakout trading strategies can be profitable if done properly.
Volumes are crucial when trading breakouts. Thus, volumes should always be displayed on our chart for any breakout day trading strategy. It is up to you which volume tool you are going to use – VWMAs, VI, Net Volume, Volume Oscillator, etc. In my opinion, the cleanest way to display trading volumes is by using the plain vanilla volume indicator.
The EMRB + Trend Lines opening range breakout indicator strategy is very easy to understand and perform. It is basic and sometimes the signals it provides might not be enough.
The EMRB and mass index is ok if you like scalping. Again, this is my least favorite of the strategies mentioned in this article.
The EMRB strategy I like the best is the combination of the VWMA and SMA. This strategy will keep us in trades long enough to catch the bulk of the trend.
In Conclusion
EMRBs are breaks in support or resistance levels right after the market opening hours.
Volumes are crucial when trading early morning range breakouts because volume can help filter false signals.
A breakout should be considered reliable, only if it happens during relatively high volumes.
Breakouts during low volumes might give you a false signal.
Always include a volume indicator when trading EMRBs.
Some of the successful EMRB trading strategies include pairing with the following indicators:
Volume
Trend Line
Mass Index
VWMA and SMA
Each of these four strategies also includes a volume indicator.
Each of these four strategies is profitable if executed properly.
I recommend a trading combination of EMRB + VWMA + SMA
For a different perspective on opening range breakouts, check out this article from Kunal Desai from bullsonwallstreet.com.
Alton Hill is the Co-Founder of TradingSim with over 18 years of trading experience. He completed the Design Thinking Bootcamp at Stanford’s D.School and brings expertise in Product Development to create the best trading simulation experience. His strategy focuses on trend-following systems, targeting high-volatility stocks with strong primary trends using the 15-minute chart.
How to Trade with the ADX – (Average Directional Index)
ADX Overview The ADX (Average Directional Index) is a creation from technical analysis legend J. Welles Wilder. It’s clear that Wilder was attempting to do two things with the ADX indicator: inform a...
Learn the Best Momentum Trading Strategies for Day and Swing Trading
What is Momentum Trading? Momentum Trading Unlike other traders or analysts who dissect a company’s financial statements or chart patterns, a momentum trader is only concerned with stocks in the...
How to Trade Using the Average True Range Indicator
Story Highlights The average true range (ATR) is a great tool for determining the level of volatility across stocks to align your investment choices with your risk profile. The ATR should not be used...


 Day Trading Indicators


