The stick sandwich is one of the rarer three-candle candlestick patterns — a middle candle of one color sandwiched between two candles of the opposite color, with both outer candles closing at the same price. Most traders misread it because of the naming convention. A “bullish stick sandwich” is actually a continuation lower; a “bearish stick sandwich” is a continuation higher.
This guide covers the structure of the pattern, the right way to trade both variants, real chart examples, and how I pair the stick sandwich with confirmation tools like MACD, RSI, and VWAP.
In This Guide
The exact rules of the stick sandwich.
Why the “bullish” version is bearish and vice versa.
Candlestick patterns have been around for centuries. They are very useful in finding reversals and continuation patterns on charts. While we discuss them in detail in other posts, in this post we will focus on the stick sandwich pattern.
Stick Sandwich Definition
The stick sandwich candlestick pattern can occur in both bull and bear markets or intraday. The pattern consists of three candlesticks, where one candlestick has an opposite-colored candlestick on both sides. The closing prices of the two candlesticks that surround the opposite colored candlestick must be same.
Think of it this way: it’s like an engulfing candle that gets reversed yet again.
Bearish Stick Sandwich Charting Example
The bearish stick sandwich is a rare candlestick pattern. Despite its name, it isn’t a bearish pattern. It simply means the bearish engulfing candle gets sandwiched.
The first candlestick in the formation is a long white (green) candlestick that closes near its high. The second candlestick is a black (red) candlestick that gaps down from the previous close and closes below the previous day’s open. The third candlestick is a white (green) candlestick that completely engulfs the second candlestick and has the same closing price as the first candlestick.
Bearish Stick Sandwich
Notice how the bearish engulfing candle in the middle is sandwiched on either side by bullish candles, and eventually continues trend upwards. Traders should wait for the low of the third candlestick to be broken prior to taking any short positions.
Bullish Stick Sandwich Charting Example
Like the example above, the bullish stick sandwich is not actually bullish. It is bearish.
The bullish stick sandwich is a rare candlestick pattern. The first candlestick in the formation is a long black (red) candlestick that closes near its low. The second candlestick is a white (green) candlestick that gaps up from the previous close and closes above the previous day’s open. The third candlestick is a black (red) candlestick that completely engulfs the second candlestick and has the same closing price as the first candlestick.
Bullish Stick Sandwich
Traders should wait for the high of the third candlestick to be broken in the bullish stick sandwich formation prior to taking any long positions.
Let us now review real-life chart examples of the stick sandwich candlestick pattern. Again, the stick sandwich can have a bearish or bullish characteristic.
This is the 5-minute chart of AAPL from January of 2022. In the blue circle, you see the bullish candlestick being engulfed by two bearish sticks.
The first candle of the pattern is bearish and closes near its low. Next, a bullish candle develops with a small gap and closes above the first candle of the pattern.
The third candle is bearish and fully engulfs the bullish candle. The last sign of the bullish engulfing stick sandwich is that the third candle closes near the closing price of the first candle. or lower.
After the pattern completes, the price reverses sharply to the downside over the next couple of minutes.
This is the 5-minute chart of TSLA from January 2022.
After a price decrease, TSLA begins to form a bearish engulfing stick sandwich candlestick pattern.
The first bullish candle closes near its high. Then the second candle is bearish, gaps down from the previous candle, and closes near the bottom of its range.
The third and final candlestick almost engulfs the second candlestick and closes near the closing price of the first candle of the pattern. The final candle launches the reversal, as you can see.
After the confirmation of the pattern, the stock begins an impulsive move higher, resulting in a $30 increase.
How to Manage Risk when Trading the Stick Sandwich Pattern
Now that you can recognize the stick sandwich candlestick pattern on the chart, let us now cover a few methods for how to manage risks when trading the pattern.
How Much Should You Risk?
There is a common saying that equity traders should not risk more than 2 to 3% of their capital in a single trade We believe this is a wise approach to risk management.
Now, if we use the premise of a maximum drawdown per trade of 1% with a success rate of 20%, what would be the results?
Imagine you have a bankroll of $10,000 and instead of risking 3%, you only risk 1% of your capital per day trade; this means that a single trade could result in a maximum loss of $100.
You use a trading strategy, which gives you a 20% success rate, which is 1:5 ratio.
At the same time, your strategy gives you a 6:1 risk-to-return ratio, or a 6% price target per trade.
Some of you will instantly say “Hey! This system will not work and you will surely lose your bankroll!”
Let us now calculate the results from five consecutive trades using this money management strategy starting with $10,000 in capital.
Your first trade is a loser and results in a $100 loss.
First, you invest $9,900 in an unsuccessful trade. You lose $99.
Next, you invest $9,801 in an unsuccessful trade. You lose $98.01.
Then, you invest $9,702.99 in an unsuccessful trade. You lose $97.02.
Lastly, you invest $9,605.96 in a winning trade. Your trade is a 6% winner resulting in your account shooting back up to $10,182.32.
This is how a strategy with only a 20% success rate can actually turn into a profitable trading system.
Higher Winning Percentages
Granted, it will be difficult for some people to trade like this. That’s a lot of losing to absorb mentally and emotionally. For some, we to constantly feel the money flowing into our account. After 4 or 5 consecutive losers, you might become susceptible to bending your rules to account for the losses.
If you suffer from the need to win frequently, then this approach will not work for you.
Now, shifting gears back to our stick sandwich candlestick pattern. Since it is a three-candle formation, it is considered more reliable than the two or one candlestick patterns.
For this reason, it is likely to give you at least a 50% success rate versus the 20% as illustrated above. You of course will need to test out the strategy to find the right level of risk/reward for you, but the math supports the theory that you can turn a profit.
Where to Place a Stop Loss when trading the Stick Sandwich Reversal Patterns
When you trade stick sandwich candlestick formations, you should always use a stop loss. On that token, with any trading system – you must use a stop loss!
No matter how good you think you are, at some point, the market will take you for a ride if you let it.
Back to how to place a stop loss with the stick sandwich formation, you should place the order right below the low of the bearish engulfing candlestick pattern and the high of the bullish engulfing candlestick pattern.
Bearish Sandwich Trading Example
This is the same TSLA chart from the previous example, but this time we have placed a stop-loss order below the bearish engulfing stick sandwich candlestick pattern.
The great thing about the stick sandwich pattern is that you can keep a tight stop. This way you can increase your risk to reward ratio on each trade.
Taking Profits when trading the Stick Sandwich Reversal Pattern
The suggested price target for the stick sandwich candlestick pattern is three times the size of the formation.
Once the stock has moved three times the size of the formation, there are two simple tactics you can use to take profits:
Close a portion of the trade (one-third or half). This way if the price starts moving against you, you have booked profits and limited your downside risk. (On a positive note, if the stock continues higher, you can take advantage of the upside without the stress of carrying the entire position.)
Adjust your stop-loss order below the low of the candlestick, which hits the price target. Now that you have placed your stop, you can then use a simple moving average or price action to keep you in the trade.
Putting it All Together
Let’s now put it all together to illustrate how to trade the stick sandwich candlestick pattern.
Bullish Stick Sandwich Trading Example
This is the 5-minute chart of TSLA, illustrating a bearish engulfing stick sandwich (highlighted in the blue circle).
The first candlestick in the formation is bullish and closes near its high. The second candlestick opens with a gap and closes below the first candlestick.
The third candlestick is bullish and nearly engulfs the second candle – closing at approximately the same level of the first candlestick.
Everything looks great based on the requirements of the formation and we go long, with a stop-loss order right below the low of the pattern.
TSLA starts moving higher as expected and reaches our price target of three times the formation, 25 minutes after opening the trade.
Once reaching our price target, we adjust our stop-loss order below the candle that hit the target.
Notice that the price starts to roll over for a time, but our stop loss remains untouched and TSLA is able to rally higher.
However, we see topping action and a hammer reversal pattern, which implies that this might be the end of the trend. For this reason, we adjust our stop below the hammer candle as shown on the image (Stop 3). We can also close out the position as it is the end of day.
Conclusion
The stick sandwich candle pattern is a rare chart occurrence where two candles sandwich another one.
The pattern has a reversal characteristic.
The sandwich pattern is a rare chart occurrence.
When we trade a sandwich candle pattern, we should pursue a minimum profit equal to three times the size of the formation.
A stop loss should be placed below the pattern.
A proper stick sandwich trading strategy should lead to at least a 3:1 return-to-risk ratio.
To practice this, there is no better way than to search for these patterns in the simulator. Also, be sure to check out our tutorial and cheat sheet on candlestick patterns!
Confirming a Stick Sandwich Trade
The stick sandwich is a lower-frequency pattern, so I never trade it alone. These are the confirmation tools I layer on top:
MACD direction. The pattern should fire in the direction of the MACD slope.
RSI not at extreme. If RSI is already > 80 or < 20, the continuation move is usually exhausted.
Relative volume. The third candle should print on RVOL > 1.0 to confirm participation.
VWAP alignment. Price should be on the correct side of VWAP for the bias you’re taking.
Higher-timeframe trend. Continuation patterns work better when they align with the daily/weekly direction.
Entry, Stop, and Target Rules
The mechanics are the same for both variants — only the direction changes:
Wait for the break. Don’t anticipate. Take the trade only when price closes outside the third candle’s range.
Stop placement. Place the stop just beyond the opposite extreme of the third candle. This gives the trade room without inviting noise.
First target. Use the height of the third candle, projected from the entry. Solid 1:1 risk/reward.
Second target. The next major support or resistance level — a swing high/low, prior gap, or daily pivot from our pivot points guide.
Manage with structure. If a counter-pattern like a shooting star or doji prints against you, tighten the stop.
Related Candlestick Patterns
If the stick sandwich is in your toolkit, these patterns are worth learning next:
3 Bar Play — another three-candle continuation pattern, more reliable than the stick sandwich.
Inside Day — coiling action that often precedes a breakout in either direction.
Harami — the mirror image: a small candle inside a larger one.
Trading the name, not the structure. The “bullish” stick sandwich is a continuation lower. Read the structure, not the label.
Anticipating the breakout. The pattern only triggers on the break of the third candle. Wait.
Ignoring the higher timeframe. A continuation pattern needs an actual prevailing trend to continue.
Using it on illiquid instruments. Wide spreads kill the risk/reward.
Confusing it with engulfing. See the FAQ below for the difference.
Frequently Asked Questions
What is the stick sandwich candlestick pattern?
The stick sandwich is a three-candle pattern where a middle candle of one color is 'sandwiched' between two candles of the opposite color, and the two outer candles close at the same price. It's typically a continuation pattern, not a reversal pattern, despite the visual.
Is the stick sandwich bullish or bearish?
Naming is confusing here. The 'bullish stick sandwich' (red-green-red, sandwiching a green candle) is actually bearish, because the third red candle confirms the prevailing downtrend. The 'bearish stick sandwich' (green-red-green) is bullish, because the third green candle confirms the uptrend. Always trade what the third candle confirms, not the name.
How reliable is the stick sandwich pattern?
It's one of the lower-frequency, lower-reliability candlestick patterns. Most traders use it only as a confirmation signal alongside other tools — moving averages, support/resistance, RSI/MACD divergence, or volume. Treat it as one input among many, not a standalone trade trigger.
How do I trade a stick sandwich?
Wait for the breakout. For a 'bullish stick sandwich' (continuation lower), enter short when price breaks the low of the third candle. For a 'bearish stick sandwich' (continuation higher), enter long on a break of the third candle's high. Use the opposite extreme as your stop, and target the next swing level or pattern-based projection.
How does the stick sandwich differ from an engulfing pattern?
A bullish engulfing is a two-candle reversal pattern where a green candle fully engulfs the prior red one. The stick sandwich is three candles and is a continuation pattern. The middle candle of a stick sandwich is essentially an engulfing setup that gets reversed by the third candle — which is why we treat it as continuation rather than reversal.
Practice the Stick Sandwich Risk-Free
The fastest way to internalize any candlestick pattern is reps. Load past trading sessions into the TradingSim replay simulator, set the timeframe to 5-minute or daily, and step through bar by bar until you can spot stick sandwiches in real time. Start a free trial.
Alton Hill is the Co-Founder of TradingSim with over 18 years of trading experience. He completed the Design Thinking Bootcamp at Stanford’s D.School and brings expertise in Product Development to create the best trading simulation experience. His strategy focuses on trend-following systems, targeting high-volatility stocks with strong primary trends using the 15-minute chart.
Top Tips for How to Day Trade the Cup and Handle Pattern
Video Example of a Day Trading Cup Breakout The below video breaks down another working example of the Day Trading Cup Breakout. This article is a review of the day trading cup breakouts strategy...
Step-by-Step Guide to Trade the Rounding Bottom Pattern
The rounding bottom pattern is a technical setup for the patient trader. This is because the pattern can take quite a bit of time to develop before any significant price moves begin. In this article,...
The Shooting Star Candlestick Pattern & the Hammer Candlestick Pattern [Updated May 2026]
The shooting star is a single bearish candlestick pattern that is common in technical analysis. The candle falls into the “hammer” group and is a first cousin of the – hanging man, hammer, and...


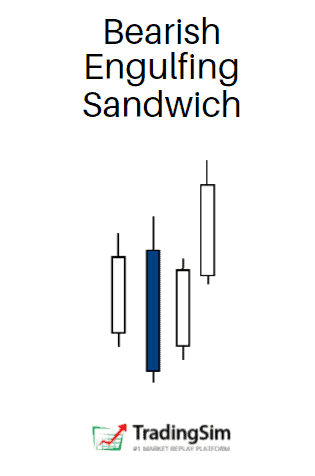
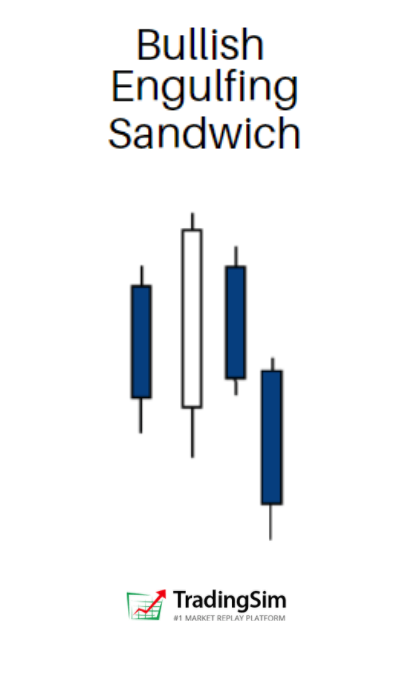
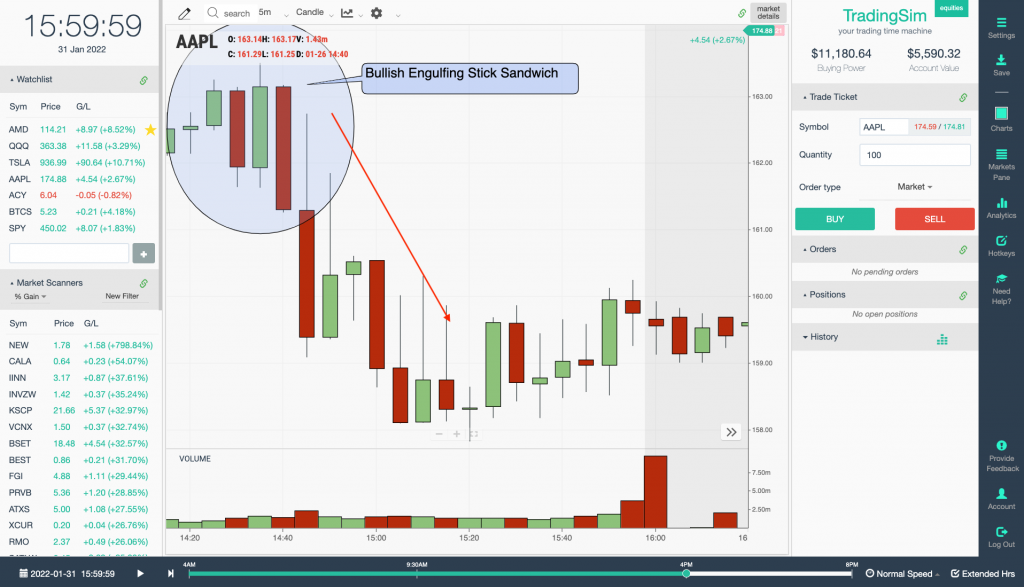
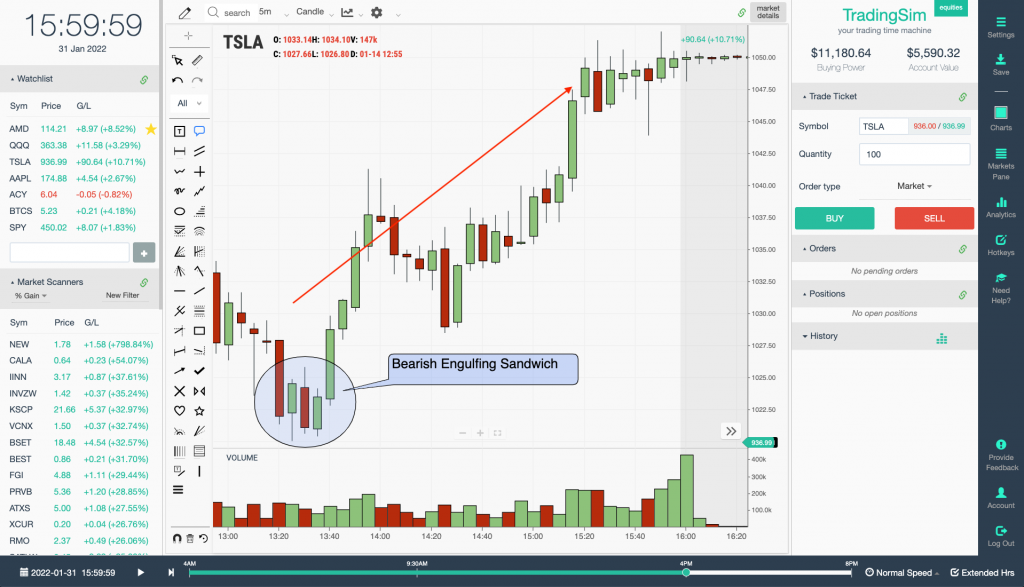
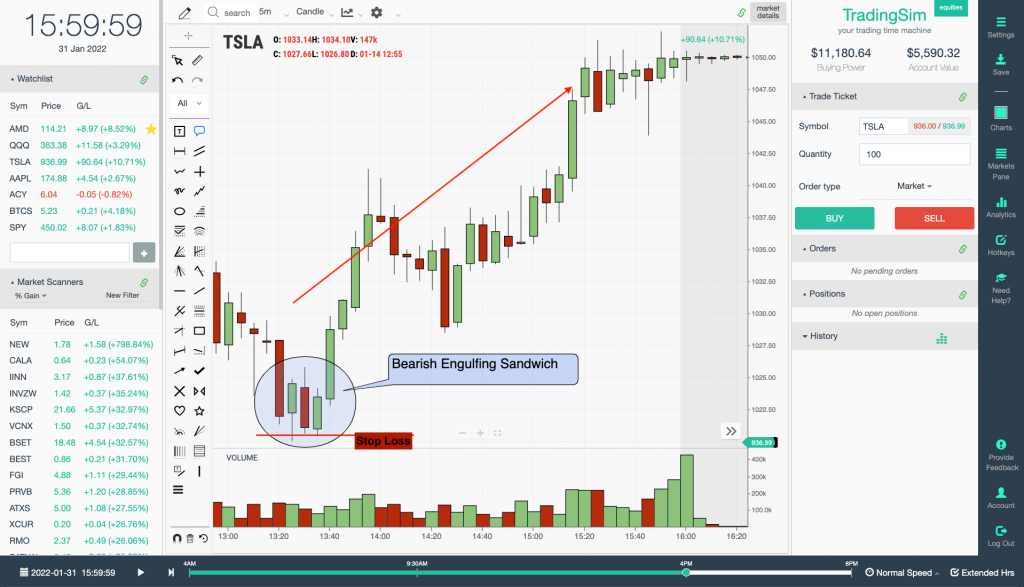
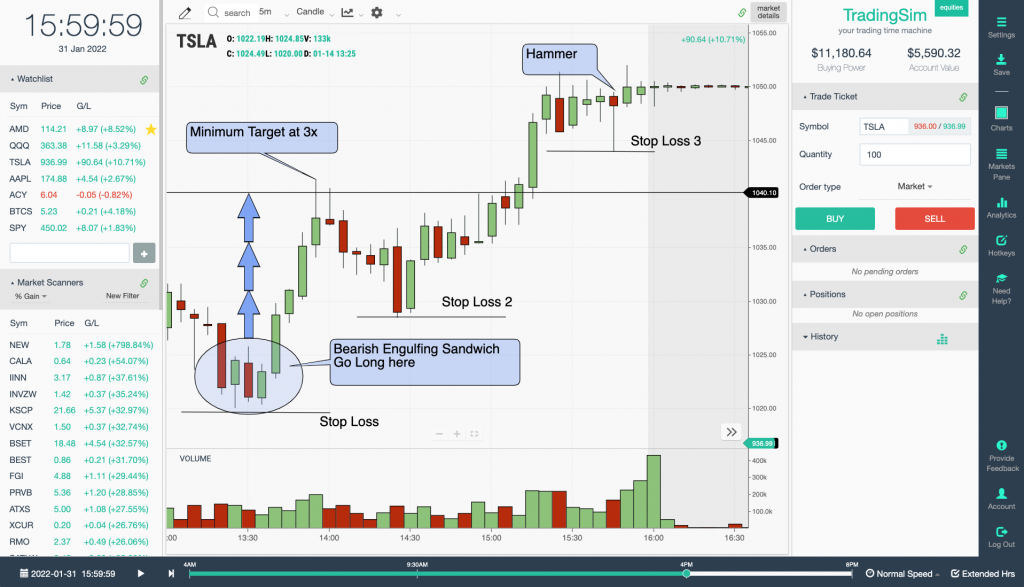
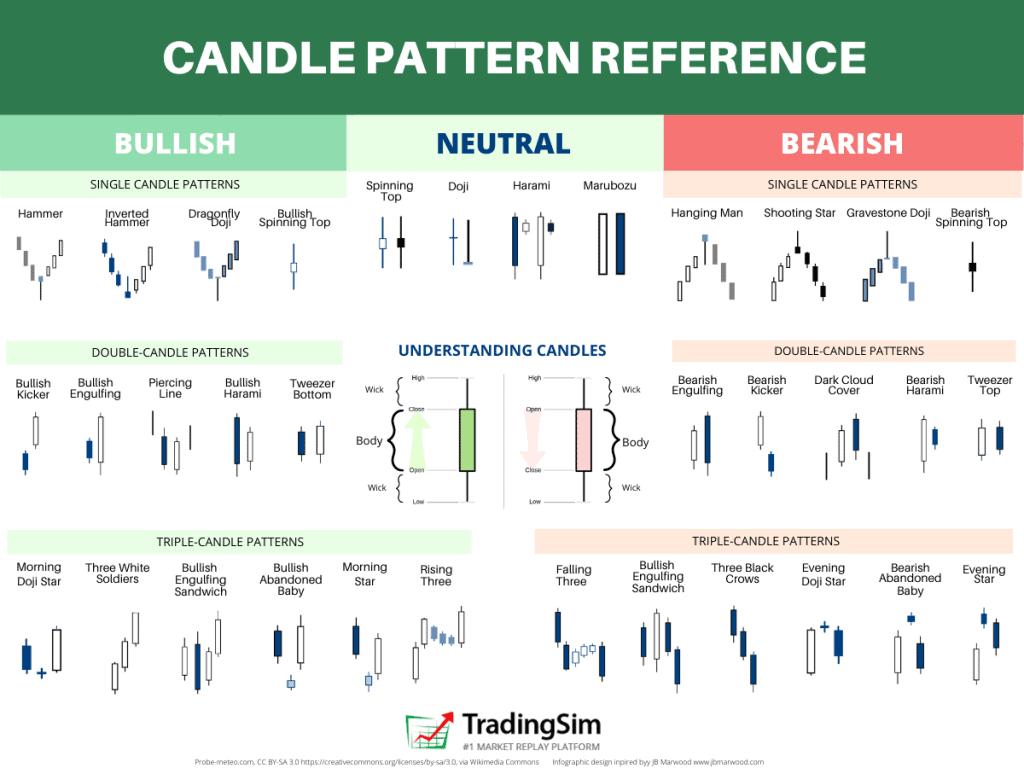


 Chart Patterns


