How to Day Trade the Bearish Gravestone Doji Reversal Candlestick
Jun 7, 2021
Written by: Al Hill
The doji candlestick is one of the most common candlestick reversal patterns you will find in the market. The Gravestone Doji is a variation of this reversal pattern. When correctly confirmed, the Gravestone Doji can lead to great opportunities for profit in day trading.
In this post, we’ll cover how to trade the Gravestone Doji with real examples, plus strategies on how to enter trades and manage risk based on this popular indicator.
7 Steps to Graveston Doji Trading Success
How is the Gravestone Doji Formed
The Gravestone Doji is a candlestick bar whose open, low, and close all culminate at the low of the bar.
As the name implies, imagine looking at the side profile of an actual gravestone. Hence the long upper wick and the narrow base at the bottom reflect what a gravestone would look like from the side. The Japanese were fond of naming candlestick patterns for their likeness in real-life.
You might also say that a Gravestone Doji represents the gravestones of the bulls that have died defending their territory.
Its bullish counterpart is the Dragonfly Doji. We cover this pattern in another post.
The psychology behind the candle is that the bulls were in control in the beginning. They drive the price of the security up to an unsustainable level. From there, the bears take control and are able to sell the security down to its low by the end of the session.
Contextually, when this occurs at the highs of an extended uptrend, we interpret this as exhaustion. This gives us the confidence to take a short position when all criteria are confirmed.
Charting Example of Gravestone Doji
Now that you have an understanding of the setup, let’s review a real-life chart example.
Bearish Reversal Candle Example
Above is a classic Gravestone Doji at the end of an uptrend.
Showing up this late in the uptrend, it was an early sign that the bulls were losing control and a price drop was likely on the horizon.
Once the bears took control, this led to heavy selling on high volume.
Our job as traders is to use these price analysis tools to help us take advantage of opportunities like this.
While this first example covers a bearish reversal setup, we can find some examples as continuation patterns. It is essentially the same as a reversal, just on a smaller rally.
Bearish doji downtrend continuation pattern
Note the attempt to rally here, only for bears to quickly reassert their dominance in the downtrend. Markers like this can offer opportunities to add to short positions with confidence as you manage the down-trending trade.
Trading the Gravestone Doji
Now that we have covered the basics, let’s dive into a trading example.
It is important to mention that the risk management rules for this strategy will vary due to the size of the wick. We will cover this in more detail shortly.
Entering a Gravestone Doji Trade
Whenever you see a Gravestone Doji appear in the context of a bullish uptrend, this should give you reason to pause as the trend reversal could come at any time!
Once you identify the candlestick pattern, you will want to find a trigger that lets you know when to enter the trade.
A simple trigger is the low of the candlestick. Once a candle closes below this level, you can open a short position.
Doji Trigger Line
In the image above, we outline the trigger line that shows the exact moment when you should short the stock after identifying the doji candle.
The reason you want to wait for a close below that line is clear. We see a slight hesitation comes on the next candle, which is relatively small and doesn’t manage to break the trigger line.
What if this had continued higher?
Let’s look at the example from above one more time to see when that might occur:
Bearish Reversal Doji Candle Example
Notice that the first reversal doji gives us a false confirmation. We never close below the candle. It is the second doji that puts the nail in the coffin, no pun intended.
Thus, the short signal comes on the second candle after the doji with a break and close below the trigger line.
Risk Management when Trading the Gravestone
When you trade the Gravestone Doji, you need to determine where to place your stop loss order.
The proper location of a stop loss is above the high of the Gravestone Doji candlestick.
The one caveat, as we mentioned earlier, is that for each Gravestone Doji, your level of risk will vary depending on the length of the candlestick wick.
Bearish Gravestone Doji with Stop Loss and Trigger Line
This is the same sketch from above. However, this time we have added the location of the stop loss order.
For this particular candelstick pattern, we have devised a method for how to set profit targets for when to exit the trade.
Bearish Gravestone Doji with Profit Target
Ideally, we want to have our reward be at least double our risk. For that reason, here is a simple calculation:
The fist profit target equals the size, or range, of the doji candle. This would give us a roughly 1:1 reward/risk ratio. Not ideal, but at least we can lock in some profits.
The second profit target is double the size of the gravestone doji. This will get us closer to a 2:1 reward/risk ratio. Much better.
You will need to determine which profit target to use based on the volatility of the chart and the range of the Gravestone Doji wick.
Risk Management after Reaching Target 1
When the price reaches the first target, you can either decide to exit the trade, or wait to see if target two is reached.
A simple method for protecting your portfolio if you want to chase the big gains is to move your stop to breakeven after the first target is reached.
If you find yourself emotional, take a small portion like 1/4 of your position and bag those profits. This way, if you move your stop lower, you’ll never be red on the position, giving you patience to let it work.
Trading with the Gravestone Doji Candlestick Pattern
Now that we’ve summarized all the basic rules required to trade the Gravestone Doji candle, we will now cover a few real-life trading examples.
Example 1
Graveston Doji Trading Example 1
Above is a 2-minute chart of AT&T intraday.
The trend is upward with a last push to increase price only to close lower. The result is a Gravestone Doji reversal candlestick.
The next candle after the doji breaks the trigger line, therefore we open a short position.
Our stop loss should be placed above the high of the gravestone doji to ensure we protect ourselves if the trade goes against us.
For this example, we are going to go with twice the size of the Gravestone Doji as our profit target.
Eight minutes later, AT&T reaches our initial target. At this point we could exit the trade and book our profits. The other option is to wait for a further price decrease and exit the trade later.
Profit targets will vary for different traders. Here at Tradingsim, we like to exit at the profit target. Our reasoning is that the stock market moves extremely fast, and you may not have the luxury of waiting on a bigger move.
In addition, there is the psychological strain of always wanting more, but never quite getting all of a move.
Of course, this can depend on the bigger picture and how oversold the stock is on multiple time frames. In this case, it may be worthwhile to wait for lower lows.
Patience can pay off sometimes, just don’t let the trade become a headache.
From our example above, once you wait for more, AT&T reversed and moved higher only to stop us out of the position.
Let’s now take a look at another trading example.
Example 2
This is the 2-minute chart of Visa. The image shows another Gravestone Doji trading example; however, this time the results are more favorable than our first trading example.
Gravestone Doji Example 2
The price action is very similar to our last trading example, but in this case the stock does not reverse after hitting our target, but rather continues lower.
Patience paid off.
Our initial target is located at a distance equal to twice the size of the doji pattern — shown by the blue line. This gives us a 2:1 Reward/Risk ratio, or “2R”.
While the price reaches our initial target on the chart after 6 minutes, we adjust our stop loss and hold the position in hopes of more profits.
Ultimately, we were correct and the price breaks down further to make new daily lows. We exit the trade after we see two bullish candles in a row, our signal to exit.
We nearly doubled our profits!
Tutorial Review
Let’s review a few bullet points on how to spot the Gravestone Doji pattern and trade it with success:
The Gravestone Doji candlestick pattern is a reversal formation, which usually comes at the top of a bullish trend.
The psychological factor behind the pattern says that the bulls bring the equity to an unsustainable level, where the bears take over.
Visually, traders say that this pattern symbolizes the side profile of a gravestone for the bulls.
You should short the stock when a candle closes below the tiny body of the Gravestone Doji.
A stop loss should be used for every gravestone doji. This stop loss should be placed above the highest point of the candlestick.
You have two options for setting profit targets when trading the gravestone doji:
Seek a price move equal to the size of the formation. I recommend this for longer gravestone doji candles.
Pursue targets equal to twice the size of the gravestone doji. This is a better option when the doji candle is smaller.
After your initial target is reached, be patient if the stock keeps trending in your favor. But follow these two simple rules:
Adjust your stop above the initial target.
Stay in the trade until you see two bullish candles in a row. This hints that the bearish move might be over.
How to Practice the Gravestone Doji
As with any pattern or strategy in the stock market, it takes time and effort to recognize them in real-time.
We recommend trading in a simulator with at least 20 successful attempts on this bullish reversal pattern before employing real money in the market.
Once you have your dataset, you can measure your success. Then you will have confidence to take the trade knowing your ratio of wins to losses!
The Head and Shoulders Pattern: How to Trade Tops and Bottoms
The Head and shoulders pattern is a reversal trading strategy, which can develop at the end of bullish or bearish trends. It is often referred to as an inverted head and shoulders pattern in...
What is the Kicker Candlestick Pattern? The kicker formation is a reversal pattern that starts with a candle in the direction of the primary trend, followed by a gap contrary to the trend. Talk about...
Day Trading Setup – Three Bar Reversal and Go This article is going to discuss a very simple, yet powerful day trading strategy that is used to capitalize off the greed and fear from novice traders....

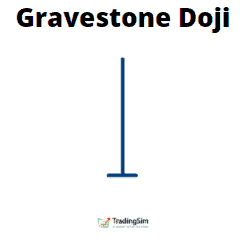

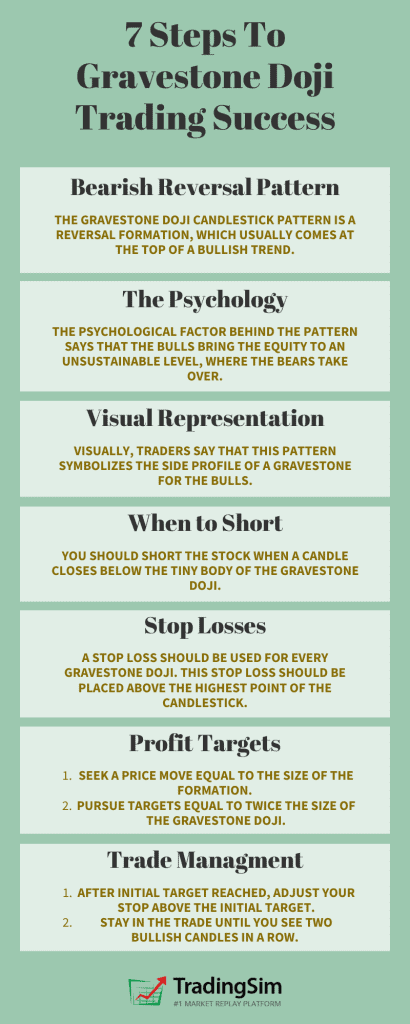
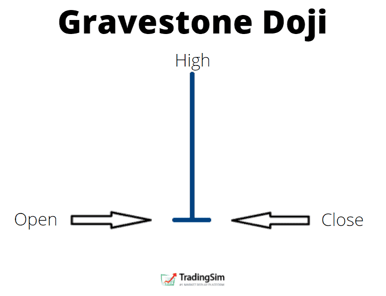

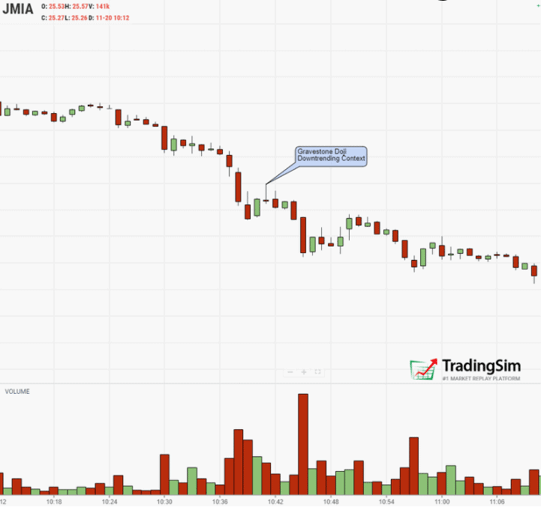
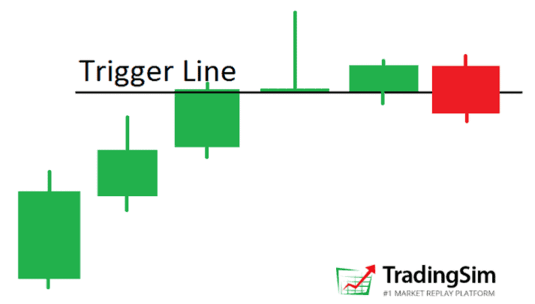
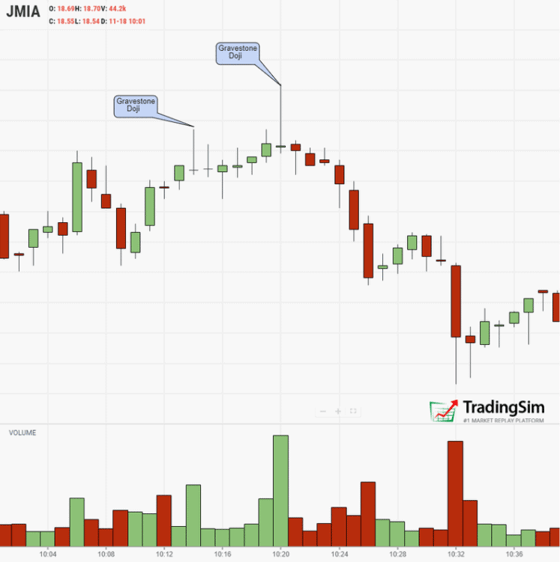
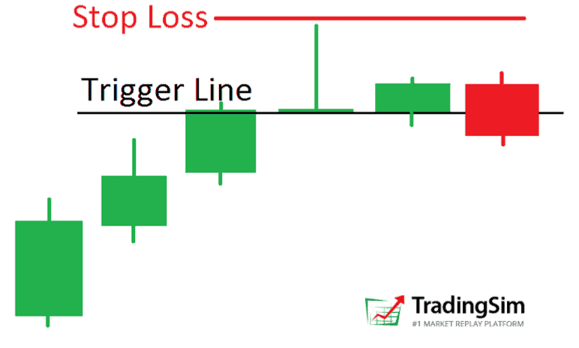
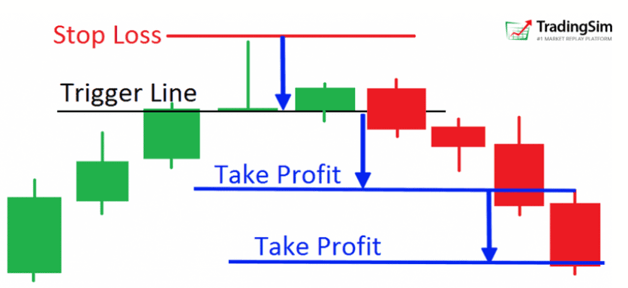
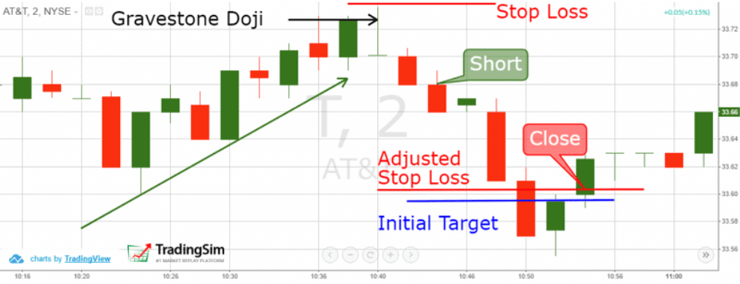
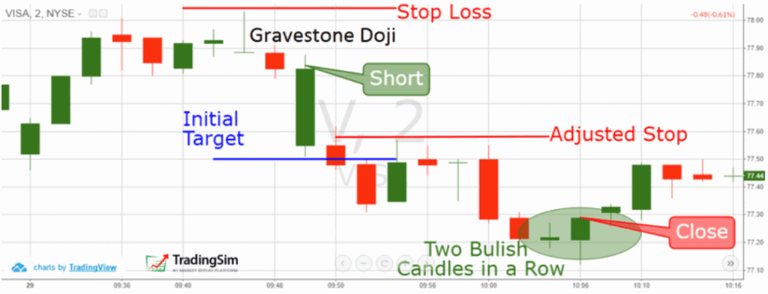


 Chart Patterns


