Relative volume for day trading explained
Relative volume is one of the most important indicators for day traders. It can help you determine when a stock is getting ready to make a move, and it can also help you spot liquidity gaps.
This blog post will explain what relative volume is and how you can use it to improve your trading performance. We'll also provide some examples to help illustrate how relative volume works.
So let's get started!
What is Relative Volume?
If you're new to day trading, you might be wondering what relative volume is and how it can be used to your advantage. Simply put, relative volume is a measure of the amount of trading activity in a stock relative to its average level of activity over a given period of time.
So, if a stock typically sees an average of 300,000 shares traded per day but suddenly sees 1,000,000 shares traded in a single day, that would be considered high relative volume.
Relative volume can be used as a technical indicator to help you identify potential breakout stocks.
For example, if you see a stock with consistently high relative volume but relatively low price movement, it could be an indication that the stock is about to make a big move.
What is relative volume (RVOL)? Relative volume (RVOL) is a trading indicator that compares a stock's current trading volume to its average volume over a specified period, typically 10 to 20 days. An RVOL of 2.0 means the stock is trading at twice its normal volume. Day traders use RVOL to identify stocks with unusual activity that may signal significant price movement. RVOL above 1.5 is generally considered elevated, while RVOL above 3.0 often indicates a major catalyst event.
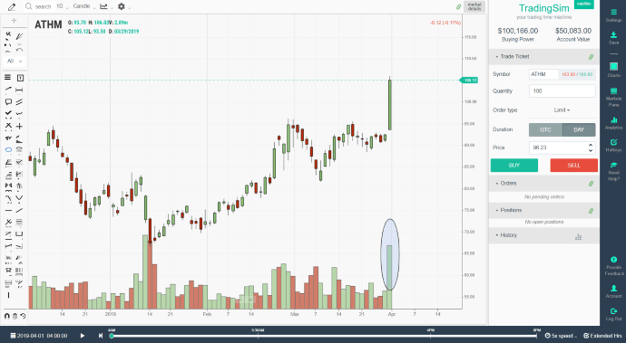
ATHM with high relative volume (RVOL)
How is relative volume calculated?
RVOL, or Relative Volume, is a technical indicator that measures the average volume of a security over a specific period of time, usually 10 days. RVOL is calculated by dividing the security's current volume by its 10-day average volume. The ratio of that 10-day period would be equal to 1.0.
How to calculate RVOL: RVOL = Current Volume / Average Volume over N periods. For intraday trading, compare current volume at a specific time of day to the average volume at that same time of day over the past 10-20 sessions. This time-weighted approach gives more accurate readings than simply dividing total daily volume, since volume is naturally higher at market open and close.
If a security with an RVOL ratio of 1.0 over a 10-day period suddenly increases to 2.0, it has twice the average volume, essentially. Likewise, if a stock's RVOL measures 0.50, then it has half the RVOL of the prior 10-day average.
The indicator can be used to identify stocks that are trading above or below their historical averages, which can be helpful in making trading or investment decisions.
For example, if a stock has an RVOL of 2.0 and is trading at $10, it may be worth considering as an investment since it is trading at twice its average volume and may be due for a price increase. However, if the same stock has a RVOL of 0.5 and is trading at $10, it may be overvalued since it is trading at half its average volume and may be due for a price decrease.
While RVOL is not the only factor to consider when making investment decisions, it can be helpful in identifying stocks that are trading above or below their historical volume averages.
Similarly, RVOL is often used to determine what stocks are in play for day traders. If stock doesn't have a high RVOL, it is more than likely less liquid and therefore out of play for any momentum trading strategies.
How to find the relative volume of a stock?
In order to find the relative volume of a stock, you must either calculate the RVOL yourself, or subscribe to a charting service or broker who performs the calculation for you.
Anyone who's interested in stocks has probably heard the term "volume" before. But what is volume, and why is it important? In short, volume is a measure of how much trading activity is taking place in a stock or other security. It's important because it can give you clues about the level of interest in a particular stock and whether that interest is increasing or waning.
There are a few different ways to measure volume, but one of the most common is to simply look at the number of shares that have been traded over a certain period of time, such as a day, week, or month.
You can usually find this information on financial websites or through your broker.
You can calculate relative volume by dividing the stock's current volume by its average volume. A reading above 1.0 means that there's more activity than usual, while a reading below 1 indicates less activity than usual. Keep in mind that volume isn't always an accurate indicator of a stock's performance.
Another way to present RVOL data is to show it as a percentage. As you can see in the order montage window below, the RVOL for this symbol was extremely high compared to prior days, at 4056%.
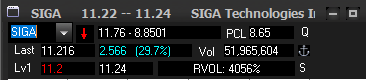 DAS RVOL Montage Data
The benefit of having a broker or chartin service do the calculation for you is that they typically update this in real-time as new volume metrics arrive throughout the trading day. This allows you to see how the RVOL on an intraday basis is changing as the price of the stock changes.
How to find relative volume in thinkorswim?
When you're trying to find the relative volume in thinkorswim, there are a few different steps that you'll need to follow.
First, you'll want to select the 'Charts' tab at the top of your screen. Once you're in the Charts tab, you'll want to choose the 'Studies' drop-down menu and select 'Edit Studies.'
After you've selected 'Edit Studies,' a new window will pop up on your screen. In this new window, you'll want to scroll down until you see the 'Volume' category.
Once you've found the 'Volume' category, you can then select the 'Relative Volume' study and hit 'Apply.' following these steps should help you to find the relative volume in thinkorswim.
Relative Volume Indicator for TD Ameritrade Thinkorswim - Update 2.6
What does relative volume mean for stocks?
Relative volume can indicate that a certain stock is more active or volatile than other stocks in the market. A stock with a high relative volume is more likely to be bought and sold than a stock with a low relative volume. For this reason, relative volume can be used to identify momentum or potential trends in the market.
For example, if a stock has a high relative volume, it may be because there is more interest in the stock, or because the price of the stock is changing rapidly. Either way, it can be an indication that the stock is worth paying attention to.
In contrast, if a stock has a low relative volume, it may be because there isn't much interest in the stock at the moment, or because the price isn't changing much. In either case, it may not be worth paying attention to the stock.
Relative volume can also be affected by events such as earnings announcements or analyst upgrades/downgrades. These events and other news releases can spur trader activity to increase, which will impact the relative volume of a stock.

What is a good number for relative volume?
A good number for relative volume is often subjective to the trader and the strategy involved. Some traders believe that a stock needs at least a 2.0 RVOL, or 100% increase in relative volume to be considered as a stock "in play" for that day. Other traders may find that as long as a stock has elevated RVOL, it is a sign that there is plenty of liquidity for trades in the event that a setup occurs intraday.
What is a good RVOL for day trading? Most active day traders look for RVOL of 2.0 or higher when scanning for trade candidates. An RVOL between 1.5 and 2.0 suggests moderately increased interest. RVOL above 3.0 typically indicates a significant catalyst such as earnings, news, or an analyst upgrade. For swing trading, RVOL above 1.5 on a breakout day can confirm institutional participation and increase the probability of follow-through.
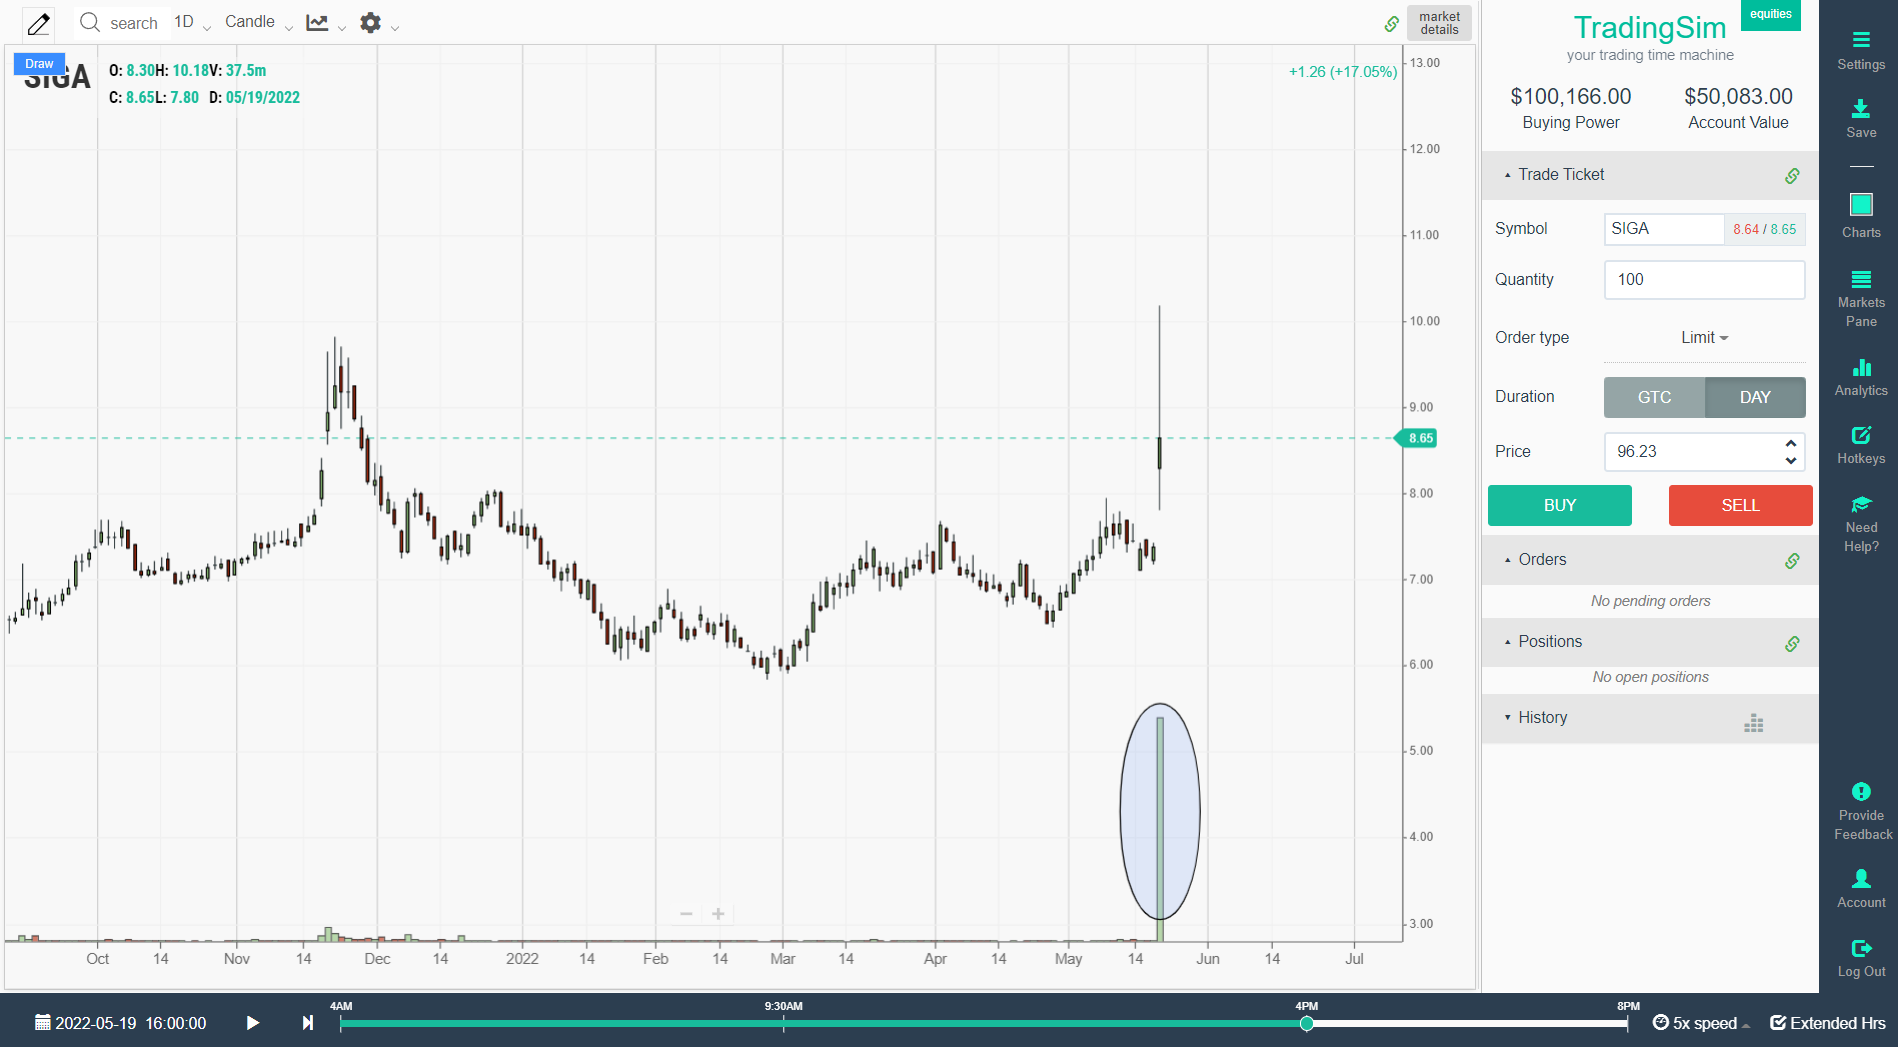
Example of a good RVOL
In the world of penny stocks and momentum stocks, traders often look for high relative volume to determine whether a stock is in play or not. This just means that they will have the ability to get in and out of a trade with ease if using large size/shares. In fact, the RVOL may indicate how much size they can use, if any.
Along those lines, if a stock is typically only trading 20,000 or 200,000 shares on a daily basis, then suddenly spikes to 10s of millions of shares, this becomes a potentially tradeable stock for the day.
In May of 2022, SIGA was a perfect example of this. As the stock rocketed on the news of a potential vaccine for monkey pox, shares of the company exceeded recent trading activity averages. The average amount of shares it traded prior to this day was around 130k. On the day of the news, it gapped and traded over 37 million shares.
What causes high relative volume?
When a company's stock price increases rapidly, its relative volume also tends to increase. This is because more investors are interested in buying the stock, and so there is more trading activity. Generally this is caused by news or some other catalyst in a stock.
More trades mean more shares changing hands, and as a result, the relative volume of the stock increases. While this is generally seen as a good thing - after all, it usually means that the stock price is going up - it can also be a sign that the stock is overvalued and due for a correction.
So, while high relative volume can be a sign of a healthy company, it's important to do your research before investing. High RVOL is also associated with pump and dumps. Never assume that a high RVOL automatically means a buy signal.
As you can see in the image above with the SIGA example, many stocks will run up on news, and then pull back. Make sure you test your buying and selling strategies before you risk any money based on RVOL.
What is a good average volume for a stock?
When it comes to stocks, there is no such thing as an "average" volume. Instead, volume is relative to the individual stock. For example, a company that is publicly traded on the New York Stock Exchange is likely to have a higher volume than a company that is only traded on the RTSI (Russian Index).
Additionally, a company that is experiencing high growth may have a higher volume than a company that is more mature. In general, however, a good rule of thumb is to look for stocks within the range of 500,000 - 1 million shares traded per day.
This ensures that there will be enough buyers and sellers to provide liquidity in the market. Additionally, stocks with higher volume tend to be less volatile, making them ideal for investors who are looking for stability.
What is a good relative volume for swing trading?
When swing trading, many traders look for a relative volume of at least 2.5 to 1. That is, they want to see the number of shares traded in the stock they're interested in to be at least 2.5 times the average number of shares traded over the past days.
So, if a stock usually trades 100,000 shares a day and it's currently trading 250,000 shares a day, that's considered an interesting volume change and could be an indication that the stock is about to make a move.
Of course, it is also important to consider other factors, such as recent news events or EPS results, fund ownership, or other factors. But if you're looking for stocks with the potential for strong price movement, paying attention to relative volume can be a valuable tool, especially if trying to time breakouts.
What is an RVOL indicator?
RVOL stands for Relative Volume, and it measures the number of shares that are traded in a given period of time. RVOL indicator compares current volume levels to past levels, providing insight into whether a stock is being heavily traded or not.
A high RVOL indicates that a stock is being heavily traded, while a low RVOL indicates light trading activity. The RVOL can be used to identify potential buying or selling opportunities, as well as to confirm price trends.
How do you use an RVOL indicator?
If you're a day trader, then you know how important it is to have access to reliable information that can help you make quick, informed decisions. The RVOL indicator is a valuable tool that can provide you with insight into the current market conditions.
Because it takes into account both the volume of trades and the price movement of the asset, RVOL can give you a good idea of whether there is currently high or low interest in a particular stock. In order to use RVOL effectively, you need to be aware of the different ways that it can be displayed.
For example, some charting software will show RVOL as a line graph, while others will display it as a histogram. Others might include the RVOL ratio in the order montage or some other window with data. It's important to experiment with different settings in order to find what works best for you. With practice, you'll be able to use RVOL to your advantage and make better decisions when trading stocks.
RVOL vs. Standard Volume: Key Differences for Day Traders
Standard volume tells you how many shares traded, but it lacks context. A stock trading 5 million shares might sound active, but if it normally trades 10 million, that's actually below average. Relative volume solves this by normalizing current volume against historical averages, giving you a standardized comparison metric.
When scanning for day trading opportunities, pairing RVOL with volume profile analysis helps you identify not just how much volume is flowing, but where the key price levels are. This combination is particularly powerful for finding stocks breaking out of volatility contraction patterns with confirmation.
Practice identifying RVOL-driven setups in a stock trading simulator before committing real capital. This helps you develop the instinct for which RVOL levels lead to sustained moves versus short-lived spikes in your preferred trading strategies.
Conclusion
So what is relative volume? Relative volume, or RVOL, is a technical analysis indicator that measures the magnitude of recent volume changes in relation to historical volume.
This will give you a percentage that can be used as an indicator to help you make informed day trading decisions. At the very least, if you are searching for momentum in the market, it will help guide you to the stocks making the biggest moves with the best liquidity.
If you're looking to day trade stocks, be sure to account for volume fluctuations. Keep an eye on the overall market trend and make sure your buy and sell orders are timed correctly in order to take advantage of price movements.
And most importantly, stay calm and don't let emotions get the best of you. Whatever you do, make sure you manage your risk no matter what!
Frequently Asked Questions
What is relative volume (RVOL) in trading?
Relative volume (RVOL) compares a stock's current trading volume to its average volume over a lookback period, typically 10 days. An RVOL of 2.0 means the stock is trading at twice its normal volume for that time of day.
How is RVOL calculated?
RVOL = Current Volume divided by Average Volume over a lookback window. Most platforms use 10-day or 20-day averages, often time-of-day adjusted so that morning volume is compared only to historical morning volume.
What is a good relative volume for day trading?
Day traders typically look for an RVOL of 2.0 or higher. Readings of 3.0 or more signal strong interest and reliable liquidity for entries and exits, while readings under 1.0 suggest the stock is below normal participation.
What causes high relative volume?
Earnings, breaking news, analyst upgrades or downgrades, sector catalysts, FDA decisions, and sudden shifts in macro sentiment all push RVOL well above 1.0. Pre-market RVOL is the earliest tell that a name will trade actively at the open.
How do you use RVOL for swing trading?
Swing traders use RVOL of 2.5 or higher to confirm breakout entries. High RVOL on the breakout day validates the move; declining RVOL on subsequent pullbacks suggests the trend is intact.
Where can I see RVOL on a chart? Most modern charting platforms include an RVOL indicator. On TradingSim, RVOL is available alongside volume, VWAP, and moving averages so you can stress-test setups against historical sessions before risking capital.
What RVOL threshold filters out low-quality setups? A common rule is to ignore any breakout where RVOL is below 1.5 at the breakout candle. Adding an RVOL filter to a scanner removes most low-volume false moves and keeps you focused on names with real institutional participation.
Related Trading Resources
Last reviewed and updated by Al Hill — May 2026.


 Volume Indicators


