Volume Candlesticks – How to Trade with this Powerful Indicator
Oct 18, 2021
Written by: Al Hill
✓ Reviewed by Kunal Vakil, Co-Founder of TradingSim
Volume candlesticks may sound a bit odd at first. After all, most of us are used to seeing price candlesticks separate from volume bars below on a chart. Perhaps you’ve even tried Volume Profile before, where volume is displayed horizontally? If so, volume candlesticks are simply a combination of volume and price to show the emphasis on the amount of effort that goes into each candle.
Volume candlesticks are comprised of the following information: open, high, low, close and volume. The one difference from the standard candlestick structure is the obvious volume aspect. The volume then drives the size of the width of the candlestick.
Examples of Volume Candlesticks on the Chart
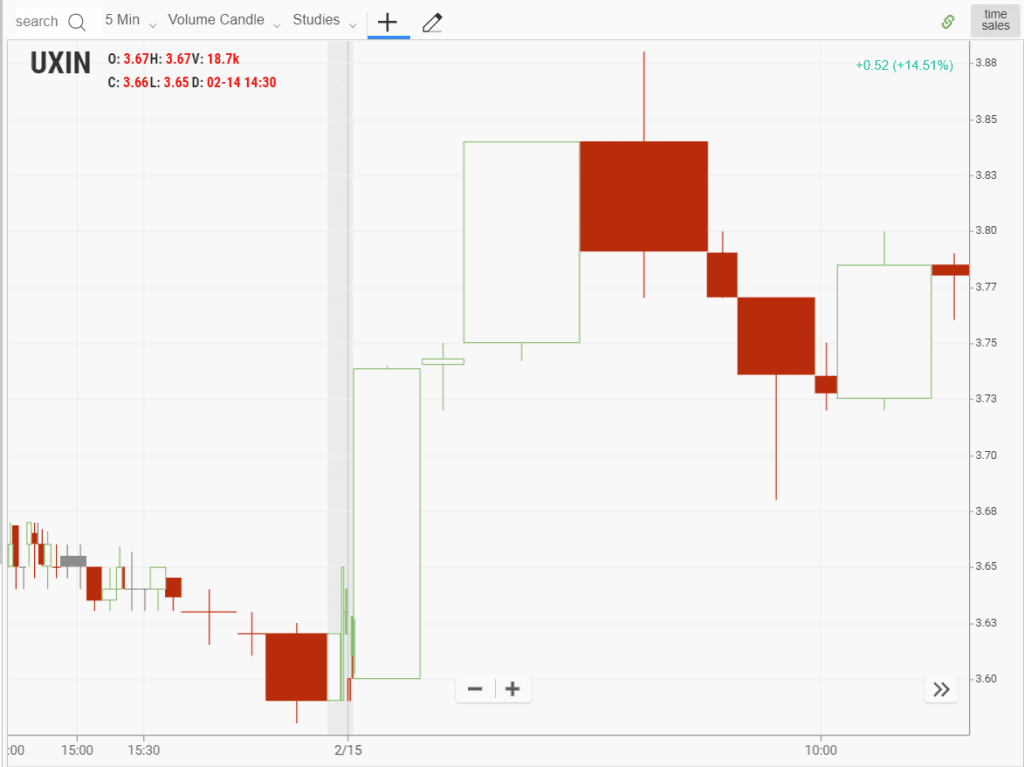
Volume Candlesticks
What are some of things that pop out at you when reviewing the above chart?
First, the large size of the candlesticks in the morning. This is something you will consistently see when day trading.
The other thing to note is how you can have small candles right after large ones. These inside bars are moments of reflection where bulls and bears are trying to figure out which way the action will break.
The last thing you will notice is how volume slowly drifted lower into the close on the prior day. Comparing the size of the candles from the prior day to the current day should give you a clear indication that more effort, more shares, were being traded on the current day.
Breakouts with Volume Candlesticks
Breakouts are one of the hardest patterns to trade in the market, but they are also one of the most rewarding in terms of profit potential. The key challenge with breakouts is determining when the breakout is real versus when it’s simply professional traders selling into the hands of other less informed retail traders.
Let’s review a few examples of breakouts and how volume candlesticks can help us dissect the action.
Breakout Example #1
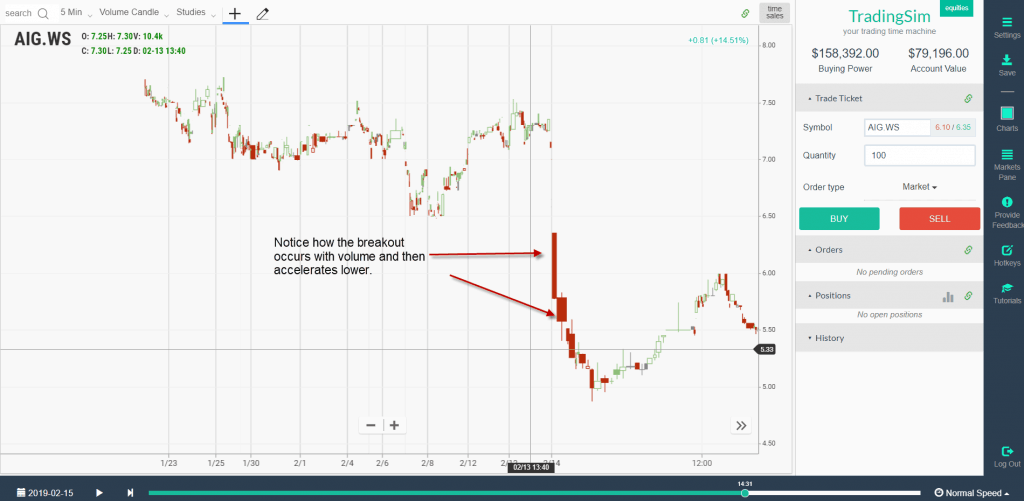
In this first example, we are going to review a breakout to the downside.
Valid Breakdown
In the above chart, notice that when price breaks down it is followed by red candlesticks that are also large and wide. If the second candlestick after the breakout candle was small and unable to go lower, this might be your first sign that a reversal or at least a pause could be around the corner.
Rather, the expanding candles and volume tell us that more downside is likely imminent. After all, we’re simply looking for clues as to the path of least resistance.
Let’s take a look at another valid breakout example.
Breakout Example #2
One of the hardest things to do when day trading is placing trades during the middle of the day. Head fakes and choppiness abound once you get past 10 – 10:30am. The breakout momentum from the opening bell has usually dissipated and moves higher are often where the newbies are stuck holding shares from professionals that have sold off into the morning strength.
That being said, there are times when mid-day or late morning breakouts occur. We discuss these in our discussion of our favorite small account strategy.
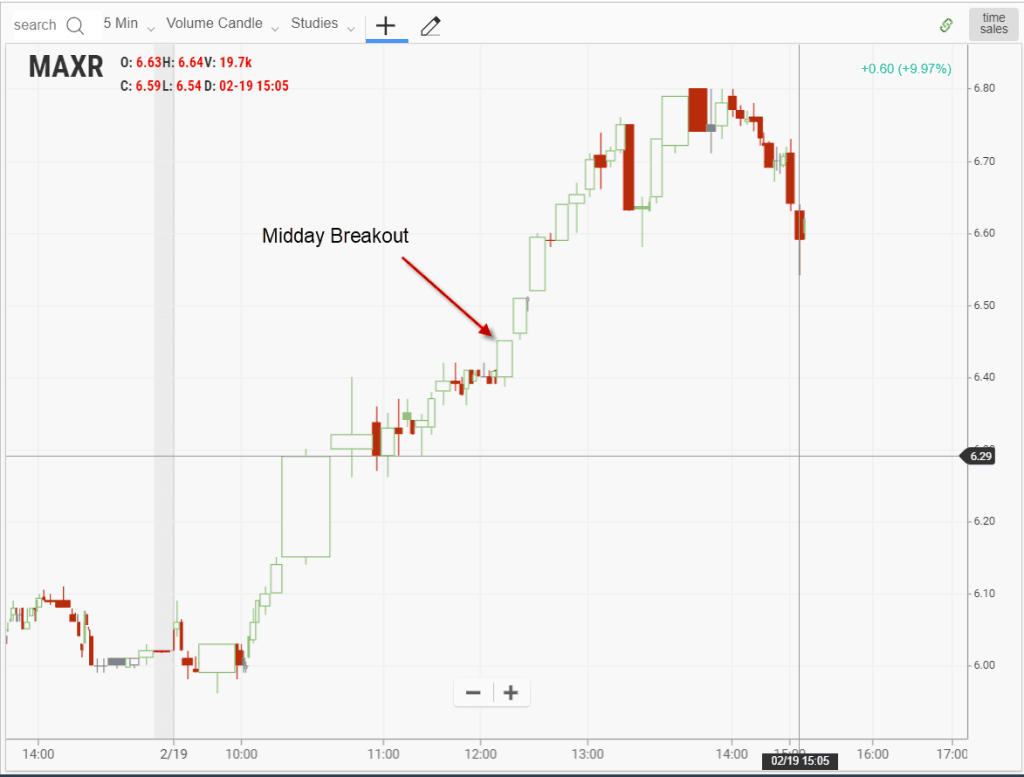
Midday Breakout
Notice in the example above how the candle breaks through the $6.40 level with a solid white candle after about ten smaller back-and-forth candlesticks.
This large white candle shows you that price was able to break with volume. As the market contracts and expands, volume expansion on a breakout is generally considered positive. This is especially true with follow-through expansion on more than one candle.
Unlike the morning trade where you can buy breakouts almost purely based on price action because you know the volume always comes in, you will need to obsess over volume during the midday in order to increase the odds of your trades working out.
False Breakouts with Volume Candlesticks
Not all breakouts work. That’s an understatement. It will be up to you to study the characteristics of what typically works and what doesn’t. To that end, volume candlesticks can help with your observation of whether or not expansion comes into a breakout.
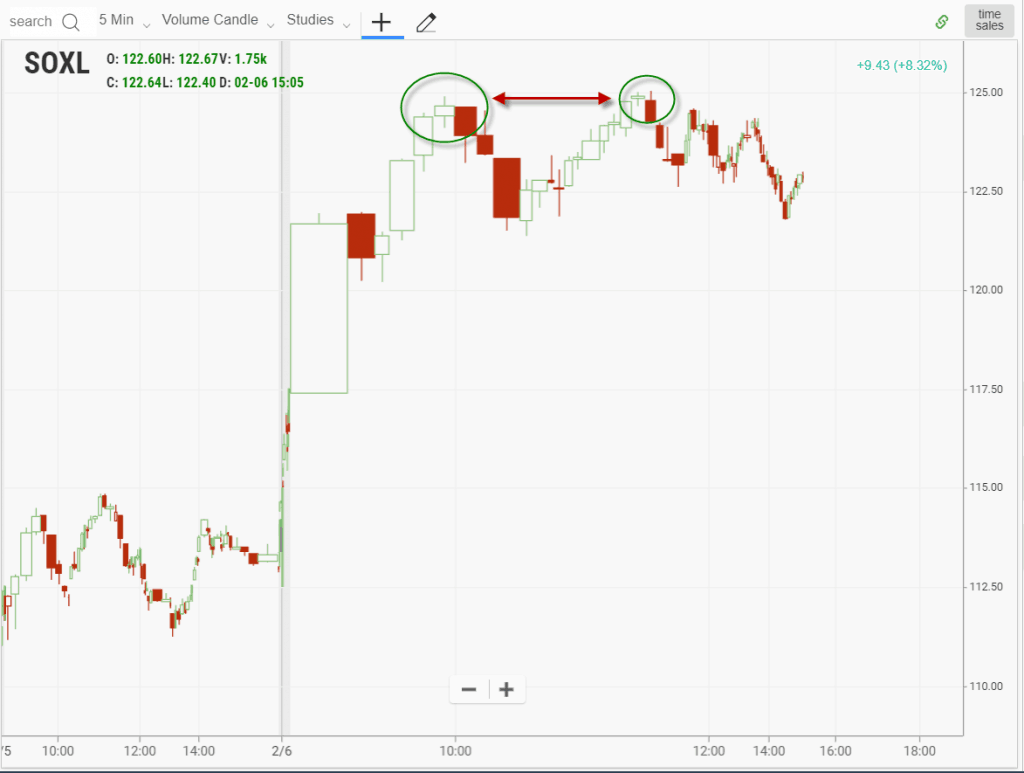
Failed Breakouts
As you can see in this example, the volume and price do not accompany the breakout. As mentioned earlier, with the midday breakouts you have to be patient and let that first 5-minute bar develop.
The method is simple: if the candle is red on the breakout and the width is small, there is a high likelihood of a reversal coming. We call this failed-follow-through. At this point, your alarms should be going off and shifting from offense to defense.
Trend Continuation with Volume Candlesticks
Another method for using volume candlesticks is to determine when to enter continuation patterns. This is a great method for jumping into a strong trend.
Pullback/Continuation Example
Pullback Volume Candlestick
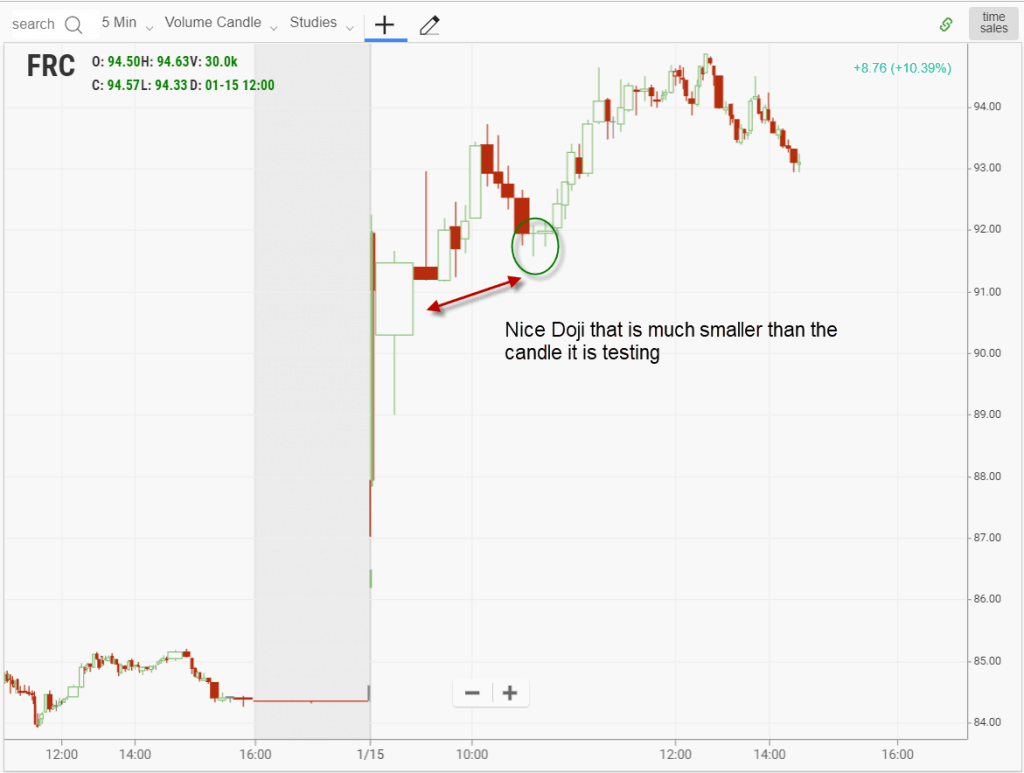
In this example, FRC had a nice runup in the morning and then formed a doji. As you can see, the doji was small relative to the large white candle from the opening bell. We call this a retest, when price pulls back to a heavy demand area to see if that demand is still present.
So, how do we set up this trade?
Well, the doji also presents itself after four black crows (I know the candles are red). You want to buy the break of the last red candle with a stop below the doji.
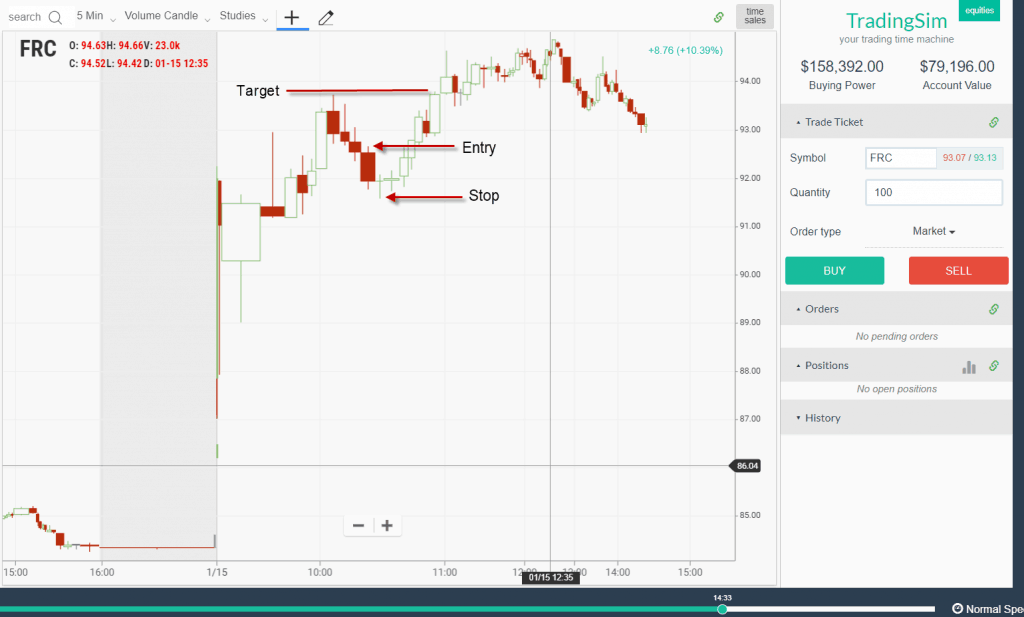
Your profit target is the most recent high, which will give you a 3 to 1 risk reward ratio. Check out the below visual which illustrates this setup.
Pullback Setup – Volume Candlestick
For more great tips on how to spot “constructive” or “bullish” pullbacks, be sure to check our recent post on the subject.
Ride the Trend with Volume Candlesticks
Let’s explore how volume candlesticks can potentially help identify when the market is trending hard and when you need to hold on to your position for larger gains.
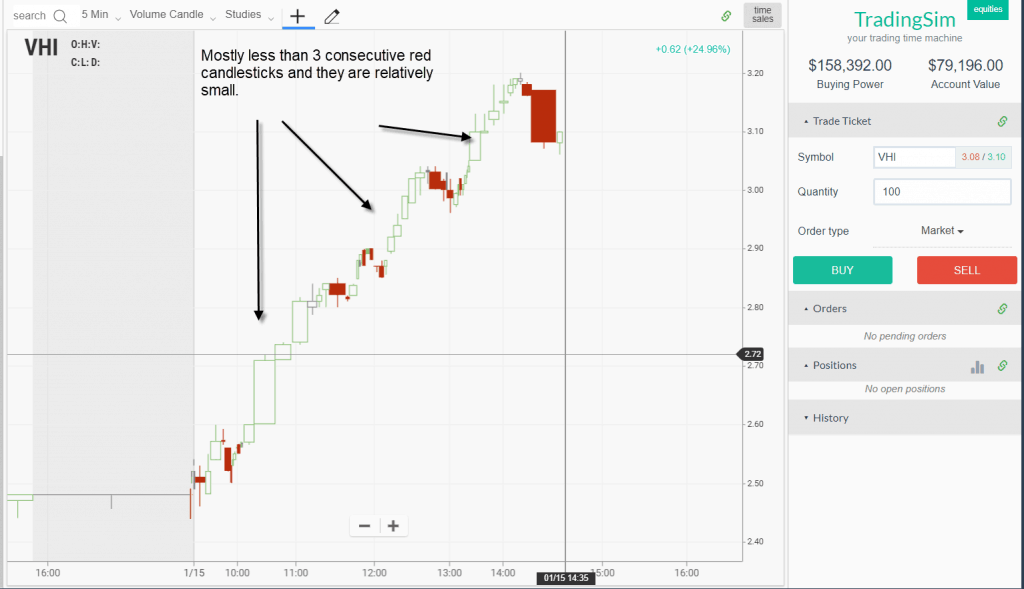
Riding the Trend
In this example, you can see that there are some up candles and when red candles do present themselves, they do so with little volume.
In these scenarios, you want to sit back and let the candles do the hard lifting. We don’t receive a large red candle until near the close, at which point you have already made a sizeable profit.
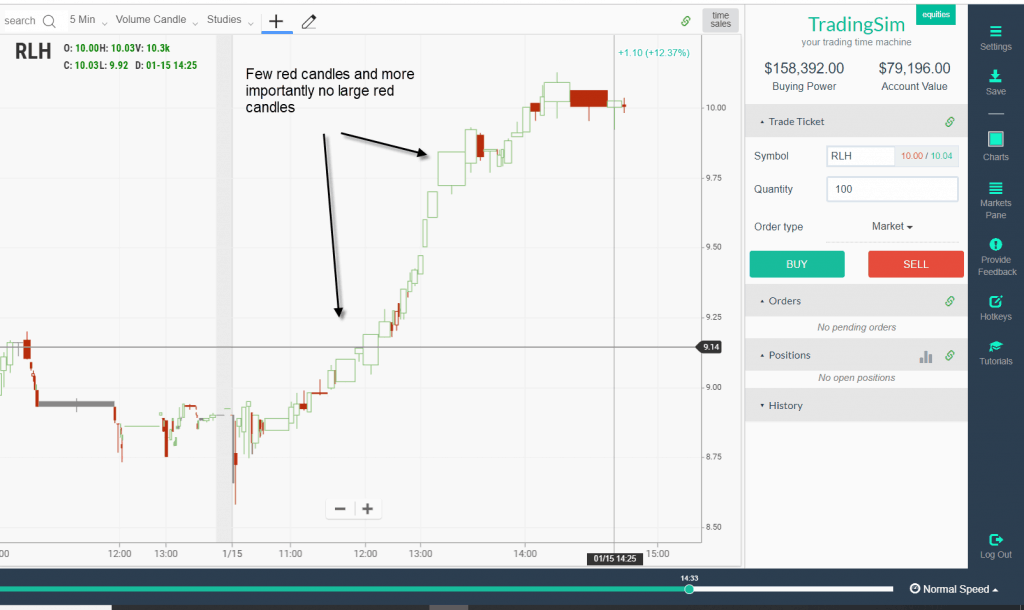
Strong Uptrend
The market continues to go higher in this next example with a few red candlesticks. Again, the key point is that there are no large red candlesticks showing up on the chart.
Granted a large red candlestick can always show up out of nowhere. for this reason, it is best to keep stops beneath key price levels to ensure you don’t give back gains in minutes that you have been accumulating all day riding a strong wave. You might also consider a trailing stop in this environment.
Conclusion
We really hope this brief tutorial helps you understand not only the significance of volume candlesticks, but also how to trade with them. Like with any indicator on a chart, there is no “perfect” tool for divining the markets. However, with practice, you can find the tools that suit you best as you train your chart eye to read the volume and price action.
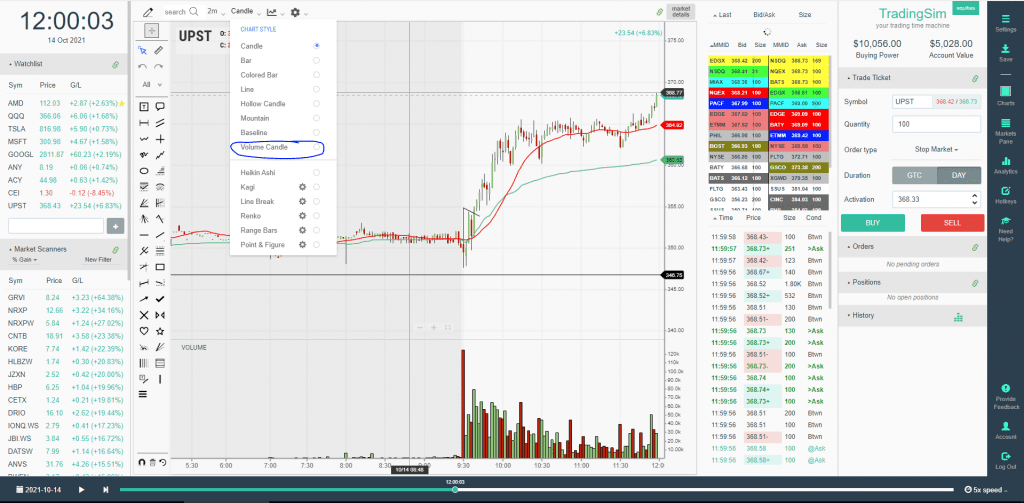
How Can Tradingsim Help?
Tradingsim provides the most realistic and user-friendly application for replaying the markets. We also have a large inventory of indicators including volume candlesticks. Here is where to find the volume candles in TradingSim:
Feel free to test drive the strategies you see in this article and others from around the web, which can help you achieve your trading goals.
To see more on volume candles and candlesticks in general, we recommend Steve Nison’s website.
Alton Hill is the Co-Founder of TradingSim with over 18 years of trading experience. He completed the Design Thinking Bootcamp at Stanford’s D.School and brings expertise in Product Development to create the best trading simulation experience. His strategy focuses on trend-following systems, targeting high-volatility stocks with strong primary trends using the 15-minute chart.
Stars, Dojis, and Abandoned Babies — Powerful Reversal Strategies
Candlestick patterns can have some crazy names sometimes. Stars, dojis, and abandoned babies? The Japanese were fond of naming candlestick patterns after real-life visual representations. Shooting...
Balance of Power Don Worden created the balance of power (BOP) indicator in the 1950’s to understand market activity between buyers and sellers. Below is a chart of Goldman Sachs Group Inc. (NYSE:GS)...
A blow-off top is a technical chart pattern that is identified by a very sharp and rapid increase in a security’s price including volume which is followed by an equally sharp and rapid pace of...


 Candlesticks


