Three black crows sounds ominous -- like a murder of crows circling a meal. And when it comes to stock trading, this candlestick pattern usually does forebode a drop in prices. However, there are some nuances to the pattern. Much like its more optimistic cousin, the three white soldiers, the three black crows often portends a strong directional bias in the market.
If you are unfamiliar with the three black crows bearish candlestick pattern, we'll discuss all you need to know in this tutorial. By the end, you'll know what the three black crows means, how to trade the 3 black crows, and some caveats to watch out for.

What is 3 black crows?
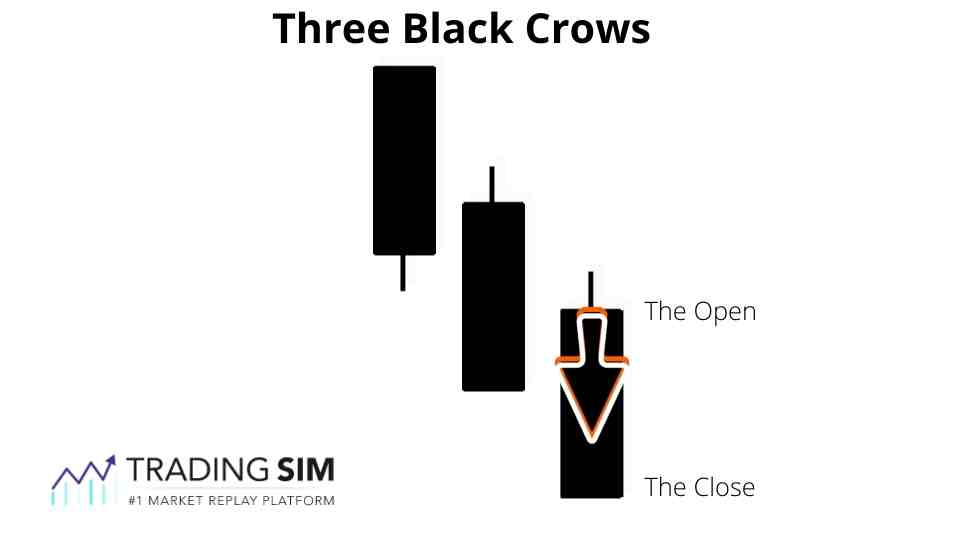
Three black crows is the name of a bearish candlestick pattern in stock trading. After an extended uptrend the appearance of these long-bodied, bearish candles often signals a reversal. In many ways, they are seen as kill candles, effectively killing the prior uptrend of a move in stocks, crypto, forex, or other asset.
In appearance, the three black crows are usually considered marubozu-type candles -- long bodied with small or no wicks on the ends of the candles. This is debatable, however. The general consensus is that the candles must display elevated range compared to prior price action, regardless of the form of each candle. Technically speaking each of the candles must open within the body of the prior candle and close lower.
Key Takeaways
- Three Black Crows is the opposite of the Three White Soldiers.
- The pattern is considered a bearish reversal or continuation pattern
- The strength of the pattern lies within the character of the candles
- Other indicators should be used in conjunction with the pattern to confirm
What does 3 black crows mean?
The 3 black crows pattern indicates a reversal or continuation. It is generally considered a bearish candlestick pattern that anticipated after an extended bullish uptrend. The presence of the 3 black crows often signals that a reversal is imminent as downward price movement shows no real resistance in the pattern.
The best three black crows patterns show an increase in volume on an extended or overbought chart. Many times it will preclude a bounce as well. However, the strategy implies that the bounce should be short-lived and die once it hits the prior resistance area within the body of the three black crows.
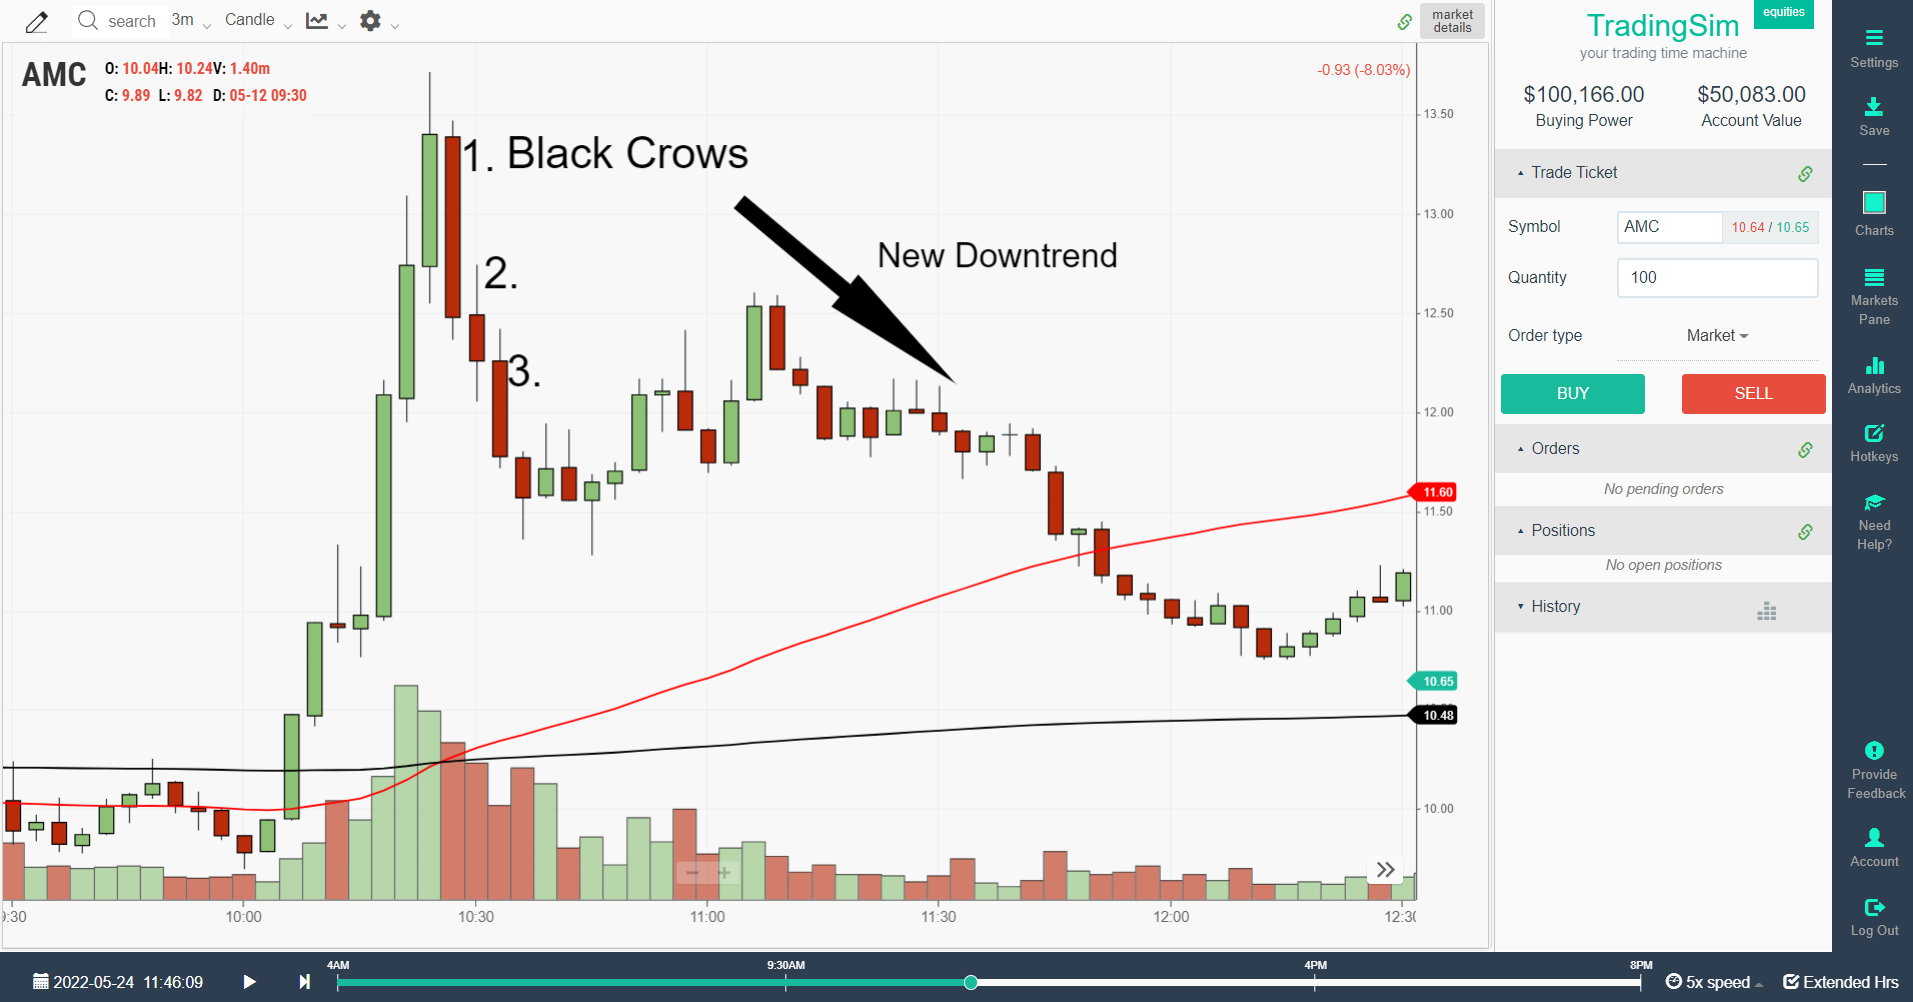
As you can see in the AMC example above, bulls were clearly in control at the beginning of the trading session. This became overbought and climactic. After reaching a climactic point, bulls eventually yield to the selling pressure at the highs and the reversal is almost as violent as the upthrust.
Pay attention to the character of the red "black crow" candles as well. Notice that they are mostly full-bodied candles with very little shadow or wicks. Each of the successive candles forms within the body of the prior candle and then closes decisively lower.
Volume is also elevated on these candles, but lower than the green candles in the uptrend, suggesting that there is ease of movement in a downward trajectory. If you pay attention to the price action in the candles preceding the three black crows, you'll notice that there is selling pressure meeting the demand at the highs as observed in the wicks of those candles.
How to trade the three black crows pattern?
The three black crows is tricky to trade. This is because it is usually a steep drop from the previous highs. This steep drop makes it difficult to define your risk parameters efficiently. As most traders know, you usually want your risk to be pretty tight for a stop loss.
So how do you manage that while trading the three black crows? Well, we like to take a unique approach and apply a static intraday vwap, called vwap boulevard, based upon the highest volume candles from the most recent price action. What this accomplishes is three things:
- establishes where the highest volume traders are averaged on the chart
- gives you an idea of where the price could retest support or resistance
- allows you to risk off of these levels depending on the reaction
Let's take a look at this with the AMC example given above.
Three Black Crows Pattern Example:
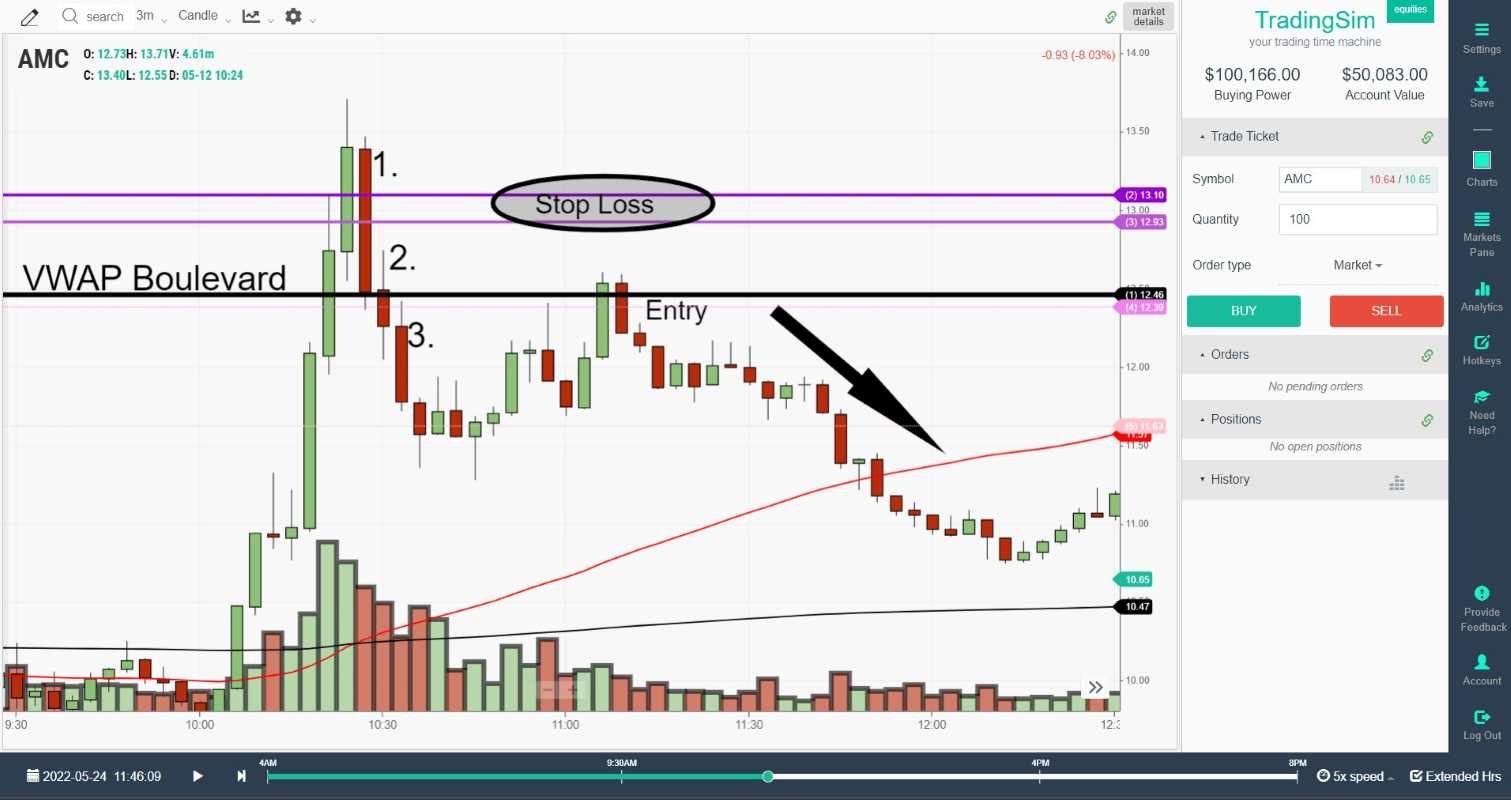
In this chart, pay attention to the black and purple colored horizontal lines. These are drawn on a chart using our vwap boulevard drawing tool. It tells us the top 3 highest static vwap levels for the candles given on the chart -- the black line being the highest volume.
Now, notice two things. One, after the initial selloff, which would have been hard for many traders to chase because your risk would be waaay up at the high of the day, you eventually get a pullback. But where does that pullback find resistance? You got it! At the highest volume static vwap candle for that day.
This is where we take entry. We not only have a lower low established, but once price cracks back through this vwap boulevard level, we can sell short and put our stop loss somewhere above this rally point high. If you have a high-risk tolerance, place it up into the remaining vwap boulevard levels. It's really subjective.
When to take profits on the three black crows pattern?
Once you've entered the stock on the pullback and set your stop, it's time to figure out a target. This is usually done by measuring the move up, measuring the drop of the three black crows pattern, and then extending those distances from your entry for a target.
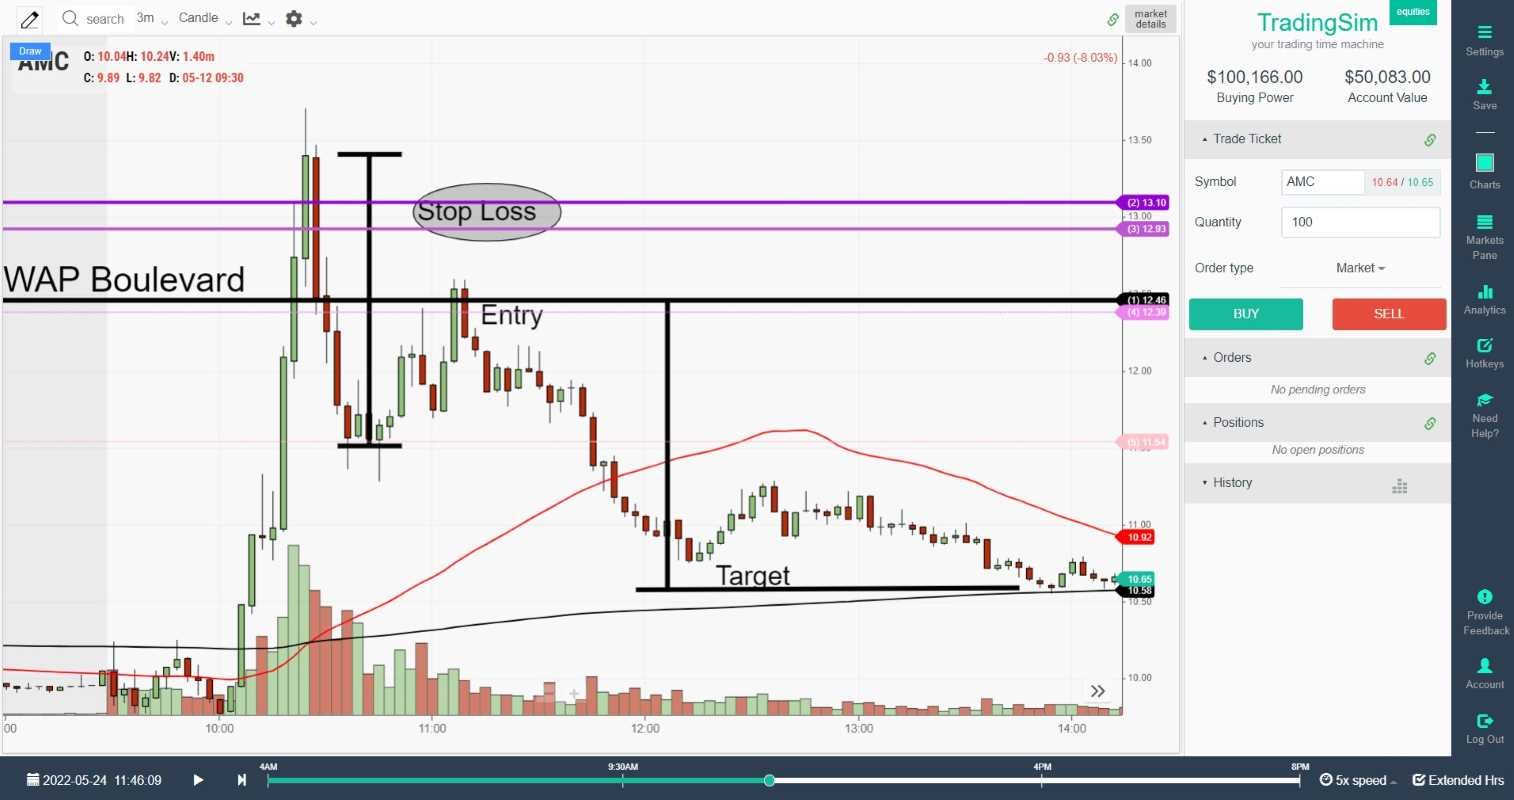
Taking the same chart and trade from above, we have now measured the initial move in the three black crows pattern and applied it to our pullback entry. While this may not always work 100%, it certainly worked this time, as our target was reached. This gave us nearly $2 in profits on the short side.
What we observe in this trade is a quality risk/reward ratio with a solid trade. It is also interesting to note that the trade made it all the way to the 200 moving average in this time frame. If measured targets are not your thing, you might experiment with using moving averages or any other indicator to judge an area of support.
Three black crows vs three white soldiers?
The three white soldiers is considered the inverse of the three black crows. The visual representation of the candlesticks is similar, albeit in a bullish formation. For that reason, the three white soldiers typically represents a bullish reversal pattern after a downtrend.
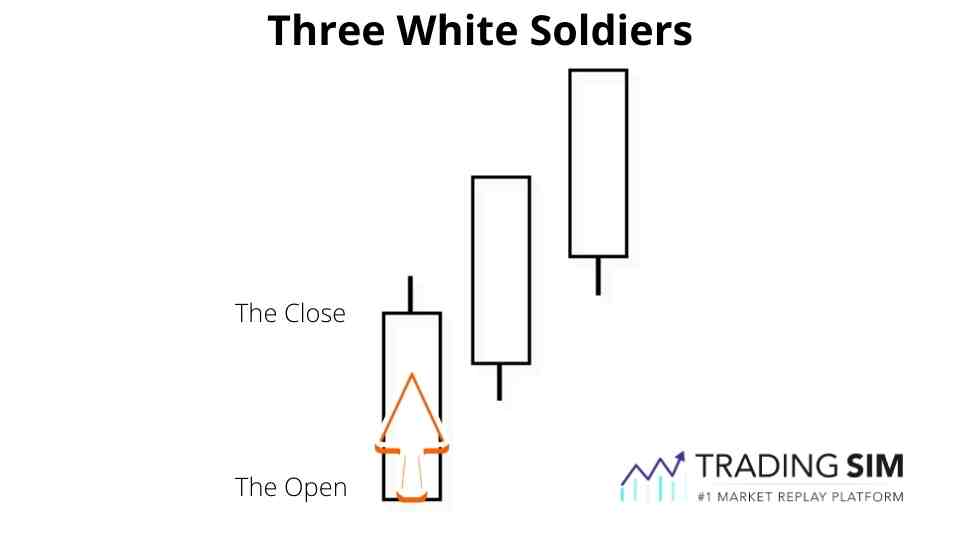
Despite being the mirror image of the three black crows, you essentially look for the same type of trade with the three white soldiers. It is tricky to chase the bullish candles, but if you can find a good pullback after the completion of the patter, you might be able to enter with a solid risk/reward setup.
If the quality of the buying/demand is high in the three candles, then you should see any pullbacks into the body of the candles being supported, much like we saw in the AMC example above, just reversed.
When does the three black crows Pattern fail?
Not all strategies or patterns are going to work. The three black crows pattern fails when the price action resumes the uptrend, essentially nullifying the downfall caused by the three black crows.
There could be a number of reasons why this could happen. One reason is that the volume could be an indication as to how much selling pressure is present. If there is very little selling pressure, the three black crows could simply be a shake-out, testing the supply levels before market makers take the price higher.
Another reason why the three black crows pattern might fail is the lack of extension in price. In the absence of an overbought, parabolic chart, the three black crows might be susceptible to failure. In other words, the more choppy the price action, the less likely you might see a three black crow trade as a success.
For these reasons, we always preach the importance of using a stop loss. Once a strategy or trade has gone awry and no longer makes sense, it is time to get out and let the pattern set up properly again. Remember, hope is not a strategy, and there is no reason to go for a ride on a trade simply because you hate being wrong. Be wrong, and move on.
How to practice the three black crows?
The three black crows can be a solid pattern indicating a reversal of an uptrend. That doesn't mean it works all the time. While some traders argue that it has a success rate near 80%, a lot of this will depend on context and how you trade the setup.
That being said, there is no better way to test your three black crows strategy than in a simulator. Here at TradingSim, we provide you with the ability to look back and replay over three years of intraday market days. Not only that, but you can pause, rewind, fast-forward, and actually simulate real trades.
Do this with your eyes set on finding as many three black crows patterns as you can find. Then when you have traded a large enough subset, check our built in analytics tools to reveal your equity curve and success rate on the strategy. This will either give you the confidence to go live, or find another pattern to qualify.
Here's to good fills!


 Candlesticks


