✓ Reviewed by Al Hill, Co-Founder of TradingSim · Updated Apr 1, 2026
A proper education in price action wouldn’t be complete without understanding when, how, and where to go long on a stock. Especially using bullish candlestick patterns.
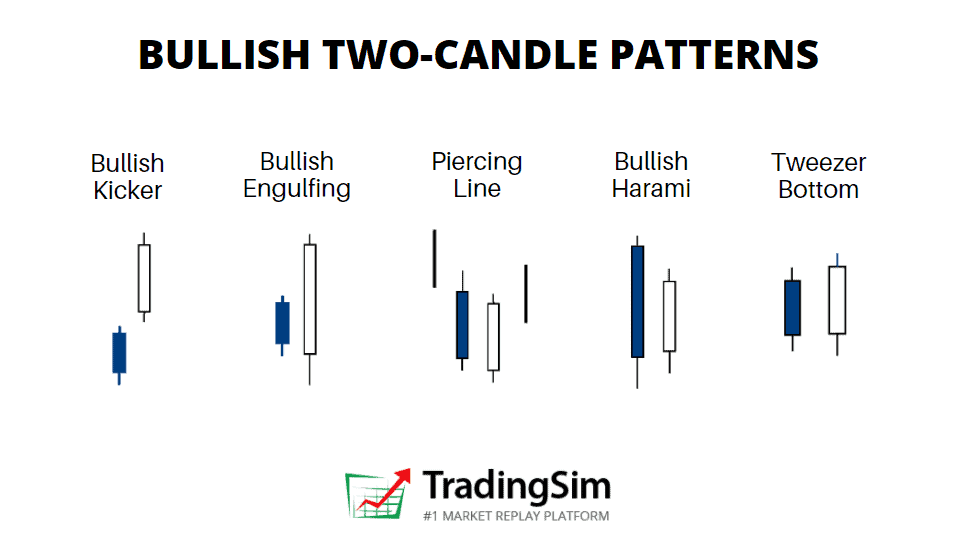
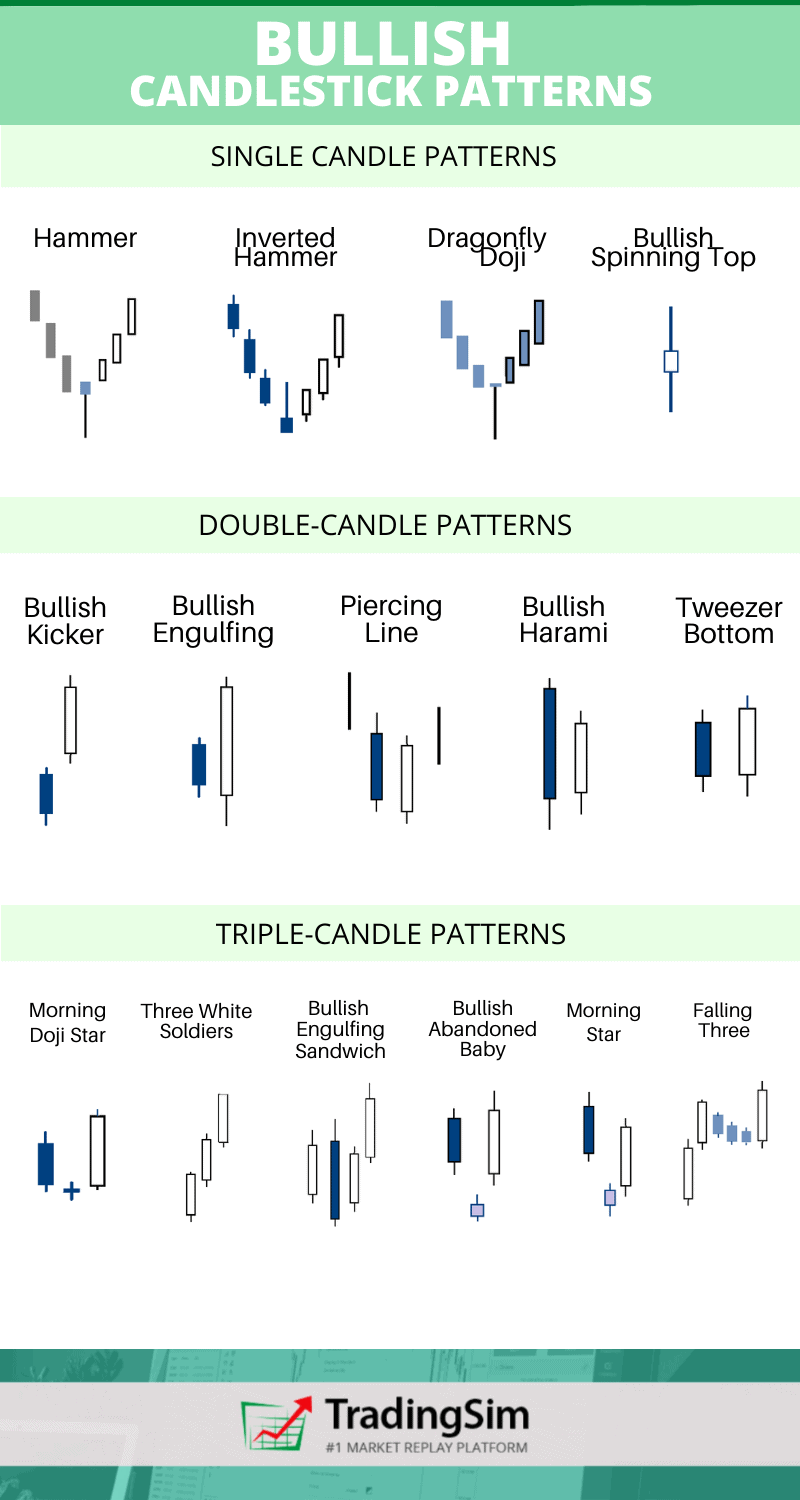
In addition, be sure to use our Bullish Candlestick Pattern Cheat Sheet for your trading and training purposes as you read along!
Bullish Candlestick Patterns Explained
Let’s face it. Day trading is difficult. It can be fast and furious, especially for beginners.
Stocks are up one minute, down the next. You want to get in at the bottom, but you’re unsure of yourself. You want to short the top, but how do you know it will come back down?
Not knowing how to make sense of charts in the heat of the battle only adds to the difficulty of day trading.
Thankfully, a lot of the work has been done for us – four centuries ago, actually. It is simply up to you to put in the time to understand price action trading.
Therein lies the importance and functionality of bullish candlesticks and candlestick patterns.
In this post we’ll explain the most popular bullish candlestick patterns. For each pattern, we’ll cover:
What these patterns look like
How to set entries and risk for each
What are the criteria for confirming them
What story do they tell
Some common mistakes when interpreting them
A few strategies for each
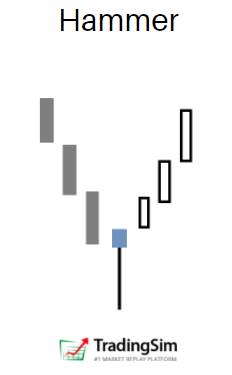
1. The Hammer
If you are familiar with the bearish “Hanging Man”, you’ll notice that the Hammer looks very similar. But as the saying goes, context is everything. Much like the Hanging Man, the Hammer is a bullish candlestick reversal candle.
The context is a steady or oversold downtrend. This creates the plot for the story that builds within the next few candles. As price declines more rapidly, we anticipate the eventual bounce.
But how do we anticipate without getting caught in more of the selloff?
This is where the Hammer comes into play. It offers us evidence that selling pressure is diminishing or being absorbed. In addition, if the volume signature associated with the Hammer candle is significant, it adds even more confidence to our thesis.
We are looking to capitalize on shorts who are taking their profits and covering, along with dip buyers who are taking a chance here on the oversold conditions. The expectation? A rally.
Ideally, you identify the hammer candle, take a position long on the break to the upside of the candle, and set a risk in the body of the Hammer, or at the lows.
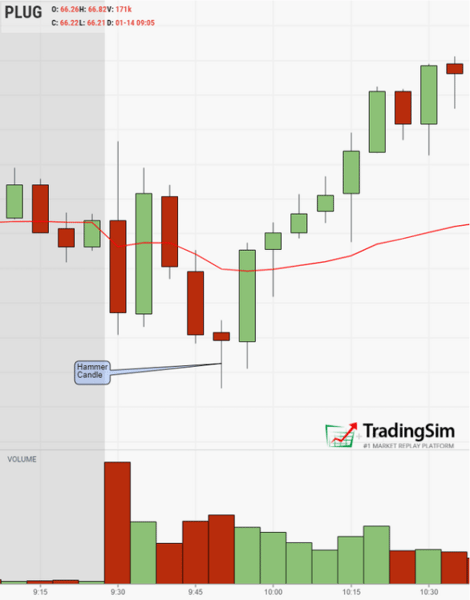
Bullish Hammer Example
Let’s look at a real-life example with PLUG. Right off the open, PLUG retests the lows from the pre-market. Once it reaches those levels, volume increases slightly as it reverse on the 5-minute chart seen here.
PLUG reversing in the first 30mins of trading with a Hammer candle pattern
Visibly, there is a “shelf” forming near the lows of the hammer candle’s body. The bar to the left and right also close and open in that price “shelf” area.
The second 5-minute chart opens with a bit of weakness, then rallies strongly above the Hammer candle.
This is your signal to go long. The break of the Hammer candle body.
Set the stop below the close of this bullish 5-minute candle.
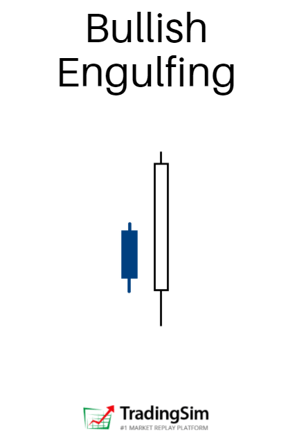
2. Bullish Engulfing Crack
Imagine the surprise if you are a short seller when a stock appears to confirm your downward thesis, only to completely reverse on you. Such is the case with the Bullish Engulfing Crack.
The down-trend appears to be continuing. Shorts are nice and comfortable. Then suddenly we get a complete retracement of the preceding bearish candle.
How do we explain this?
Well, you can imagine that shorts will begin covering as they witness the rising price of the stock. This adds fuel to the buying pressure already present.
The result is a bullish candlestick pattern that engulfs the efforts of the bears. For the long-biased trader, the opportunity is perfect.
As with any setup, we are looking for evidence to build our confidence in either direction. The fact that bears were completely overcome in this single bar, is evidence enough for us.
You go long at the break of the prior bar and set a stop at the lows.
Bullish Engulfing Examples
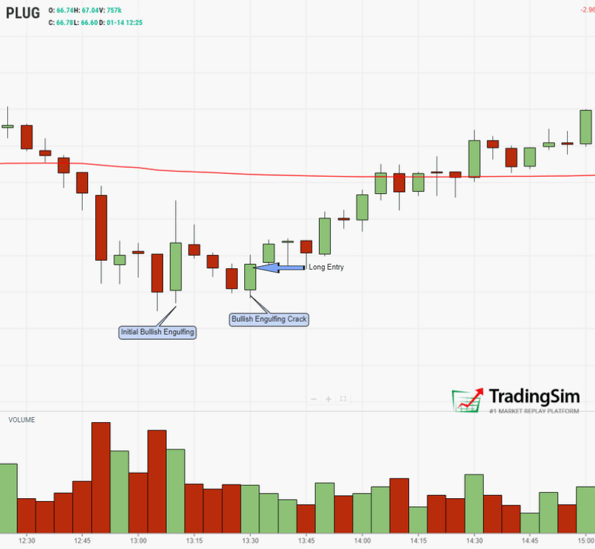
Let’s use PLUG as another example, on the same day as the prior example.
This time, later in the day, PLUG has a sharp selloff. After the steep decline, price reaches the support level from the prior Hammer candle mentioned above. This time, we get two bullish reversal candles that completely engulf the prior bearish candles.
PLUG with a Bullish Engulfing Crack reversal pattern mid-day
Again, notice that the context is everything here. We are in an oversold condition with climactic selling pressure. Analyzing the volume at the lows, we can see that support is coming in as weak hands cough up their shares.
Let’s look at another example.
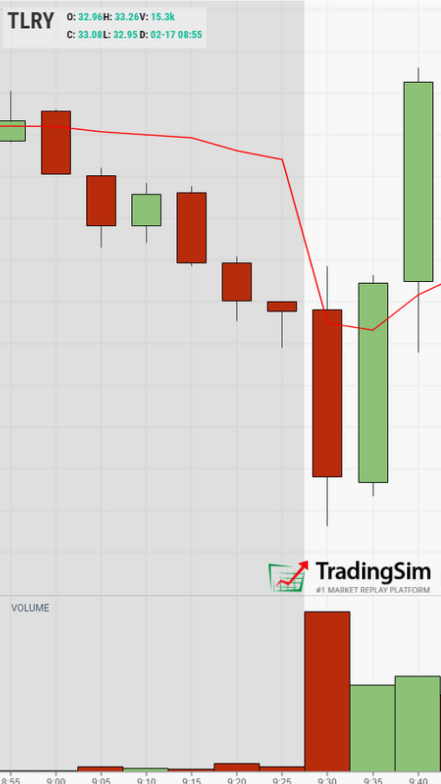
Here is a snapshot of TLRY, which offered us a beautiful Opening Range Breakout (ORB) opportunity right out of the gate on this particular day:
TLRY with the ORB off the open using a Bullish Engulfing Crack pattern
After the selloff, buyers come in and overcome the prior selling pressure from the pre-market, engulfing the bears before moving higher.
To be safe, you would enter long on the break of the red candle, setting your risk at the lows, or in the body of the first green candle.
There are some advanced traders who are more aggressive and may take their positions early if they sense the reversal is imminent.
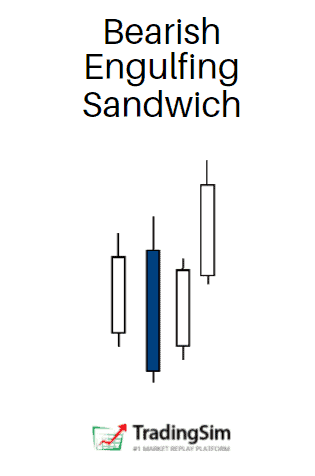
3. Bearish Engulfing Sandwich
Do not be confused. Just because the name says “bearish” doesn’t mean this is a bearish pattern. Far from it, actually. It is often referred to as the Stick Sandwich
The name is derived from the sandwiching of a “bearish engulfing” candle by two bullish candles. Thus, it is a bullish candlestick pattern in this context.
Very similar to the above example of the Bullish Engulfing Crack, this pattern simply takes a bit longer to “get going,” so-to-speak. An extra bar, essentially.
Again, the idea here is to think about who is getting trapped. In this case, the bears think that they have won the battle.
The assumption is that the trend has reversed and we are now headed down. After all, the Bearish Engulfing candle gives us that confidence, right?
Well, if you are on the short side, that is the hope. However, stocks don’t always do what we want them to. We have to react to what the market gives us, not what we think should happen.
In this case, the Bearish Engulfing Crack is consumed by two bullish candles that resolve to the upside. If you are short, hopefully you have respected your stop loss. If you are long-biased, you have a great opportunity here.
Bearish Engulfing Sandwich Example
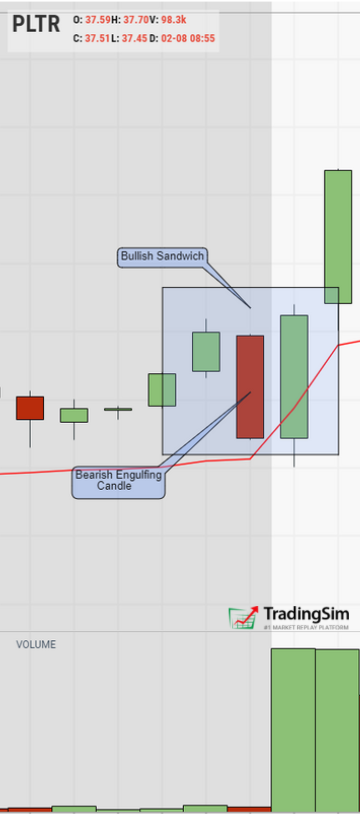
PLTR offers a great visual of this in real-time after the open with a 5-minute candle chart.
PLTR with a Bearish Engulfing Sandwich at the opening bell
In this case, the right side of the sandwich acts very similar to a Bullish Engulfing Crack candlestick pattern. For all intents and purposes, you should treat your entries and risk similarly to that pattern.
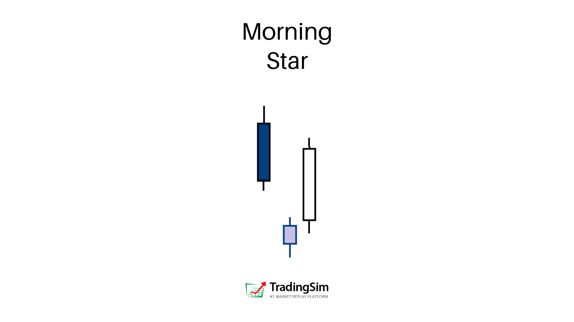
4. The Morning Star
Technically speaking, the morning star should gap down. This is difficult to find on an intraday basis. For that reason, we suffice for a solid doji candle reversal pattern.
The initial candle should be long-bodied and bearish. The middle candle is short-bodied. The reversal candle is another long-bodied bullish candle (typically a gap up). The close of this bullish long-bodied candle should close above the midpoint of the 1st candle.
What is the story behind this pattern?
The plot is typical: oversold conditions (the gap down). But the body of the middle candle tells us that there is either indecision, or lack of follow-through to the downside.
The result: without further selling pressure, the candle rallies to higher prices as sellers cover and buyers take advantage of discounted stock pricing.
Morning Stars can also appear as Morning Doji Stars. They look almost identical except for the body of the middle candle. The story of buyers and sellers remains the same.
Bullish Morning Star Example
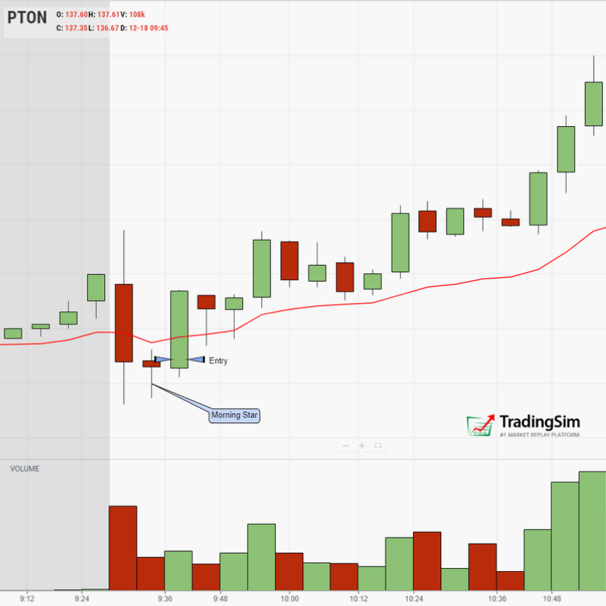
You can see this in action with the PTON example below. A long bodied bearish candle, followed by a narrow bodied indecision candle. The bulls take control on the next candle and the rest is history.
PTON displaying a Morning Star reversal pattern
It is worthwhile to note the volume in the first candle. We cannot assume that it is completely bearish. As you can see, there is some buying pressure at the lows. This gives us confidence as the doji candle forms.
Consequently, as price moves away from the lows in the green candle; it does so on low volume.
How can we explain that?
It took less effort for the price to rise. Therefore, we can assume that there is “ease of movement” to the upside. This should give us confidence in our long position.
For more examples of the Morning Star and other doji candles, visit our tutorial.
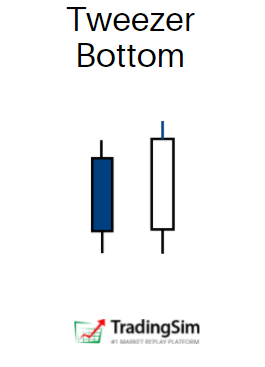
5. Tweezer Bottom
The Tweezer Bottom bullish candlestick pattern consists of two candles– usually with small bodies. The first should be a red/bearish candle, the second a green/bullish candle.
The bodies of the candles are typically very close with regard to their closing and opening prices, or wicks. This produces a “visual” of a pair of tweezers.
Thematically, the Tweezer Bottom alerts the chart reader to the fact that price is trying to be pushed lower, but to no avail. The two small-bodied candles represent the presence of demand in the market.
The volume signature will likely appear elevated as supply is being absorbed, keeping the candles small in the presence of selling pressure.
Entry should be taken as price breaks higher from the second candle. Stops can be set at the lows.
Bullish Tweezer Bottom Example
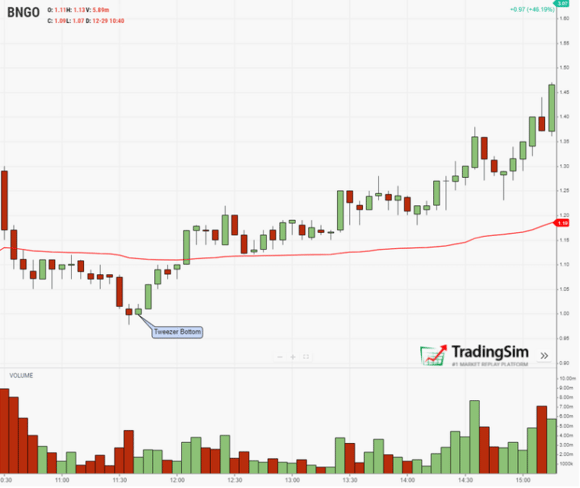
BNGO displays a beautiful Tweezer Bottom candlestick pattern for us here on the 5-minute chart. Pay close attention to the narrow body of the two candles, their symmetry, and the red to green close.
BNGO with a Tweezer Bottom reversal pattern
The volume is of particular interest on this first red doji. Notice how elevated it is here. Given the context, we can interpret this as absorption of supply.
The second candle (green) then diminishes rapidly in volume. Thus, our thesis is confirmed that selling has been absorbed and exhausted.
And what happens in the absence of selling pressure?
The price of the stock rises.
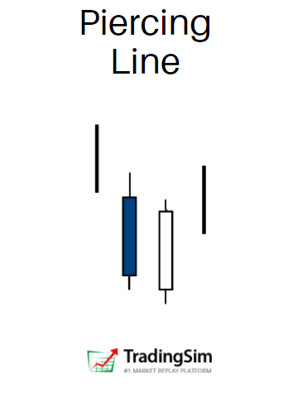
6. Piercing Line
The Piercing Line can look very similar to a Bullish Engulfing pattern. The exception is that the Piercing Line doesn’t completely engulf the prior candle.
It is still considered a bullish candlestick pattern because it overcomes the downward momentum to close at least midway into the body of the previous candle.
Hence the name: it pierces the lower line, but inevitably retracts.
The entry is on the next candle, confirming the uptrend, with a stop at the lows
Bullish Piercing Line Example
Piercing Lines can offer a great risk to reward at the lows of support. They can even act like springs in trading ranges.
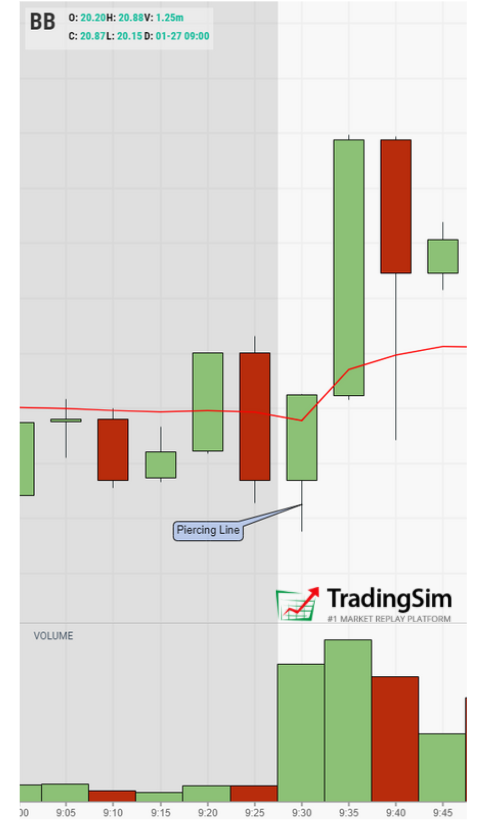
This 5-minute chart of BB shows a combination of an Opening Range Breakout (ORB) with a Piercing Line. Together, it is a combination that can really add confidence to our entry.
BB with an ORB and Piercing Line pattern
As with any setup, the more evidence we have to confirm our bias and plan, the better. For this reason, it is always good to ask yourself:
Is the trend in my favor?
Is it time for a reversal?
Does volume confirm my thesis?
Is the stock at an area of support or resistance?
Do multiple timeframes align with my idea?
What will I risk to, and where should I target for profit-taking?
Your criteria may be more involved, but the idea is the same. Candlestick charts are just a last line of confirmation for an overall plan of attack.
Think of them as an extra indicator.
Conclusion
You may be asking yourself, “How do I recognize these patterns in real-time?”
You may be thinking, well I don’t have the luxury of 10,000 hours of practice. And that may be true. You have a job, kids, obligations, whatever the case may be.
But as Steenbarger notes, if you can drill down the process to specific repeatable patterns, you can achieve mastery much faster.
There is no better way to do this than training your “chart eye” with a stock simulator.
How does this work?
Build Your Mental Repertoire
Imagine being able to replay three years' worth of stock trading days.
For each “training” session, you decide to focus on a single bullish candlestick pattern. As you click through the stock charts for any random day, you look for examples of that one pattern. Over time you save a repertoire, mentally (and digitally if you can take screenshots).
Once you feel you can recognize this pattern, you practice it in replay mode. You spot the pattern, you make the trade. You make notes on what confirmed the pattern, what was the context, what you did right, and what you did wrong.
Then, you move on to the next pattern.
Repeat.
This is what we call deliberate practice. And it pays off in the end.
Want to learn more about bullish candlestick patterns and charts? Check out our free resources here.
John McDowell is the Lead Content Strategist at TradingSim. His journey into day trading began in 2016 after conversations with a retired hedge fund manager. John is passionate about teaching and educating traders, curating content that helps others succeed in the stock market.
8 Best Bearish Candlestick Patterns for Day Trading [Free Cheat Sheet!]
Recently, we discussed the general history of candlesticks and their patterns in a prior post. We also have a great tutorial on the most reliable bullish patterns. But for today, we’re going to dig...
Ever wonder, "What is a doji candlestick pattern?" Is a doji candle bullish or bearish? How about a spinning top? Our goal in this tutorial is to uncover the fundamentals of indecision candlestick...
Stars, Dojis, and Abandoned Babies — Powerful Reversal Strategies
Candlestick patterns can have some crazy names sometimes. Stars, dojis, and abandoned babies? The Japanese were fond of naming candlestick patterns after real-life visual representations. Shooting...


 Candlesticks


