Trading penny stocks is not for the faint of heart. You have to truly be a master of day trading.
The reason is the risks are great and there is little room for error because the action moves so quickly. Well in this article I am going to detail the two patterns I see setting up on a daily basis.
Please note this is not a solicitation to trade either of these patterns. This article is for informational purposes only. Due to the great potential for loss, you really need to know what you are doing before thinking about trading penny stock setups.
Why Even Discuss Penny Stocks?
I was hesitant about even writing this article because I personally do not delve in the penny stock world. I prefer to trade low volatility stocks which have more predictable price action.
Honestly, the patterns between low volatility and high volatility OTCs are the same, it’s just that penny stocks can run to real extremes.
At any rate, I decided to write this article because I know regardless of the risks, penny stocks are and will still be the darlings for some retail traders because of the possibility of quick wealth.
Now after giving this massive intro, let’s dive right into the 2 best day trading chart patterns.
Pre-Market Rise/Market Open Crash
Pre-Market Rise Setup – Example 1
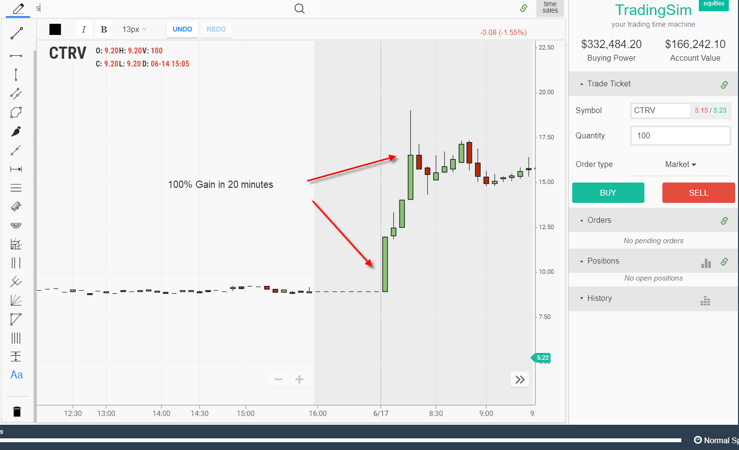
If you have ever tried trading penny stocks on the open, you will see a pattern like the one below. This is an image of CTRV after a big news release of a clinical study.
This resulted in the stock shooting up 100% in twenty minutes.
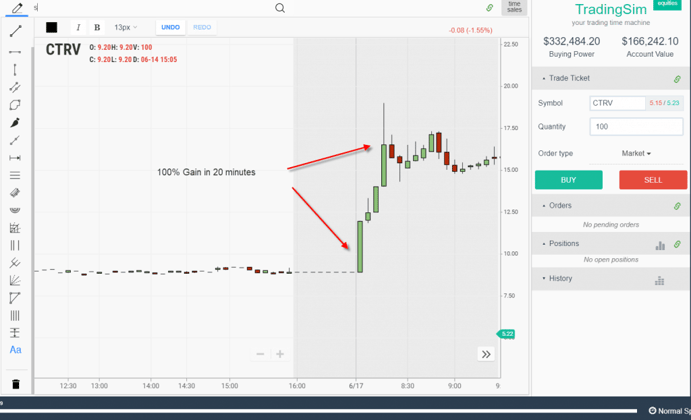
CTRV Morning Rally
Please take that in for a minute. The stock was able to rally 100% in less time than an episode of Seinfeld, even with skipping commercials.
This sort of action is common in the pre-market. Now in this example, the move was swift and didn’t provide much of an opportunity to jump on board.
This is often the case with morning movers. The bulk of the long move occurs in the pre-market. Now, as a trader, you can jump on the bandwagon early. When I say early, trading in the pre-market allows you to grab portions of the gains from the spike.
This is not easy because the volume is thin and spreads are large.
Market Open Selloff Setup – Example 1
If you are going long, the pre-market has its risk, but the open is not much safer. What often happens is the retail traders not willing to jump in the pre-market use the open to hit buy at market. These are all the traders that have been watching the news reports and hanging out on stock twits, just jumping at the bit to invest.
This euphoric push will run the stock up or at least keep it afloat until the 9:50 time slot. What is happening behind the scenes is all of the smart money that bought in the pre-market use the retail penny stock traders as a means to offload their shares ripping down a nice profit.
Then this is the fallout.
The above video is on a 10-minute fast forward speed, but trust me the action is still pretty fast even if you are watching it play out in real-time.
So how does anyone make money trading these stocks?
Well, let me be the first to say it’s possible but not easy.
You can clearly see those that got long in the pre-market and then opened a short position likely made out pretty well.
Pre-Market Rise Setup – Example 2
These penny stock chart patterns play out every single day. I guess it’s human nature and is just unavoidable. At the end of the day, there will always be people looking for penny stocks to invest in, regardless of the risk.
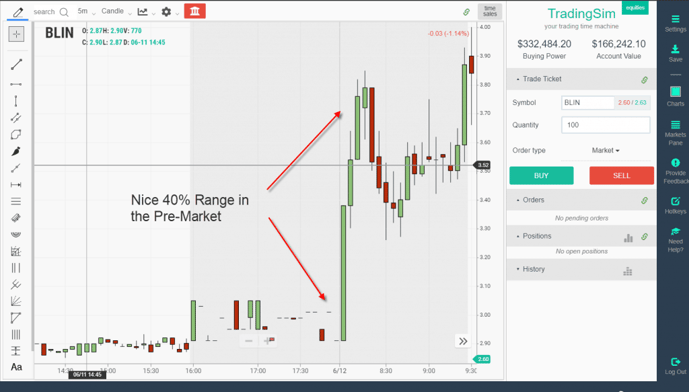
BLIN Pre-Market Move
Again another example of a sharp move. BLIN shot up over 40% during pre-market trading. As you can imagine, every penny stock trader paid close attention to the pattern over their morning cup of coffee.
Similar to the CTRV example, the penny stock traders immediately jumped onboard right on the open. What do you think happened next?
Market Open Selloff Setup – Example 2
Here is another example of a morning selloff. It pains me to even display this action, but it’s far too common for penny stocks. Take a look at what happened to BLIN right on the open.
I am using a 10-minute fast forward speed in Tradingsim so you can see how quickly the action moves against you.
This is just another example of the boom and bust cycle that takes place every day in the market with penny stocks. [1]
So What to Do With These Penny Stock Chart Patterns?
Again, I personally do not trade these setups, because I will flat out lose my shirt. However, there has to be someone out there making a profit. I don’t think there are many, but if someone studies the patterns long enough and puts in the hard work, anything is possible.
The Entry
Pre-Market Long
On the long side, you have two entry options. First is during the pre-market. This will allow you to grab the lions share of the move, but you have to then worry about the possibility of the stock moving against you. The problem here is that if your assessment is off, trying to get out of the position will prove challenging.
It’s nothing to see 15 cent spreads on 3 dollar stocks in the morning.
Opening Market Long
Now, these fail more times than not. As you can see in the prior two examples, the majority of the setups I see on a daily basis fail. If you must get long in the morning, wait for a slight retracement for the shorts to jump onboard. Then buy the break of the pre-market high which should give you some pop from the shorts that got onboard in the pre-market and the short sellers on the open.
This pattern is commonly known as a gap and go breakout. [2]
Opening Market Short
The other option here is to not fight the trend. If you know the stocks have a high failure ratio, just get short.
Now while the hit ratio for going short after the open is higher, the problem here is if you are wrong, the stock can run and run hard.
So you have to honor your stops. If you do not, your penny stock trading career will be short-lived.
How Can Tradingsim Help?
If you are set on trading penny stock chart patterns, then you will need the practice. Well, head over to Tradingsim where you can practice trading penny stocks to see if they are a good fit for your trading style.
External References
- Sykes, Timothy. How to Spot a Penny Stock Pump and Dump. timothysykes.com
- A Simple Day Trading Strategy For Beginners: Gap and Go!. warriortrading.com


 Day Trading Penny Stocks


