Days to Cover Explanation & What It Means for Short Squeezes
Jan 7, 2022
Written by: Al Hill
✓ Reviewed by Kunal Vakil, Co-Founder of TradingSim · Updated Mar 31, 2026
Definition of Days to Cover
Days to cover is a formula which tracks the number of shares short in the market relative to the available float. This allows a trader to see how bearish or bullish traders are on a security. The last component of the ratio is the amount of daily volume.
If you know the number of shares short and compare that to the average daily volume, you can estimate how long it would take for the short sellers to exit their positions. This ratio gives a trader a rough estimate of how much buying pressure is present in the market for a security. It also gives an indication of potential liquidity traps, which can lead to huge short squeezes.
Formula for Days to Cover
The below formula displays how to calculate the days to cover ratio:
Days to Cover Formula
Where to find Short Interest Data
Short interest data is tracked daily by the major exchanges, but is only released bi-weekly to the public. One of the best places to find the days to cover data is http://www.shortsqueeze.com/. The site has a simple tool that works like a ticker where you type in a symbol and it returns the days to cover information and a number of other ratios. The beauty of this is you do not have to go to multiple websites to get the days to cover information from each exchange.
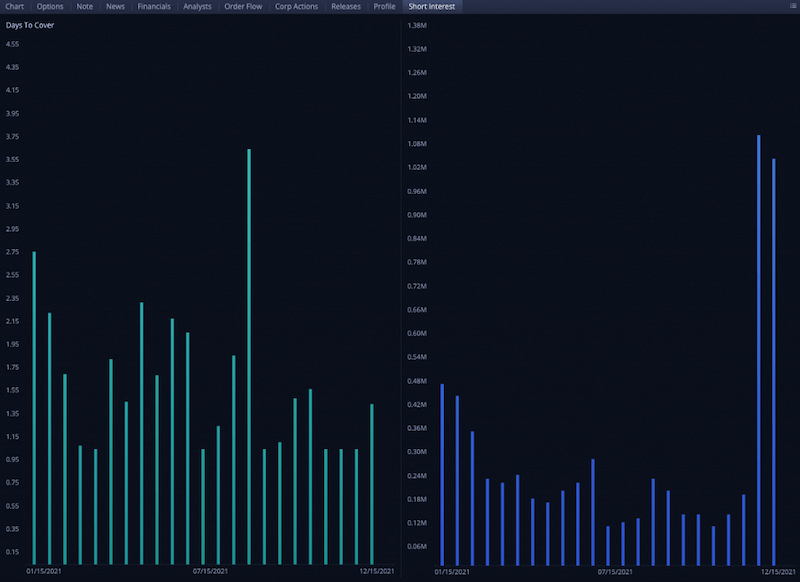
Many brokers will also share this information. For example, a free WeBull account shows the short interest and days to cover as a graph, like this:
Days to Cover and short interest from WeBull
This chart shows the days to cover on the left, and the actual number of shares short on the right. This, of course, is only updated twice per month. For that reason, it’s best to consult a chart and consider more recent volume and price action.
How to trade with Days to Cover info
The days to cover does provide some insight into the relative strength of a potential short squeeze.
Stocks that have double digit days to cover ratios are often prime targets for speculators. But, traders have to realize that every stock that has been beaten appears ready for a bounce. To simply look at the days to cover ratio and buy the stocks with the highest number is a recipe for disaster.
Traders have to not only look at the ratio, but also the technical formation which precedes your entry. If you see climatic volume and a sharp price reversal, odds are you may have a good entry.
Short Interest Table
Below is a historical short interest table for Federal Home Loan Mortgage Corporation (FNM). Notice how the stock had a days to cover value of 9.21 at the end of May which ultimately led to a swift sell off.
Days to Cover Table
AMC Short Squeeze Example
Short squeezes are more likely to occur on small cap stocks than large caps. That doesn’t mean that large caps are immune to short squeezes, it is just that large caps need significantly higher pressure to squeeze the float (number of outstanding shares).
That being said, AMC was one of the more famous short squeezes recently, along with GME and SPRT. Let’s walk through a short squeeze example where AMC rapidly shifted from a bearish to bullish sentiment.
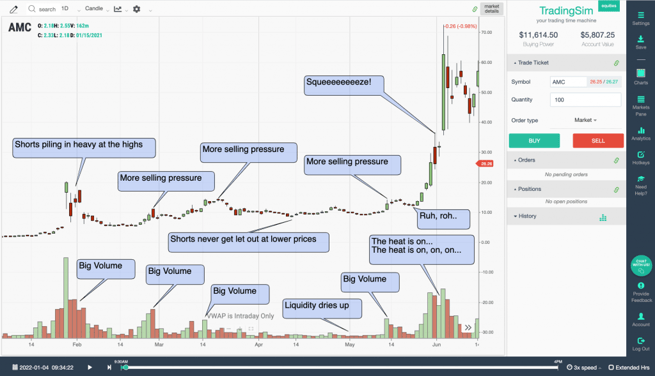
Short Squeeze
This is the daily chart of AMC in 2021. Now have a look at the historical short volume in AMC for early 2021:
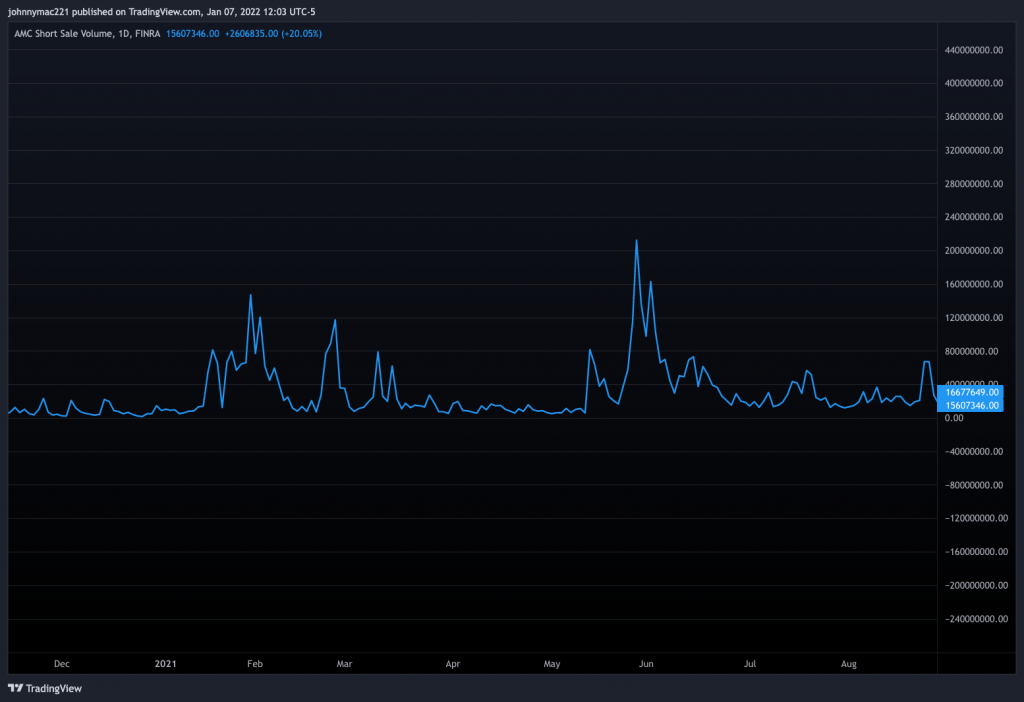
AMC short interest
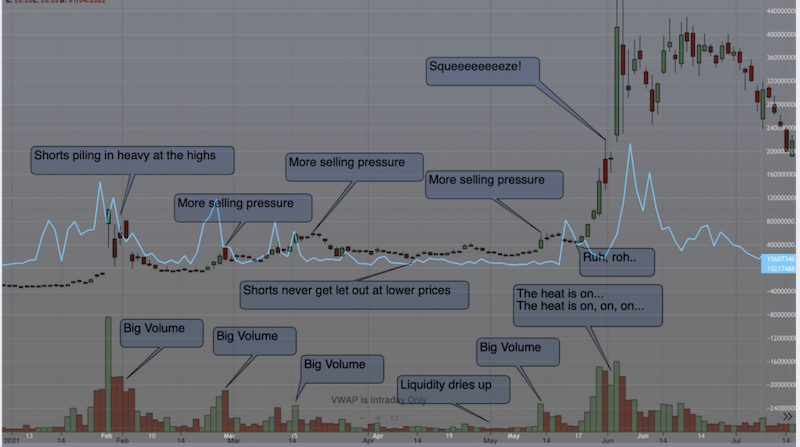
If the print is too small, the spikes in February and March coincide with around 100+ million shares short. Compare this with the corresponding spikes on the price chart shared above. Here is a nice overlay view:
Overlay of short volume and AMC chart
Now, if you consider that AMC has around 450m shares in the float, the compounding effect of 100s of millions of shares short can add up quickly. If price never recedes to allow these shorts the ability to cover over time at lower prices, the effect can be devastating.
Assuming that there were a couple hundred million shares short before the squeeze, the average daily volume before that period was around 40 million shares. Using our formula above, that gives us about 5 days to cover. Sure enough the upward momentum of the squeeze lasted about 6 days total.
Granted, all of this has to be pieced together unless you have access to real-time shorting data.
And from the results above, you can see that there were plenty of shorts to fuel the demand behind the squeeze from $10 to $70.
SPRT Short Squeeze Example
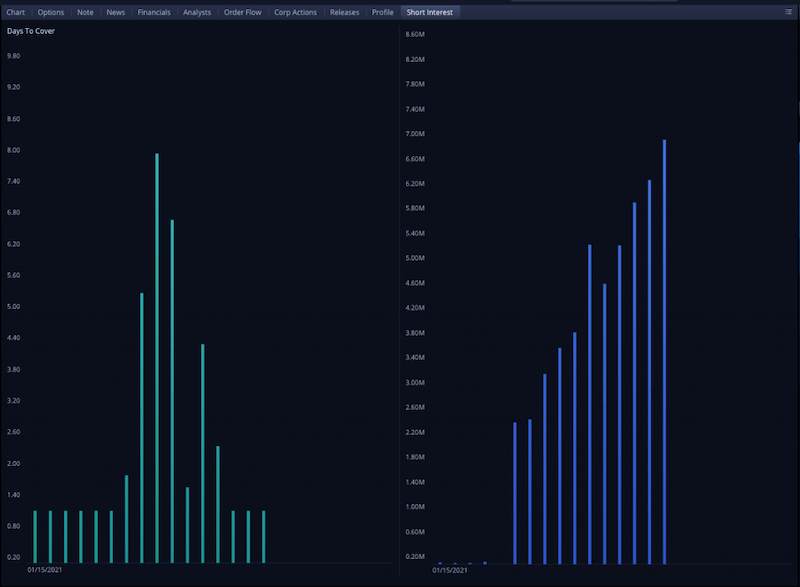
SPRT was another fantastic example of a short squeeze with high days to cover in 2021. Notice that the Days to Cover reached about 8 days back in May of 2021, while short interest was steadily climbing upwards of 3m shares or more.
SPRT days to cover and short interest data from WeBull
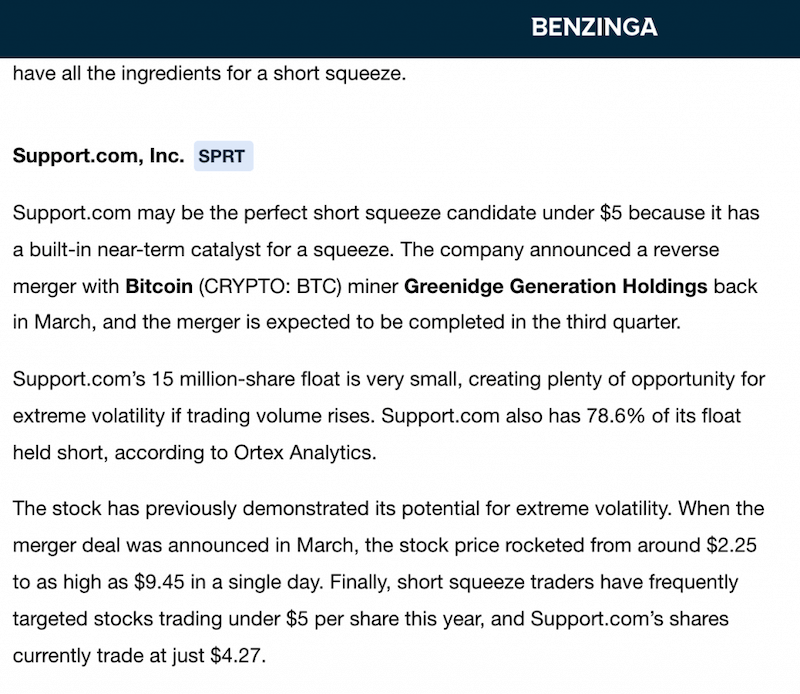
As the short interest rose, at one point it reached at least 78% of the float according to research done by Benzinga at the time.
Benzinga.com article excerpt
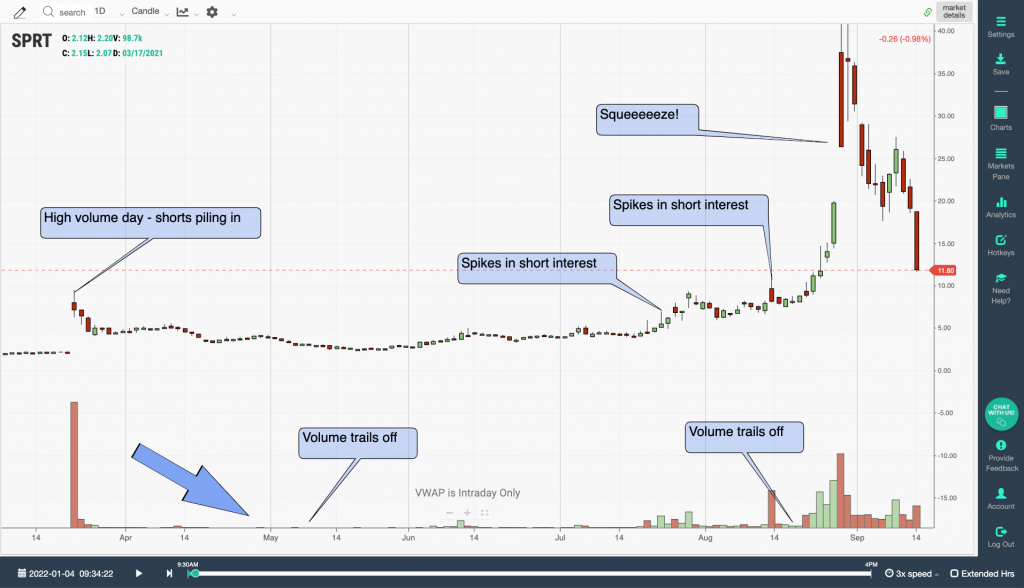
As you can imagine, the stock was poised for a short squeeze. However, we need to see the chart to really time our entries. Let’s go back and look at SPRT from this time period:
SPRT with high days to cover and huge short interest
Compare this chart of SPRT with the AMC chart above. Notice how we get a huge volume increase, then liquidity dries up considerably. This is a big indicator of whether or not a stock with a high short interest has “time” enough to let shorts out of their positions without exponentially moving the price of the stock.
As price rises, you’ll often see the shorts “averaging up” with daily candles that appear to be huge selloffs. But if the watermark gets too high, the shorts are stuck and forced to liquidate.
Finding Short Squeeze Candidates Using the Liquidity Trap Concept
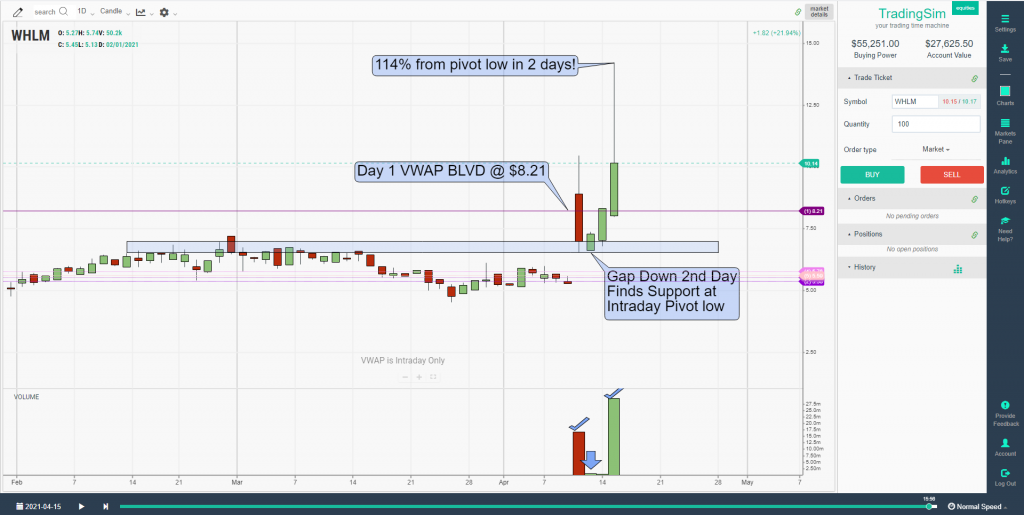
We’ve written extensively on this topic in another post, but we thought it worth mentioning here that some short squeezes don’t take as long to “build”. There are times when low float stocks ramp up on huge volume, sell off, then squeeze right back up in a matter of days.
Take a look at these few examples and see if you can piece together the liquidity trap and sudden increase in days to cover — without actually having seen any days to cover fundamental data.
WHLM liquidity trap in 3-4 days
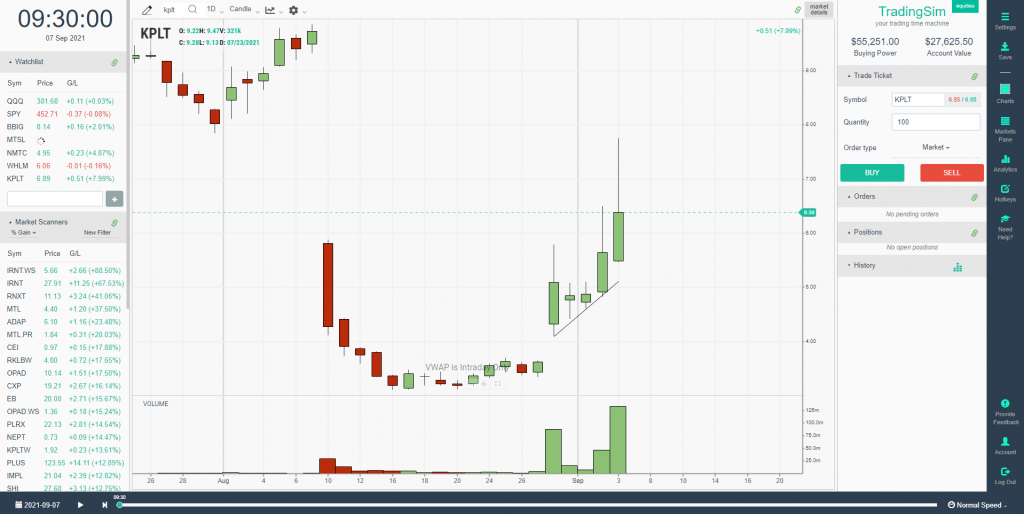
KPLT liquidity trap
Hopefully you can see the concept. A great way to search for these is to scan for stocks that gap up on heavy volume and low float. Keep them on watch in the days after to see if volume recedes, then picks up again.
Other Ways to Find Stocks Ready to Pop
Short squeezes are difficult to identify by simply looking at a stock chart.
You can always analyze the short interest of a stock and the days to cover; however, you will never be sure when a short squeeze will occur.
For this reason, you can look to technical indicators to confirm potential short squeezes.
Oversold (Overbought) Indicators
Identifying technical indicators with reliable oversold readings is the most useful tool for identifying short squeezes. Oscillators are a great type of leading indicator as they provide oversold readings right before the positive price action.
Some indicators which provide oversold readings are:
Stochastic Oscillator
Relative Strength Index (RSI)
Commodity Channel Index (CCI)
Rate of Change (RoC)
Short Squeeze Trading with the Stochastic Oscillator
The stochastic oscillator consists of two lines which are floating in and out of an upper, mid, and lower area.
When the two lines enter the oversold area, we have a potential buy signal. A long trade can be opened when the two stochastic lines cross and exit the oversold area.
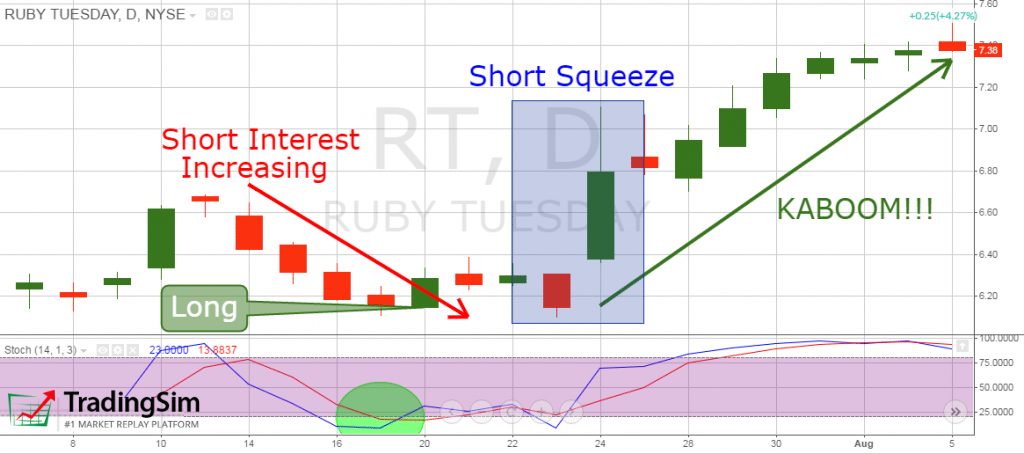
Since we are trading a short squeeze, we need to attain oversold signals from the stochastic. Let’s see how the stochastic could have been applied in these two short term squeeze examples:
Short Squeeze and Stochastics
Notice that during the period when the short interest was increasing, the stochastic lines cross downwards and exited the overbought area.
After entering an oversold condition, the two lines began to trend upwards.
Three days later, we get a bullish explosion of 16.4% for one day and a further expansion to 20%.
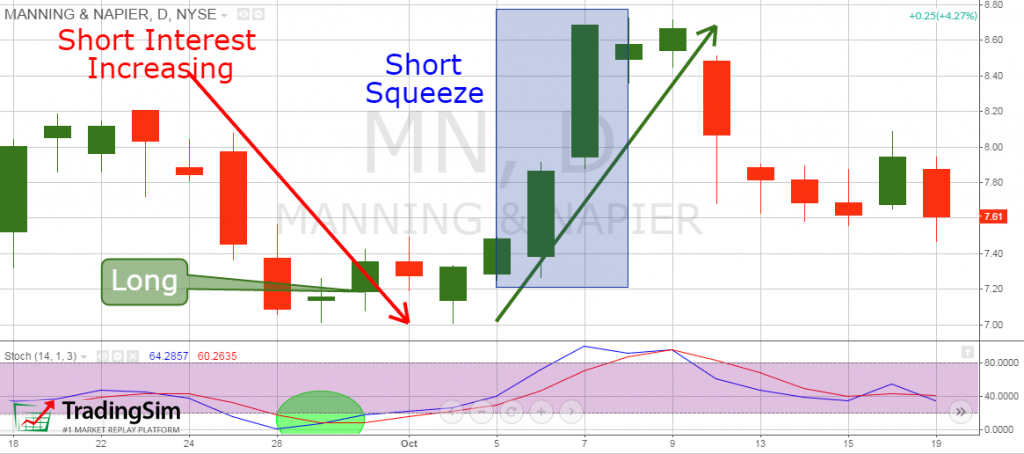
Let’s now apply the stochastic to the other example:
Short Squeeze and Stochastics 2
Again, we have the stochastic oscillator at the bottom of the chart.
While the short interest was increasing, the stochastic lines were also decreasing.
Then the two lines entered the oversold area. After tracking the price action for a few days, once the lines exited the oversold area, we bought MN.
Two days later a short squeeze ensued. MN experienced a strong bullish move where the price increasing 21% in two days.
Short Squeeze Trade Management
Trying to time a short squeeze will be one of the most challenging jobs you find in the market.
The reality is that stocks often have a high short interest because they are crappy companies and the stock price is likely to go lower before making a run.
Think about it, you are in essence trying to catch a falling knife in the hopes of catching the pop.
As we have said many times, in equity trading, you will never be right 100% of the time. We have also shown you profitable trading strategies with only 20% success rate. Short squeeze trading should really be no different than your normal trading. There needs to be a setup there technically, despite the underlying days to cover and short interest fundamentals.
Short squeeze trading can be profitable as the moves are so violent to the upside and there is no limit on how far the stock can run.
The one good thing about trading short squeezes is that you can keep tight stops.
When you enter a trade on a potential short squeeze, you should put your stop below an area of support. Always keep in mind your risk to reward when setting a stop.
Target
This is the tricky part.
Your targets on short squeezed stocks will be somewhat extended. Did you notice that in the two examples above we had a 20% price increase for both? Not to mention that AMC and SPRT more than tripled!
In most of cases a successful short squeeze will lead to a price increase above 15% on small cap stocks, minimum.
However, what are we going to use as a signal in order to exit the market?
The stochastic oscillator will do the heavy lifting when determining your exit.
Simply stay in your long trades until the stochastic enters the overbought area. Do not wait for a line crossover in a bearish direction. Just wait for the lines to enter the upper area and to close one period.
Otherwise, hold for potential climactic action on the daily chart.
Doing the Math
Let’s say you invest $1,000 in each of your short squeeze trades. At the same time, your system has only a 10% success rate. You risk 0.5% in each of your trades. We will take a minimum target of 10% for our trades.
Below is a breakdown of the math:
$1,000 x 0.5% = $5 (loss)
$1,000 x 0.5% = $5 (loss)
$1,000 x 0.5% = $5 (loss)
$1,000 x 0.5% = $5 (loss)
$1,000 x 0.5% = $5 (loss)
$1,000 x 0.5% = $5 (loss)
$1,000 x 0.5% = $5 (loss)
$1,000 x 0.5% = $5 (loss)
$1,000 x 0.5% = $5 (loss)
= 9 x 5 = $45 loss from 9 trades in a row.
$1,000 x 10% = $100 (profit)
So, with 10% success rate and a relatively low target of 15%, we are likely to generate:
100 – 45 = $55 profit per 10 trades.
Please note you have to be ok losing 9 trades in row.
End to End View of a Short Squeeze Trading Strategy
Let’s now wrap up all rules of the short squeeze trading strategy in one example:
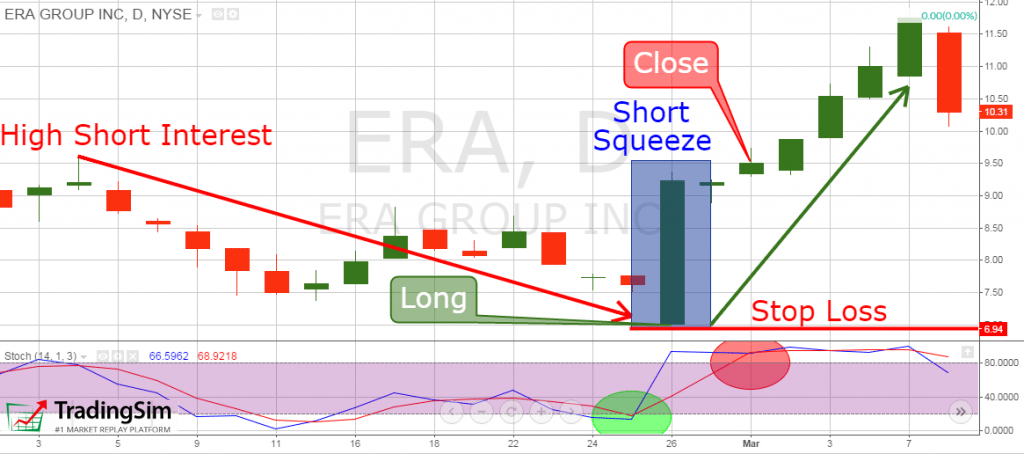
Short Squeeze Trading Example
This is the daily chart of Era Group. The image shows a short squeeze scenario.
Era Group is in a selloff leading into the end of February. At the same time, the Nasdaq is reporting 6 days to cover.
The green circle on the chart shows the long signal we receive from the stochastics.
We immediately enter a long trade at $6.97 per share and we place a stop a bit below this point, since it is the lowest on the chart. Our stop is at $6.94 per share which is 0.43% below the entry price.
The price starts increasing rapidly right from the moment we entered the market.
The first candle during our log trade is huge. At the same time, the stochastic is increasing as well. Three periods (days) after we entered our trade, both stochastic lines cross into the overbought area. This is our closing signal and we exit our trade.
We were able to catch a 51% increase on this trade – unbelievable!
So, investing $1,000 in this trade we would have generated profit equal to $501, while risking $4.3. The trade lasted for three days. The risk to return ratio of this trade is huge!
Please remember, these cases are extremely rare!
Conclusion
The days to cover is a ratio which displays how many days short sellers need to cover their positions.
Days to cover is calculated by dividing the current short interest / average daily volume.
Days to cover helps determine if a stock is a likely short squeeze candidate.
We have a short squeeze when short sellers cover their trades and create extra buying pressure.
Short squeezes can lead to huge price jumps.
An oscillator could be helpful when looking for short squeezes.
When you trade short squeezes you will usually have 10% – 20% success rate.
When you trade short squeezes, you can aim for increases around 15%.
You will usually risk about 0.5% of your investment per trade.
Sometimes, anomalies could occur, where the price increases significantly as illustrated above; however, these cases are extremely rare.
Alton Hill is the Co-Founder of TradingSim with over 18 years of trading experience. He completed the Design Thinking Bootcamp at Stanford’s D.School and brings expertise in Product Development to create the best trading simulation experience. His strategy focuses on trend-following systems, targeting high-volatility stocks with strong primary trends using the 15-minute chart.
The Epic Volkswagen Short Squeeze Explained [Updated May 2026]
The Volkswagen short squeeze of 2008 was epic. Only a few times in history has a stock rocketed that quickly and violently to jaw-dropping prices. In this article, we'll discuss what happened,...
Gamma Squeeze Explained: Options, Dealers & The Feedback Loop [Updated April 2026]
What is a gamma squeeze? By now we’ve all heard about what a short squeeze is and how they happen in the stock market. If we take a short squeeze one step further, we get the gamma squeeze. A gamma...
The GME GameStop Short Squeeze Explained [Updated April 2026]
Unless you have been living under a rock for the past year, you’ll know that GME is the ticker symbol for the wildly popular meme stock, GameStop (NYSE:GME). Why is GME GameStop stock so popular? It...


 Short Selling


