Ever wonder, "What is a doji candlestick pattern?" Is a doji candle bullish or bearish? How about a spinning top? Our goal in this tutorial is to uncover the fundamentals of indecision candlestick patterns, their significance, and a few strategies for how to trade them.
By the end, you should be able to spot bullish and bearish dojis, spinning tops, and haramis! In fact, we hope you'll understand how to trade doji candlestick patterns.
The world of candlestick patterns is exciting. It’s like learning a new language, especially when you are new to the world of trading. At first, charts can appear daunting and mysterious. Like a bunch of noise. But with proper education, candlestick patterns can uncover a world of meaning and opportunity.
Before we move forward, if you haven’t studied the basics of candles and candlestick patterns, be sure to check out our introduction guide.
Doji candlesticks patterns represent indecision in the markets at a given point in time. They reflect either a pause in price action, or a temporary stalemate between bulls and bears. In the right context, these patterns often lead to trend reversals.
But do not be confused. Just because they are called indecision candles, doesn’t mean we can’t interpret the candles.
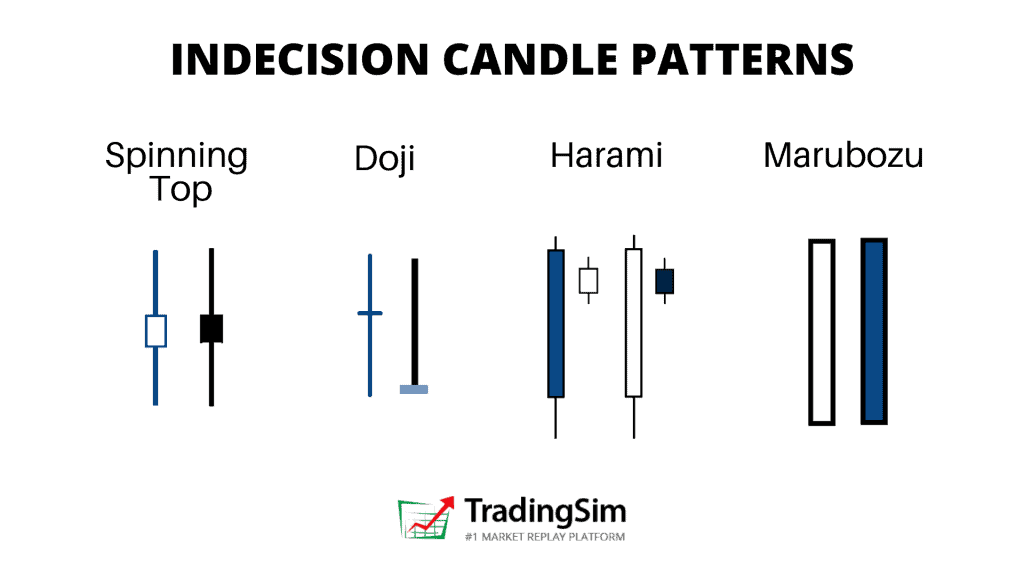
How to read doji candlestick patterns
Most indecision candles are referred to as dojis, spinning tops, or harami candles. They are all quite similar in that they visually represent a small bodied candle on a chart.
Depending on the context, these candles can be bullish or bearish. They can even be neutral in a sideways/non-trending environment.
What we have to pay attention to as traders is the reaction. In other words, what happens next?
But before we get into recognizing strategies and examples, let’s have a quick refresher on how indecision candlesticks are formed.
How Doji Candles Are Formed
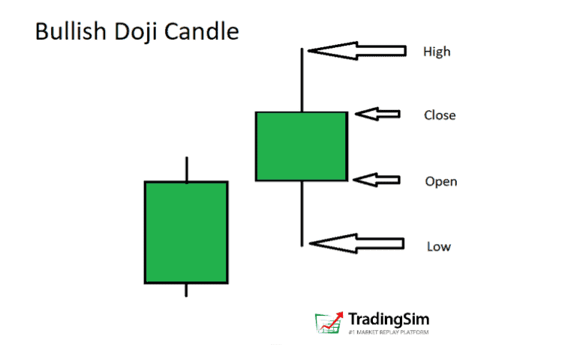
Bullish indecision candles
Here we have an example of a bullish doji, or spinning top, depending on how you want to look at it. They are generally narrow bodied candles with wicks at both ends, both of which are very important.
Why do we call it a bullish doji candle is this instance? Mainly because it close green. But we’ll dig deeper into the “why”.
How to trade doji candlestick patterns?
Generally speaking, doji candlesticks represent reversals or continuation patterns in a trend. It is all in the understanding the wicks.
The wicks at the bottom of a candle indicate demand. Wicks at the top of a candle indicate selling pressure. Why else would the price have stopped at those levels and retracted?
Of course, this is an overgeneralization as there is buying and selling going on the entire time. But this does reveal something to the perceptive trader about the character of the candle.
In short, the key takeaway is that there is no decisive close at the highs, or the lows.
As a result, what is left is a narrow body candle where the price closes near the open of the candle. Therefore, whether you are trading a doji candelstick pattern as a continuation or reversal of the trend, you can simply enter on the break in the desired direction, and set your stop below the doji candle.
Is the doji candle bullish or bearish?
In the formation of a doji candle, bulls and bears were both very active, but neither could gain the upper hand. The outcome of all that effort is essentially ending up where they both began.
You might call it a standoff.
In order to help visualize this, you might imagine the direction of price action as the candle forms — the natural ebb and flow of buying and selling.
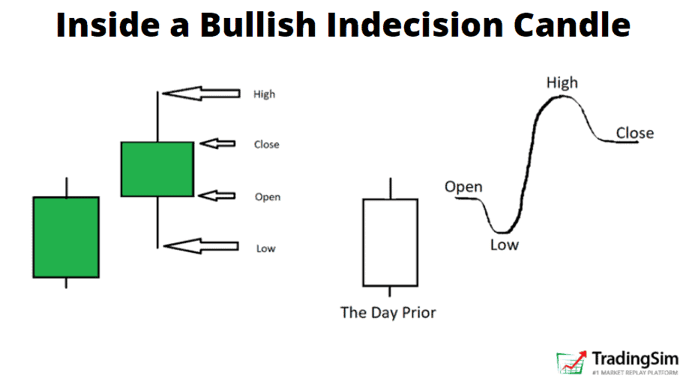
Inside the formation of a bullish doji indecision candle
This can occur in either direction, up or down, as mentioned earlier. To form the body of the candle, we first get a sell off. After the sell off comes a nice bullish rally. However, as the bulls lose steam, bear regain some control into the close of the candle with selling pressure.
The candle closes green, so we call it a bullish doji.
Here’s another example in the opposite direction, just to stay well-rounded:
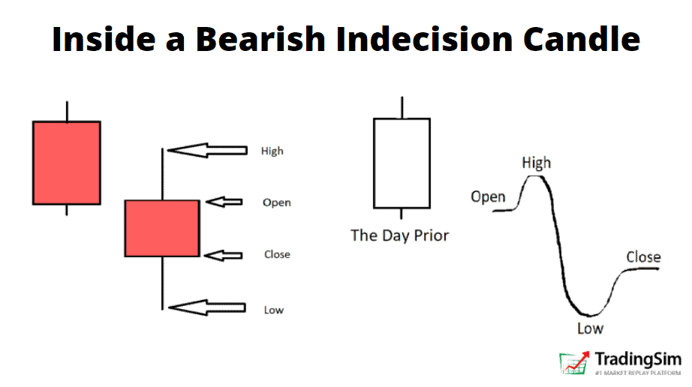
Inside the formation of a bearish doji indecision candle
This time the bulls start out in control and push the price of the stock higher. Unfortunately for them, there is a huge selloff as supply outweighs demand. But towards the close, there is a glimmer of hope for the bulls as they rally back.
Because this candle closes ready, however, we’d call it a bearish doji candle.
How to use the doji candle to buy/sell stocks?
If you think of it in terms of “who is in control,” it can really help tell the story. If the open price is your typical average price paid, once the price dips below that level, the buyers at the highs are now under water.
What happens?
Bears take advantage of their vulnerability, slamming the price lower by shorting, as bulls sell, sell, sell.
On the contrary, once the price reaches an “oversold” level, bears start taking their profits and bull start coming back to buy at lower price. Thus we have a rally.
But overall, the big picture is that there was a lot of buying and selling going on. But no one has a clear upper hand by the time the candle is closed.
It is the overall trend and price action that will help you decide which direction to trade a doji candle and how to best use it to buy/sell stocks.
Up to this point, we have covered the basics of what Indecision Candles and doji candlesticks are and how they are formed. Let’s look at some examples of the types of indecision candle patterns you might run into while trading.
4 Bullish and Bearish doji Candlestick Patterns
In these sections, we’ll look at two types of doji candles, the Dragonfly Doji and the Gravestone Doji. We’ll also examine the Spinning Top and Harami candles. We hope by the end of this section you will understand how to trade doji candlestick patterns.
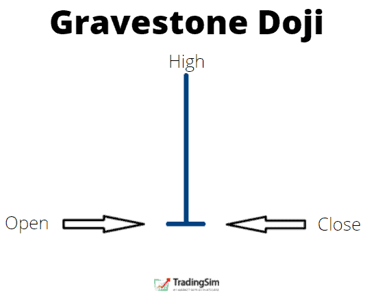
1. Gravestone Doji
Visually, it is long narrow wick, with a very narrow base at the bottom. There is virtually no body in the candle. Imagine the side profile of a gravestone. This is it’s namesake.
Similar to other dojis, the price of the opening of the candle is almost identical to the close. Only this time, the open was at the very low.
As the candle forms, it pushes higher, only to find exhaustion at the highs. Consequently the price collapses on itself and closes where it started.
Context
When you find a Gravestone Doji in an uptrend, what is it telling you? If price is being pushed higher in the trend only to reverse on itself, that is weakness, right? We can call this a bearish Gravestone doji candle.
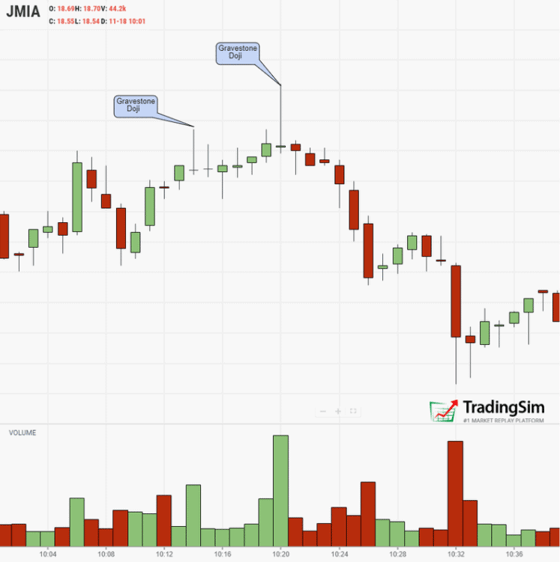
Let’s look at an example with JMIA on a 1-minute chart:
JMIA intraday chart with Gravestone Doji Indecision Candlestick Pattern
Now, you’re probably thinking, “why do we call it an indecision candle if it is a possible reversal pattern?”
Again, it all boils down to context, context, context.
In this example, pay close attention to the trend. Then narrow your focus on the volume signature associated with the Gravestone Doji candles. Note how elevated the volume is there compared to the rest of the candles on the chart. That’s the context you need: effort versus result.
The effort comes in to push the stock price higher, but it reverses on heavy volume.
Where Should You Enter?
Because these are indecision candles, we need to wait for confirmation. Imagine if you had taken the first Gravestone Doji to the short side in the example above. You would have been stopped out.
Sometimes it is better to wait for a close below the bearish doji, a nice red candle, to confirm our thesis. In the example above, we don’t get that red close until the second Gravestone candle.
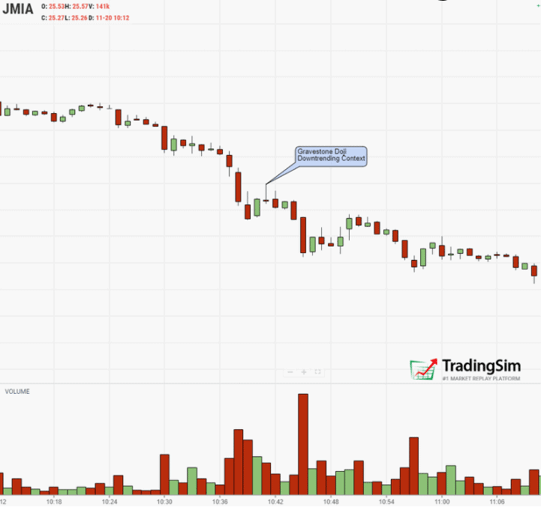
Now, what if you spot one of these in a down trend? Would you consider it strength or weakness? A bullish or bearish doji candle? Think about it for a moment. Price tries to rally, but it gets shoved back down.
Let’s look at an example:
JMIA intraday Gravestone Doji candle explanation
As you can see, it is all about the context, and all about the story behind the price and volume. Price tries to rally. However, it falls short after the Gravestone Doji dashes the hopes of the bulls. Thus, the downtrend continues.
For our entries, we wait for the close of the doji, and sell short on a close lower in the next candle or two. As always, set a stop at the high of the Gravestone Doji, or in the body of the wick.
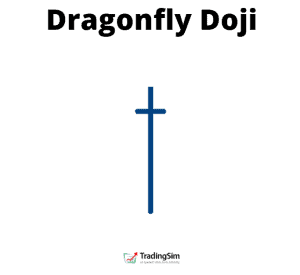
2. Dragonfly Doji
The Dragonfly Doji is essentially a Hammer Candle, but with a narrower body. It can also be a bullish or bearish doji candle, but is considered the opposite pattern to the Gravestone Doji. For this reason, we’ll call it bullish.
As an indecision candlestick pattern, it has all the same qualities we have mentioned for the Gravestone Doji. Only this time, in reverse.
Selling pressure comes in, creates a long tail/wick, then buyers show up to raise the price of the stock.
Why is this indecision? It all has to do with context.
Context
Let’s suppose we are in a downtrend. Sellers appear to be in control. However, we are surprised when the price begins to reverse, culminating in a bullish Dragonfly Doji pattern.
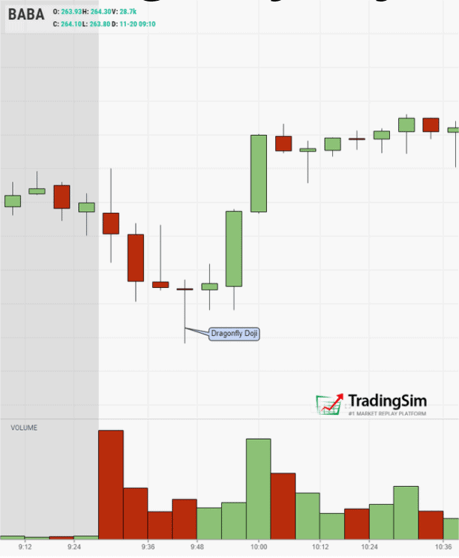
Such is the example with BABA below. We call it indecision because we are at a crossroads. Bears were firmly in control. Now, we aren’t sure anymore.
The answer lies in what comes next.
BABA Dragonfly Doji indecision candlestick pattern
Clearly, bulls took advantage of the situation and ultimately took control by reversing the trend.
Where Should You Enter?
Like the Gravestone Doji, you want to wait for a nice close to confirm the reversal. In this instance, we might weight for the next candle, or the second thereafter to break higher.
Stops can be set in the body of the Dragonfly Doji or lower depending on risk tolerance.
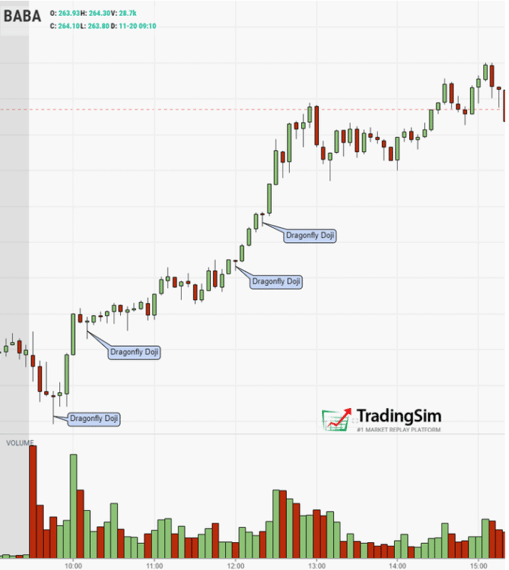
Dragonfly Dojis can show up in mid-trend as well, offering opportunities to add to positions.
On the same intraday chart (BABA) from above, we see the healthy trend that followed our initial reversal. Take a moment and study this next chart to see how the handful of dojis we’ve pointed out lead BABA to higher prices.
BABA series of Dragonfly Doji candlestick patterns
Effectively, they are areas of indecision that resolved higher.
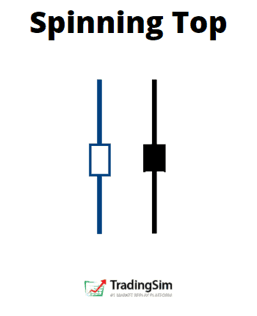
3. Spinning Top
According to IG.com, the Spinning Top is known most often as a continuation pattern. The concept being similar to other indecision candles in a trending environment.
However, there are times, according to context, that the Spinning Top can signal a reversal of trend.
Bullish and bearish Spinning Top candlestick patterns
As with most candlestick patterns, there is a bullish and bearish version to the Spinning Top. For a detailed explanation, be sure to revisit our discussion and slides above.
In short, for a bullish Spinning Top, it has to open, move lower, rally, and then close green. Flip this sequence for the bearish Spinning Top.
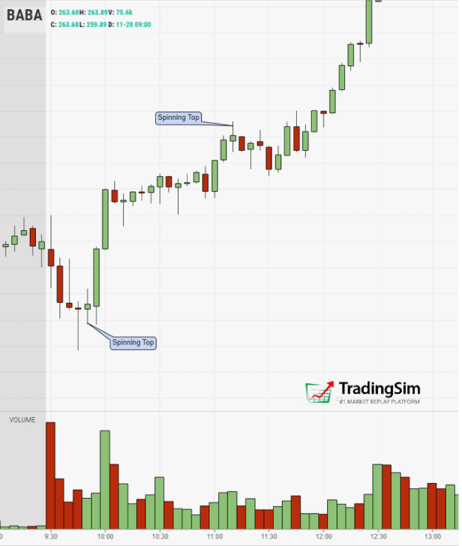
Let’s stick with our analysis of BABA and see if we can uncover a few Spinning Tops in the trend.
Context
Firstly, we notice that a bullish Spinning Top forms immediately after the bullish Dragon Fly doji candle at the bottom of the down trend. What is this telling us?
Look closely at the body of the three doji candles in secession at the bottom of the chart in the example belowe. Note that their opening and closing prices are all extremely close together. You have an Inverted Hammer, followed by a Gravestone Doji, followed by a Spinning Top.
Talk about indecision! Would these be bullish or bearish dojis?
What we see is that the bulls and bears were fighting to win this price level, judging by the tightness of the candle bodies and their closing prices. Bulls were defending this level heavily, while bears were trying to push it down.
Thus, the indecision on whether not we would go lower.
BABA bullish Spinning Top indecision candles
Thankfully for the longs, after the Spinning Top, the price moves decisively and violently higher on heavy volume, signaling our long entry. Now, we can decisively say it was a bullish doji pattern.
Secondly, we see another Spinning Top in the middle of the uptrend. What do we make of this? After all, we have been trending upwards. Could this be a reversal? Or, just a pause in the trend?
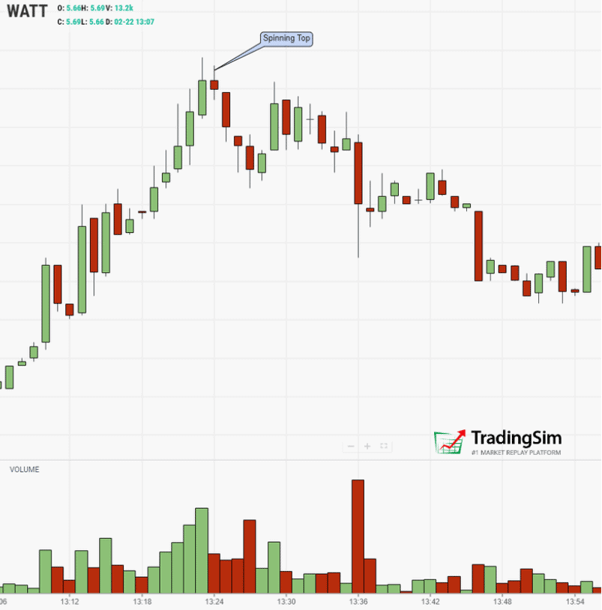
Perhaps you have some profit taking, but the trend doesn’t seem very extended. Let’s call this a pause, and look for a real Spinning Top reversal.
WATT gives us such a reversal with a spinning top on the intraday 1-minute chart in this example:
WATT Spinning Top reversal bullish doji
Where Should You Enter?
Ideally, the entry is on the break lower as the second candle forms and surpasses the Spinning Top body and wick. Some may wait for the close of that candle to confirm, others are willing to enter early and risk above the Spinning Top.
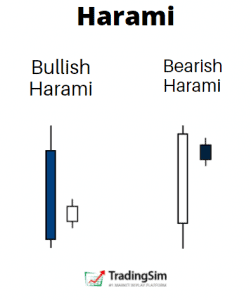
4. Harami
The Harami is a unique candlestick pattern. It can be a reversal or a continuation, though usually thought of as a reversal.
The name comes from the Japanese word for “pregnant.” Evidently, the Japanese thought the pattern resembled a pregnant woman.1
Along those lines, the Harami candle is a narrow body candle that is an “inside” candle. Hence the allusion to a baby in the body of the larger candle.
For a bearish Harami candle, the body of the Harami must be a bearish or red/black doji candle immediately following a longer bodied bullish candle.
In contrast, the bullish Harami doji must be bullish/green and close inside a large bodied bearish candle.
Context
By now, you should understand what context will likely matter for the Harami, or any doji candlestick pattern. What do we look for?
Trend: up, down, sideways?
Volume signature
Extended? Oversold or overbought conditions?
Time frame?
These are just a handful of important criteria you will always want to consider when analyzing the efficacy of the pattern.
For example, if it is a bullish Harami pattern, is the stock in an oversold downtrend with a high volume spike signaling a reversal?
Or, is the stock in the middle of a young uptrend and only consolidating?
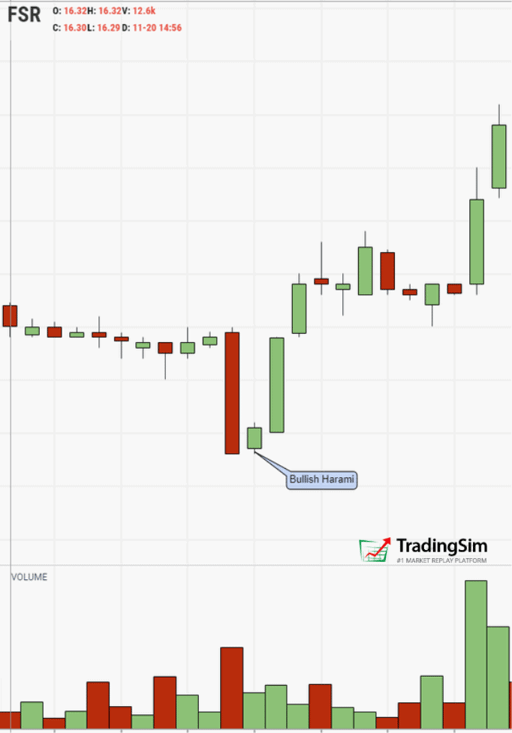
For the first example, lets look at FSR. After a steady decline followed by a massive flush on heavy volume, price pauses. It pauses inside the bearish red candle signaling indecision.
Price pauses then reverses with this FSR bullish Harami doji candle pattern
You expect price to continue lower after such a bearish red candle. Yet, to the surprise of the bears, the downward momentum is stopped and reversed.
It would be safe, then, to assume that the supply in that red candle was either absorbed, and/or no more sellers were present thereafter, sending the stock price higher.
On the flip side, you can find the exact same pattern as a bearish reversal at the top of an uptrend.
To switch gears on this pattern, let’s examine a continuation pattern with a bearish Harami pattern. The peculiar nature of this example is that it isn’t actually “bearish” for the overall trend. The name simply implies that there is a bearish/red Harami doji candle inside a bullish candle.
Bearish Harami in an otherwise continuing uptrend
You might be thinking, “Great, how confusing!”
But before you toss up your hands, remember that it is all about context, as we have been belaboring in each of these examples. Reversals are different from continuation patterns, and you’ll need to understand both in trading.
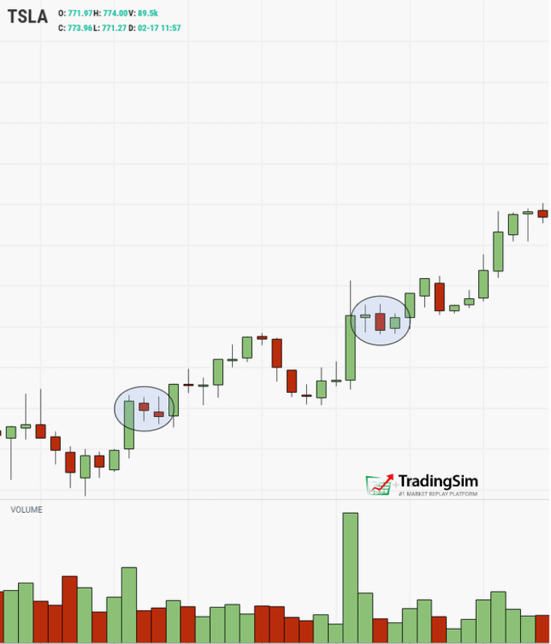
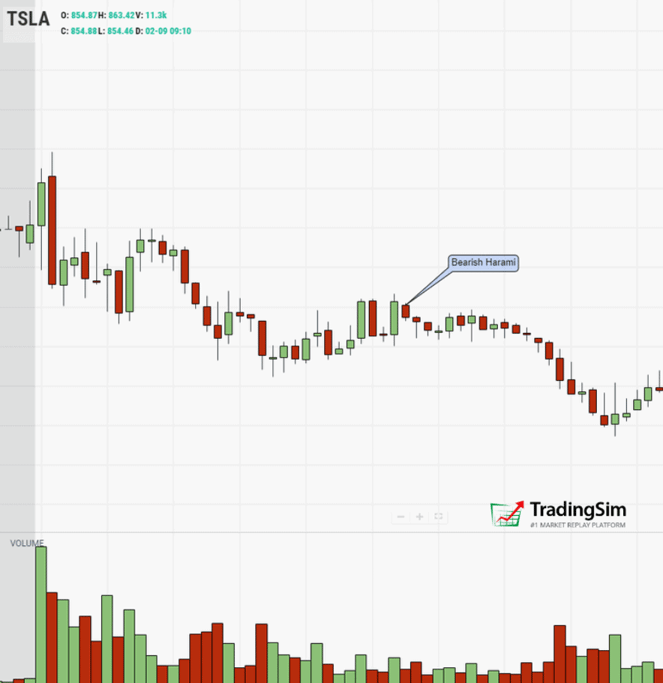
Here is the mirror image for a down-trending context:
TSLA bearish Harami candle continuation pattern
When Should You Enter?
For the Harami, you obviously want to pick the direction of the prevailing trend, or the new direction of the reversal. To do this, you need to wait for the confirmation.
In other words, is the Harami candle broken to the downside, or the upside, and what is the context. For a reversal long, take the next candle that breaks the upside of the Harami and set your stop below the Harami.
For a continuation downward, just reverse that process.
More Strategies For Trading Indecision doji Candles
These can be great patterns to play with the ABCD strategy. Be sure to check out our webinar on this explosive pattern!
For more on Haramis, our in-house trading expert Al Hill covers a handful of strategies in this fantastic tutorial.
How To Practice doji Candle Pattern Recognition
As with any trading strategy, experience is paramount. Do you have time to sit in front of the markets every day? If so, how many of these patterns will you be able to find? How long will it take you to master the patterns?
To that end, simulated training can supercharge your pattern recognition skills. Deliberate practice on your own time, coupled with analysis of your trades, are the most efficient method for learning volume and price analysis.
With enough practice, you might just find yourself an expert at discerning bullish and bearish doji candles like Gravestones, Dragonflies, Spinning Tops, and Haramis.
Stars, Dojis, and Abandoned Babies — Powerful Reversal Strategies
Candlestick patterns can have some crazy names sometimes. Stars, dojis, and abandoned babies? The Japanese were fond of naming candlestick patterns after real-life visual representations. Shooting...
Trading without candlestick patterns is a lot like flying in the night with no visibility. Sure, it is doable, but it requires special training and expertise. To that end, we’ll be covering the...
The Abandoned Baby Candlestick Trading Pattern: Bullish & Bearish
We have discussed a number of candlestick patterns on the Tradingsim blog. If you haven’t checked out our other resources be sure to do so, you’ll find a really nice candlestick pattern cheat sheet...


 Candlesticks


