Gravestone Doji Candlestick: How to Trade the Bearish Reversal [Updated April 2026]
Apr 26, 2026
Written by: Al Hill
✓ Reviewed by Kunal Vakil, Co-Founder of TradingSim · Updated Apr 26, 2026
The doji candlestick is one of the most common candlestick reversal patterns you will find in the market. The Gravestone Doji is a variation of this reversal pattern. When correctly confirmed, the Gravestone Doji can lead to great opportunities for profit in day trading.
In this post, we’ll cover how to trade the Gravestone Doji with real examples, plus strategies on how to enter trades and manage risk based on this popular indicator.
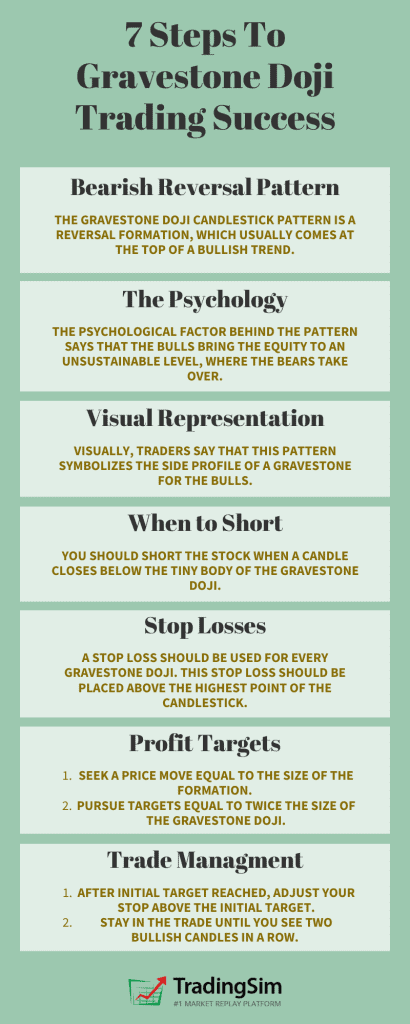
7 Steps to Graveston Doji Trading Success
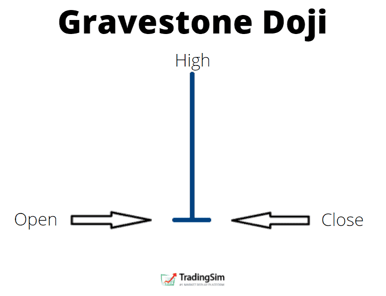
How is the Gravestone Doji Formed
The Gravestone Doji is a candlestick bar whose open, low, and close all culminate at the low of the bar.
As the name implies, imagine looking at the side profile of an actual gravestone. Hence the long upper wick and the narrow base at the bottom reflect what a gravestone would look like from the side. The Japanese were fond of naming candlestick patterns for their likeness in real-life.
You might also say that a Gravestone Doji represents the gravestones of the bulls that have died defending their territory.
Its bullish counterpart is the Dragonfly Doji. We cover this pattern in another post.
The psychology behind the candle is that the bulls were in control in the beginning. They drive the price of the security up to an unsustainable level. From there, the bears take control and are able to sell the security down to its low by the end of the session.
Contextually, when this occurs at the highs of an extended uptrend, we interpret this as exhaustion. This gives us the confidence to take a short position when all criteria are confirmed.
Charting Example of Gravestone Doji
Now that you have an understanding of the setup, let’s review a real-life chart example.
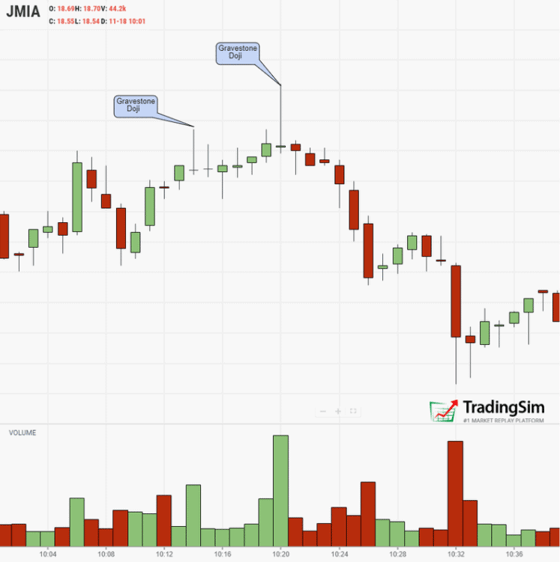
Bearish Reversal Candle Example
Above is a classic Gravestone Doji at the end of an uptrend.
Showing up this late in the uptrend, it was an early sign that the bulls were losing control and a price drop was likely on the horizon.
Once the bears took control, this led to heavy selling on high volume.
Our job as traders is to use these price analysis tools to help us take advantage of opportunities like this.
While this first example covers a bearish reversal setup, we can find some examples as continuation patterns. It is essentially the same as a reversal, just on a smaller rally.
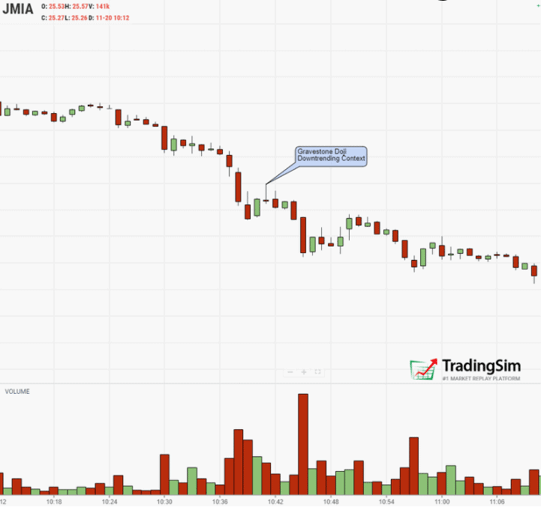
Bearish doji downtrend continuation pattern
Note the attempt to rally here, only for bears to quickly reassert their dominance in the downtrend. Markers like this can offer opportunities to add to short positions with confidence as you manage the down-trending trade.
Trading the Gravestone Doji
Now that we have covered the basics, let’s dive into a trading example.
It is important to mention that the risk management rules for this strategy will vary due to the size of the wick. We will cover this in more detail shortly.
Entering a Gravestone Doji Trade
Whenever you see a Gravestone Doji appear in the context of a bullish uptrend, this should give you reason to pause as the trend reversal could come at any time!
Once you identify the candlestick pattern, you will want to find a trigger that lets you know when to enter the trade.
A simple trigger is the low of the candlestick. Once a candle closes below this level, you can open a short position.
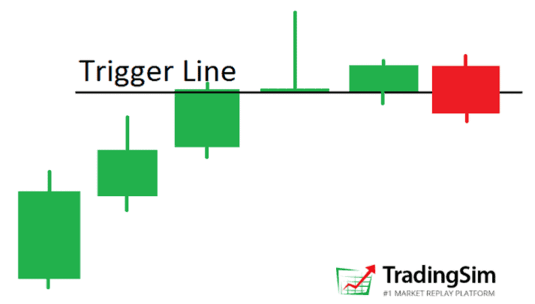
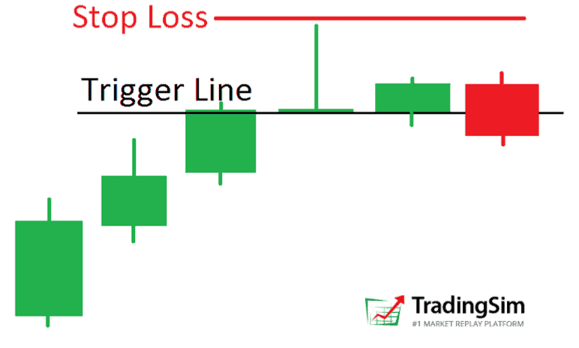
Doji Trigger Line
In the image above, we outline the trigger line that shows the exact moment when you should short the stock after identifying the doji candle.
The reason you want to wait for a close below that line is clear. We see a slight hesitation comes on the next candle, which is relatively small and doesn’t manage to break the trigger line.
What if this had continued higher?
Let’s look at the example from above one more time to see when that might occur:
Bearish Reversal Doji Candle Example
Notice that the first reversal doji gives us a false confirmation. We never close below the candle. It is the second doji that puts the nail in the coffin, no pun intended.
Thus, the short signal comes on the second candle after the doji with a break and close below the trigger line.
Risk Management when Trading the Gravestone
When you trade the Gravestone Doji, you need to determine where to place your stop loss order.
The proper location of a stop loss is above the high of the Gravestone Doji candlestick.
The one caveat, as we mentioned earlier, is that for each Gravestone Doji, your level of risk will vary depending on the length of the candlestick wick.
Bearish Gravestone Doji with Stop Loss and Trigger Line
This is the same sketch from above. However, this time we have added the location of the stop loss order.
For this particular candelstick pattern, we have devised a method for how to set profit targets for when to exit the trade.
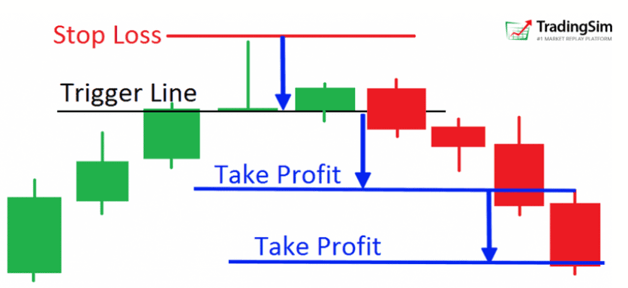
Bearish Gravestone Doji with Profit Target
Ideally, we want to have our reward be at least double our risk. For that reason, here is a simple calculation:
The fist profit target equals the size, or range, of the doji candle. This would give us a roughly 1:1 reward/risk ratio. Not ideal, but at least we can lock in some profits.
The second profit target is double the size of the gravestone doji. This will get us closer to a 2:1 reward/risk ratio. Much better.
You will need to determine which profit target to use based on the volatility of the chart and the range of the Gravestone Doji wick.
Risk Management after Reaching Target 1
When the price reaches the first target, you can either decide to exit the trade, or wait to see if target two is reached.
A simple method for protecting your portfolio if you want to chase the big gains is to move your stop to breakeven after the first target is reached.
If you find yourself emotional, take a small portion like 1/4 of your position and bag those profits. This way, if you move your stop lower, you’ll never be red on the position, giving you patience to let it work.
Trading with the Gravestone Doji Candlestick Pattern
Now that we’ve summarized all the basic rules required to trade the Gravestone Doji candle, we will now cover a few real-life trading examples.
Example 1
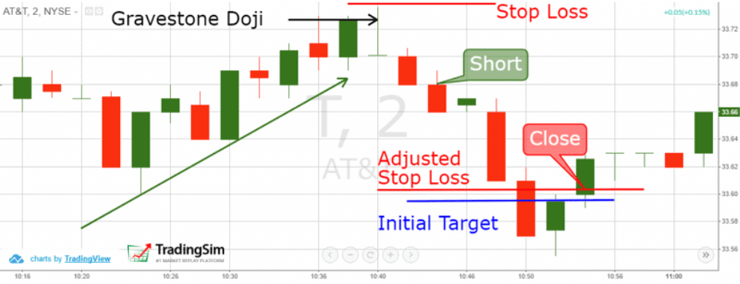
Graveston Doji Trading Example 1
Above is a 2-minute chart of AT&T intraday.
The trend is upward with a last push to increase price only to close lower. The result is a Gravestone Doji reversal candlestick.
The next candle after the doji breaks the trigger line, therefore we open a short position.
Our stop loss should be placed above the high of the gravestone doji to ensure we protect ourselves if the trade goes against us.
For this example, we are going to go with twice the size of the Gravestone Doji as our profit target.
Eight minutes later, AT&T reaches our initial target. At this point we could exit the trade and book our profits. The other option is to wait for a further price decrease and exit the trade later.
Profit targets will vary for different traders. Here at Tradingsim, we like to exit at the profit target. Our reasoning is that the stock market moves extremely fast, and you may not have the luxury of waiting on a bigger move.
In addition, there is the psychological strain of always wanting more, but never quite getting all of a move.
Of course, this can depend on the bigger picture and how oversold the stock is on multiple time frames. In this case, it may be worthwhile to wait for lower lows.
Patience can pay off sometimes, just don’t let the trade become a headache.
From our example above, once you wait for more, AT&T reversed and moved higher only to stop us out of the position.
Let’s now take a look at another trading example.
Example 2
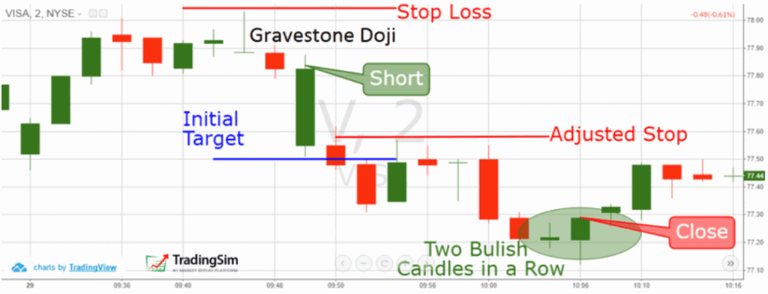
This is the 2-minute chart of Visa. The image shows another Gravestone Doji trading example; however, this time the results are more favorable than our first trading example.
Gravestone Doji Example 2
The price action is very similar to our last trading example, but in this case the stock does not reverse after hitting our target, but rather continues lower.
Patience paid off.
Our initial target is located at a distance equal to twice the size of the doji pattern — shown by the blue line. This gives us a 2:1 Reward/Risk ratio, or “2R”.
While the price reaches our initial target on the chart after 6 minutes, we adjust our stop loss and hold the position in hopes of more profits.
Ultimately, we were correct and the price breaks down further to make new daily lows. We exit the trade after we see two bullish candles in a row, our signal to exit.
We nearly doubled our profits!
Tutorial Review
Let’s review a few bullet points on how to spot the Gravestone Doji pattern and trade it with success:
The Gravestone Doji candlestick pattern is a reversal formation, which usually comes at the top of a bullish trend.
The psychological factor behind the pattern says that the bulls bring the equity to an unsustainable level, where the bears take over.
Visually, traders say that this pattern symbolizes the side profile of a gravestone for the bulls.
You should short the stock when a candle closes below the tiny body of the Gravestone Doji.
A stop loss should be used for every gravestone doji. This stop loss should be placed above the highest point of the candlestick.
You have two options for setting profit targets when trading the gravestone doji:
Seek a price move equal to the size of the formation. I recommend this for longer gravestone doji candles.
Pursue targets equal to twice the size of the gravestone doji. This is a better option when the doji candle is smaller.
After your initial target is reached, be patient if the stock keeps trending in your favor. But follow these two simple rules:
Adjust your stop above the initial target.
Stay in the trade until you see two bullish candles in a row. This hints that the bearish move might be over.
How to Practice the Gravestone Doji
As with any pattern or strategy in the stock market, it takes time and effort to recognize them in real-time.
We recommend trading in a simulator with at least 20 successful attempts on this bullish reversal pattern before employing real money in the market.
Once you have your dataset, you can measure your success. Then you will have confidence to take the trade knowing your ratio of wins to losses!
Gravestone Doji: Quick Answer (Updated April 2026)
A gravestone doji is a single-bar bearish reversal candlestick. It opens and closes near the low of the bar, with a long upper shadow and little to no lower wick — the silhouette of a tombstone. Buyers pushed price up during the session but sellers absorbed every gain and drove the close back to the open, signalling that overhead supply has overwhelmed demand. The pattern has the highest reliability when it appears at the top of an uptrend, near a known resistance level, and is followed by a confirming bearish bar.
Bias: bearish reversal (most reliable at the top of an uptrend, less reliable inside a range).
Confirmation: a bearish close on the bar that follows the gravestone doji.
Stop: above the high of the gravestone doji bar.
Target: previous swing low or 1.5×–2× risk, whichever comes first.
Time frame: daily and 4-hour produce the cleanest signals; 5-minute charts work for liquid intraday names.
How to Identify a Tradable Gravestone Doji
Most "gravestone doji" patterns on the chart are noise. Use these four filters to separate the high-probability signals from the rest:
Open and close within a few cents of the bar's low. A doji body of more than 10–15% of the total bar range disqualifies the pattern. The open and close should be effectively equal and at the bottom of the bar.
Long upper shadow, minimal lower shadow. The upper wick should be at least 2× the size of the candle body. The lower wick should be a few ticks at most.
Location matters more than the candle itself. A gravestone doji at all-time highs or against a known resistance level (prior swing high, daily VWAP rejection, weekly pivot) is meaningful. The same shape in the middle of a range is noise.
Volume confirmation. A gravestone doji that prints on above-average volume tells you institutions defended the level. Low-volume gravestones are more likely to fail.
Entry, Stop, and Target Rules
Component
Rule
Confirmation bar
Wait for the next bar to close below the low of the gravestone doji.
Aggressive entry
Short on the close of the confirmation bar.
Conservative entry
Wait for a pullback to the gravestone doji's open/close (now resistance), then short the rejection.
Stop
Above the high of the gravestone doji bar. If the candle is unusually tall, use ATR(14) × 0.5 above the high instead.
Target 1
Previous swing low or 1.5× risk.
Target 2
Trail the stop above the descending 20-period EMA for an extended down move.
Time stop
If price hasn't moved 1× risk away from entry within five bars, exit at break-even.
Gravestone Doji vs. Shooting Star vs. Inverted Hammer
These three candles look similar but signal different things. Memorize the differences before you trade them:
Gravestone doji: open = close, both at the bar's low. Bearish reversal at tops.
Shooting star: small body at the bar's low, long upper shadow. Bearish reversal at tops, slightly weaker than the gravestone because the body shows some closing range.
Inverted hammer: same shape as a shooting star but appears at the bottom of a downtrend. Bullish reversal — the long upper shadow shows buyers stepped in.
Context determines meaning. The same candle shape is bullish at lows and bearish at highs.
The Three Failure Modes That Trap New Traders
Gravestone doji losses cluster around a few predictable mistakes:
Trading the candle without confirmation. Do not short on the close of the gravestone doji itself. Wait for the next bar to close below the doji's low. Many gravestones print and then fail to follow through.
Ignoring the trend filter. A gravestone doji inside a strong uptrend is often absorbed within two bars. Use the 50-period moving average as a regime filter — a gravestone above a strongly rising 50 MA is fighting the tape.
Stops that are too tight. The high of a gravestone doji is by design near intraday resistance, which means it gets retested often. If your stop is at the absolute pip above the high, you'll get scratched out before the move plays out. Add ATR-based buffer.
Practice the Gravestone Doji in the TradingSim Simulator
Reading about reversal candles is not the same as recognizing them in real time. Use the TradingSim simulator to drill the gravestone doji pattern on real historical tape:
Sessions 1–3: Replay 20 historical sessions on liquid stocks (AAPL, NVDA, TSLA) and the e-mini S&P. Mark every gravestone doji you spot, regardless of context. Goal: pattern recognition speed.
Sessions 4–7: Add the location filter. Only mark gravestones that appear at swing highs or against known resistance. Take simulated short positions only when the confirmation rule fires.
Sessions 8–10: Layer in volume confirmation. Compare your win rate on volume-confirmed setups vs. low-volume ones. The data will speak for itself.
Session 11+: Run the same drill on micro futures (MES, MNQ) on the futures simulator before risking live margin.
FAQ
Is the gravestone doji bullish or bearish?
The gravestone doji is a bearish reversal pattern. It signals that buyers tried to push price higher during the bar but failed, and sellers regained control by the close. The pattern is most reliable when it appears at the top of an uptrend or against established resistance.
What confirms a gravestone doji signal?
The strongest confirmation is a bearish close on the next bar — specifically, a candle that closes below the gravestone doji's low. Volume on the gravestone bar adds conviction; an above-average-volume gravestone tells you institutions defended the level.
Where do I place the stop on a gravestone doji short?
Place the stop above the high of the gravestone doji bar, with an ATR-based buffer of roughly 0.5× ATR(14). If the candle is unusually tall, your stop will also be tall — reduce position size accordingly to keep risk per trade constant.
Can a gravestone doji be bullish?
Rarely. A gravestone-shaped candle at the bottom of a strong downtrend can occasionally mark exhaustion, but the win rate is materially lower than the bullish equivalent (the inverted hammer or hammer). Treat the gravestone doji as bearish-only by default.
What time frame is best for the gravestone doji?
Daily and 4-hour charts produce the highest-conviction signals because more participants and clearer institutional behavior are reflected in each bar. 5-minute charts work for intraday traders on liquid futures and high-volume stocks. Avoid 1-minute charts — the noise overwhelms the signal.
Alton Hill is the Co-Founder of TradingSim with over 18 years of trading experience. He completed the Design Thinking Bootcamp at Stanford’s D.School and brings expertise in Product Development to create the best trading simulation experience. His strategy focuses on trend-following systems, targeting high-volatility stocks with strong primary trends using the 15-minute chart.
Doji: Bullish or Bearish? + Spinning Top, & Harami Indecision Candles [Updated May 2026]
Ever wonder, "What is a doji candlestick pattern?" Is a doji candle bullish or bearish? How about a spinning top? Our goal in this tutorial is to uncover the fundamentals of indecision candlestick...
Stars, Dojis, and Abandoned Babies — Powerful Reversal Strategies [Updated April 2026]
Candlestick patterns can have some crazy names sometimes. Stars, dojis, and abandoned babies? The Japanese were fond of naming candlestick patterns after real-life visual representations. Shooting...
Day Trading Setup – Three Bar Reversal and Go This article is going to discuss a very simple, yet powerful day trading strategy that is used to capitalize off the greed and fear from novice traders....


 Candlesticks


