✓ Reviewed by Kunal Vakil, Co-Founder of TradingSim · Updated May 23, 2026
[Updated May 2026 — refreshed for current market context and SEO best practices.]
We have discussed a number of candlestick patterns on the Tradingsim blog. If you haven’t checked out our other resources be sure to do so, you’ll find a really nice candlestick pattern cheat sheet to help with your training. But for today, we’ll focus on the long and short side of the Abandoned Baby candlestick pattern.
In this post, you will learn how to spot both bearish and bullish abandoned baby patterns, how to trade them, and some caveats to watch out for.
If you would like to watch a video tutorial on how to trade candlestick patterns, subscribe to our Youtube channel. Our trading expert Aiman Almansoori has put together a great webinar on the topic.
Abandoned Baby Definition
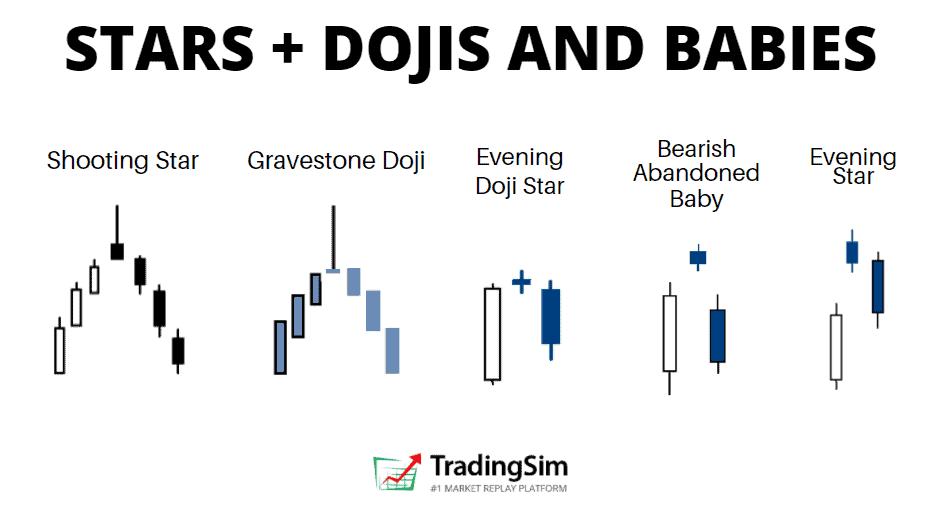
The abandoned baby candlestick pattern is a three bar reversal pattern. It is similar to the morning and evening star formations and is a very reliable reversal signal when it occurs after a sharp rise or drop.
While it is very similar to the morning star and evening star, it has one key difference. The real bodies and shadows cannot overlap from bar 1 to 2 and 2 to 3. This makes this pattern very unique, rare, and reliable at the same time.
Structure
The first candlestick is in the direction of the primary trend
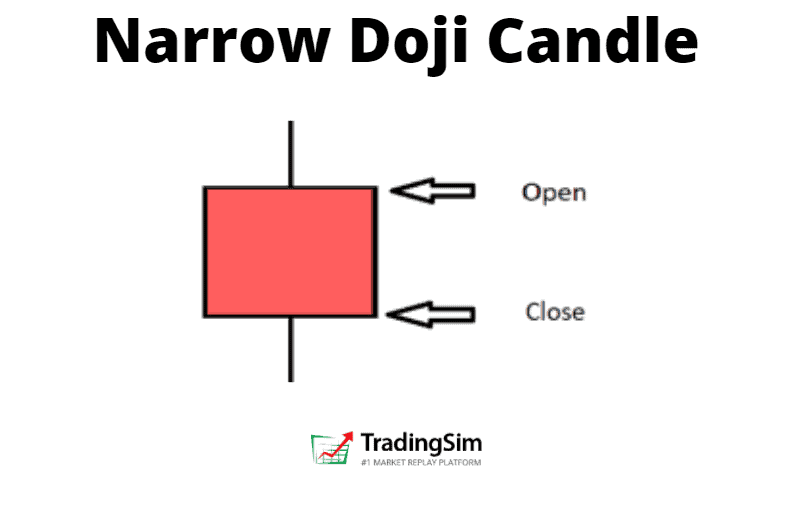
The second candle is a doji which gaps in the direction of the primary trend, exhibiting no overlap with the real body or shadow of the previous candle
The third candle is in the opposite direction of the first day and gaps in the opposite direction of the doji.
When you think of the psychology of a candlestick pattern, it is best to think about the “story” between the bulls and bears. This can really help your confidence in knowing when to take the trade and understanding the context behind the pattern.
For example, during rallies off the bottom of an extended downtrend, an abandoned baby bottom can be very rapid as short sellers will be forced to cover fast.
Conversely, during declines after extended uptrends, the abandoned baby top can be just as fast as many longs sell their positions, aiming to keep most of their profits.
To that point, the abandoned baby represents a crossroads, or “indecision” at the top or bottom of a trend reversal. Within the candle is usually a lot of activity between retail buyers and institutional sellers, or vice versa. The result is typically a large amount of volume.
That volume tells us that a lot of effort went into the candle, but with little result, signaling the reversal.
Chart Example
Abandoned Baby
In the above candlestick charting example, notice how the abandoned baby top comes in after a strong uptrend. This leaves the bulls trapped at the top of the formation with very little time to exit their winning positions, especially if they were buying at the top.
To the right of this formation is the abandoned baby bottom. This is the exact opposite of the abandoned baby top and is often the sight of a sharp short squeeze.
Congratulations! You are now familiar with the structure and characteristics of the abandoned baby candlestick pattern. Now it is time to apply trading techniques to the strategy with real market examples.
Trading the Abandoned Baby Candlestick Pattern
Bullish Example #1
We will now review a couple of chart examples, which show the price behavior after an abandoned baby candlestick pattern.
Bullish Abandoned Baby – Trend Increase
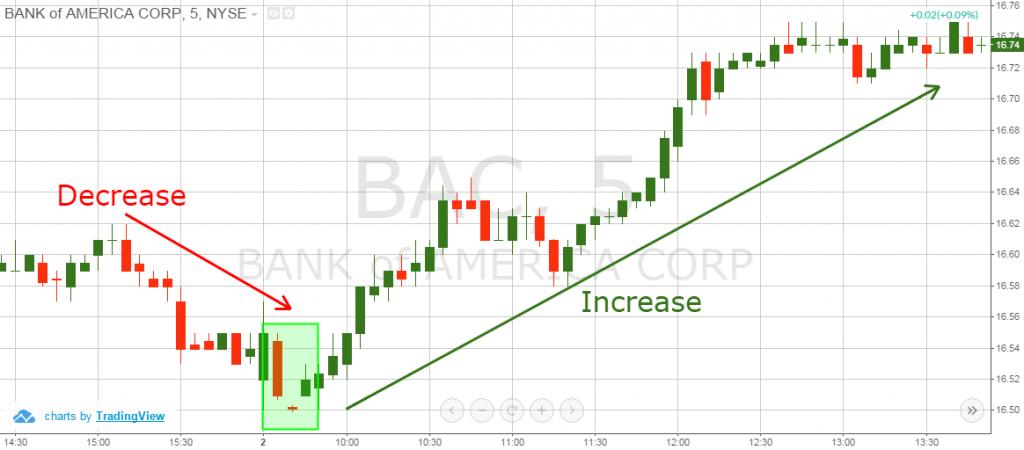
This is the 5-minute chart of Bank of America from June 2, 2015.
There is a clear downtrend, followed by an abandoned baby candlestick pattern, which is shown in the green rectangle.
After we identified the pattern, a strong uptrend emerges and BAC’s stock price increases a total of $0.25 per share. This may not sound like much of an increase, but Bank of America is a Titanic of a stock.
With larger-cap stocks, what you are giving up in profits you don’t have to worry about in terms of risk.
Bullish Example #2
Let’s now review another example of this unique candlestick pattern.
Abandoned Baby – Trend Decline
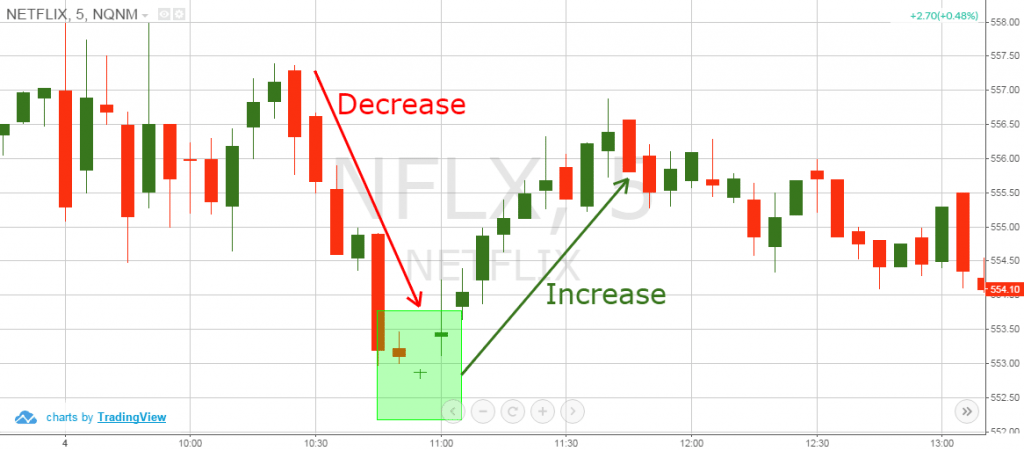
This is the 5-minute chart of Netflix from May 5, 2015.
In the chart above, we see a bearish trend followed by an abandoned baby reversal candle pattern. You can see the formation in the green rectangle.
This time, the abandoned baby is a doji candle, which gives additional reliability to the pattern. The next candle opens with a gap from the abandoned baby, which confirms the pattern.
The followed bullish move is so strong, that even the next candle after the confirmed pattern opens with a bullish gap.
This trend reversal leads to a $3.42 price increase in Netflix.
Bearish Abandoned Baby Example
The lesson wouldn’t be complete without seeing this pattern play out bearishly.
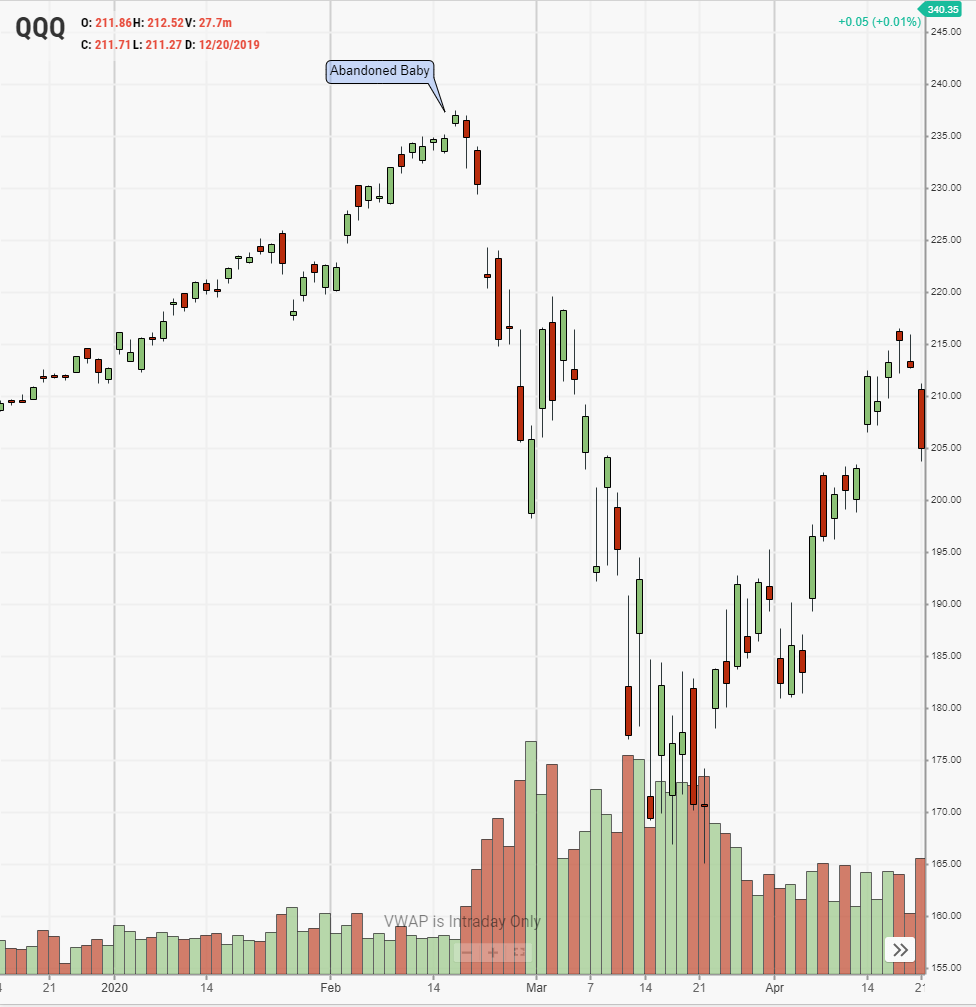
Before the Covid Crash of 2020, the QQQ etf produced a beautiful climactic abandoned baby pattern before crashing for the next 4 weeks.
QQQ bearish abandoned baby chart
As you can see, this topping pattern occurred at the very top of an extended bull run, signaling the reversal. Perhaps the astute trader could have foreseen the crash if he’d known about this pattern?
Trading the Abandoned Baby
The good thing about the abandoned baby candlestick pattern is that if you spot it on the chart, you can trade it right away!
It is not necessary to use additional trading indicators to confirm the signal, because the pattern is pretty reliable.
This doesn’t mean that the pattern will work 100% of the time, so don’t go overboard!
Stop-Loss Orders
When you trade the pattern you should always protect your trade with a stop-loss order. The proper location of your stop should be or below the middle candle of the formation, depending on the direction of your trade.
Also, feel free to put the stop as tight as possible.
Profit Targets
You can always use a moving average or an oscillator to exit a trade. The other option is to rely on basic price action rules to close your profitable position.
In order to understand how this works, we’ll show you how to implement a few techniques when trading the pattern:
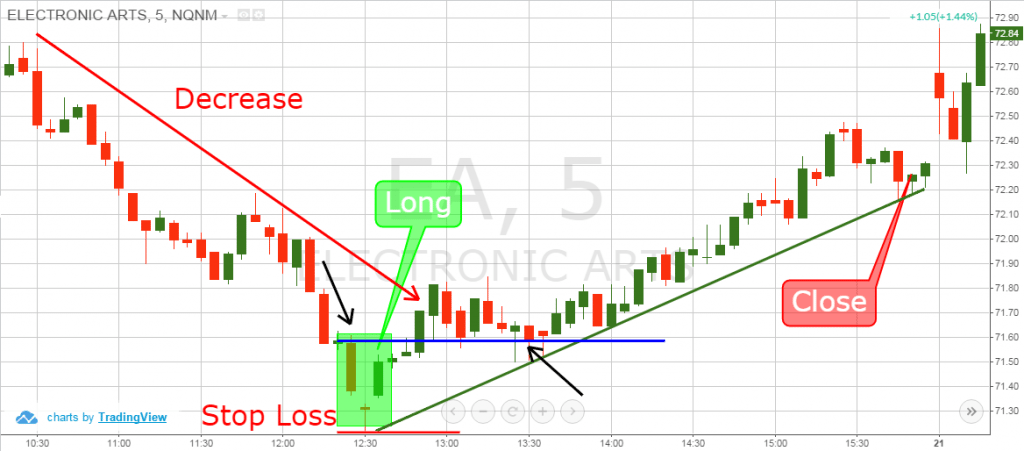
Above is the 5-minute chart of Electronic Arts from Oct 20, 2015.
After a strong price decrease, we see a candle which gaps down from the bearish trend (green rectangle). The next candle gaps up and we confirm a bullish abandoned baby.
We go long when the last candle of the pattern closes the period. Lastly, we put a stop loss order right below the lower wick of the abandoned candle as shown on the image.
EA’s stock price begins an impulse move higher and we start following the price action. Notice that the first candle from the pattern and the previous candle form a resistance area (blue horizontal line).
On its way up, EA breaks this resistance level. The price starts consolidating and the previous resistance begins acting as support (See the black arrows on the chart for reference).
The price starts increasing afterwards and breaks the high of this congestion area.
Notice that the two low wicks during the price hesitation help us build a bullish trend line – starting from the abandoned candle. The EA price tests the trend a couple more times without breaking it.
For this reason, we stay with our long position until the market closes.
In this trade, we generated a profit of $0.74 (74 cents).
Money Management when trading the Abandoned Baby Pattern
The abandoned baby candlestick pattern is one of the most reliable patterns.
As shown above, you can place tight stop loss orders when trading abandoned babies. This is because even a small contrary move will indicate that the pattern is false.
In the trade above, our stop loss was 0.42% from our entry price. Therefore, if you were to invest $40,000 of your buying power, a false pattern will lead to a maximum loss of $168.
However, the trade was successful and lead to a profit of 1.1% which translates to $440.
Managing with Moving Averages
Let’s now review another abandoned baby trade. This time though, we will rely on an exponential moving average to exit our trade.
Abandoned Baby – Profit Targets
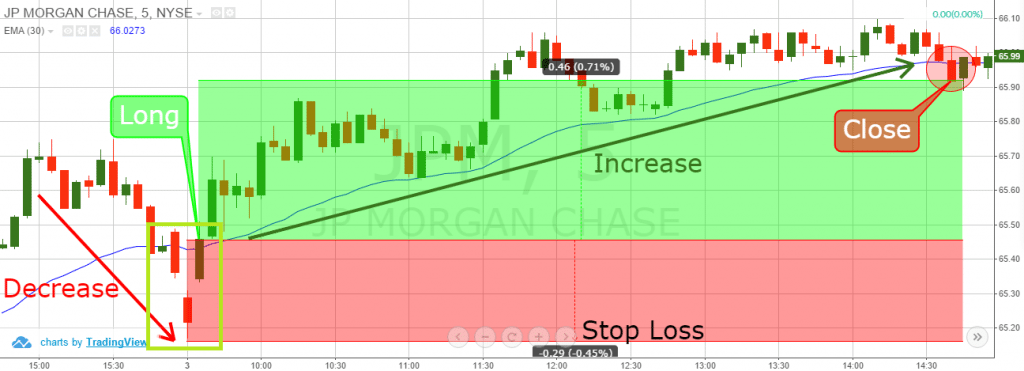
Above you see the 5-minute chart of JP Morgan Chase & Co. from Nov 3, 2015. I have placed a 30-period exponential moving average on the chart, which is the blue curved line.
The chart begins with a price decrease, marked with the red arrow. At the end of the price decrease, we see a candle gapping down. This should be a signal for us that a potential abandoned baby candlestick pattern might occur on the chart.
Entry
The next candle gaps up and we confirm the pattern with its closing – we go long!
Let’s say we have a bankroll of $25,000. Since we have a day trading account we have a maximum buying power of $100,000.
Since the bullish and the bearish abandoned baby candlestick patterns are considered very reliable, we will invest 20% of our buying power. So, we invest $20,000 in a long trade based on an abandoned baby signal.
Stop Loss
Our stop loss is set below the lower candle wick of the abandoned candle. This is shown on the image above. In this trade, the stop is -0.45% from the entry price. This way, if our trade is unsuccessful, we will lose $90 (20,000 x 0.0045).
Abandoned Baby – Profit Targets
After the confirmation of the pattern, JPM stock begins increasing. JPM reaches $65.86 and starts a corrective move. Notice that the price decreases, but it finds support at our 30-period EMA.
JPM price expands and breaks the $65.86 top and shoots to $66.06. Then we see a new decrease to the 30-period EMA. The price starts crawling on the exponential moving average afterwards; however, the level sustains the pressure of the price and we notice a new bounce from the 30-period EMA.
Exit
Although the price makes more of a sideways move rather than an increase, we see a new top at $66.10. The followed price action is in a bearish direction. The JPM stock price breaks the 30-period EMA, which is our signal to exit the trade.
In this trade, we managed to catch a .71% increase in JPM. This breaks down to a profit of $142 while risking $90. This gives us a 1: 1.58 risk-to-return ratio. Although this doesn’t look very impressive, $142 dollars here or there can add up to a mortgage payment at the end of the month.
Although the example above only uses 20% of your buying power, you can always invest more if you have really tight stops.
In comparison to other patterns, where you sometimes risk 2%, the abandoned baby candlestick pattern does not require you to have wide stops.
Just remember: you must use a stop loss order when trading abandoned babies. If you don’t place a stop, an unlucky trade might lead to tremendous losses, since you are leveraging your capital.
Recap
The abandoned baby is a three candle formation.
It resembles the evening and the morning star.
The doji candle needs to gap from the two candles which sandwich the pattern.
There should be no overlaps between the middle candle and the two candles surrounding it.
The abandoned baby is one of the rarest candle patterns.
A stop loss order should always be used when trading the abandoned baby candlestick pattern.
Stop loss proper location is at the end of the lower candlewick of the abandoned candle.
You can invest more than you usually invest in your deals when trading abandoned baby candle figures. There are two basic reasons for this:
The abandoned baby is a pattern with a very high success rate.
The stop loss when trading abandoned baby figures is usually placed very tightly. In some cases, you will risk less than 0.5% of your investment.
Alton Hill is the Co-Founder of TradingSim with over 18 years of trading experience. He completed the Design Thinking Bootcamp at Stanford’s D.School and brings expertise in Product Development to create the best trading simulation experience. His strategy focuses on trend-following systems, targeting high-volatility stocks with strong primary trends using the 15-minute chart.
Penny Stock Chart Patterns – 2 Setups That Repeat Daily
Trading penny stocks is not for the faint of heart. You have to truly be a master of day trading. The reason is the risks are great and there is little room for error because the action moves so...
Step-by-Step Guide to Trade the Rounding Bottom Pattern
The rounding bottom pattern is a technical setup for the patient trader. This is because the pattern can take quite a bit of time to develop before any significant price moves begin. In this article,...
How to Trade Diamond Chart Patterns – Winning Strategies
Diamond Chart Pattern Definition A diamond chart formation is a rare chart pattern that looks similar to a head and shoulders pattern with a V-shaped neckline. Diamond chart reversals rarely happen...


 Day Trading Penny Stocks


