To practice the island reversal examples detailed in this article visit https://tradingsim.com.
An island reversal is a chart formation where there is a gap on both sides of the candle. Island reversals frequently show up after a trending move is in its final stages. An island reversal gets it name from the fact that the candlestick appears to be all alone, as if on an island. A key sign of a valid island reversal is an increase on volume on both the first gap, and then the subsequent gap in the opposite direction. An island reversal formation is often attributed to news driven events that occur in the pre-market or after-hours trading.
Island Top
Island Bottom
As you can see a bearish signal is the island top. All of the buyers are left hanging with zero time to react to the selloff.
Conversely, an island bottom can create the squeeze required to start a new uptrend.
Trading the Island Reversal Stock Pattern
Now that you are familiar with the two Island reversal chart patterns, let’s walk through how to trade the setup.
#1 – Entering an Island Reversal Trade
In order to confirm the Island candle pattern, you should discover three symptoms on the chart:
- The stock gaps in a bearish or bullish direction.
- After at least the close of one candle, the stock gaps back in the opposite direction.
- None of the candles from the island overlaps with the candles from the general price action, including the body or the candle wick.
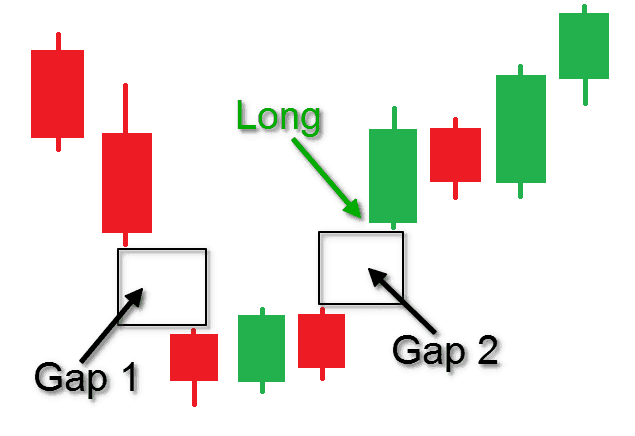
Island Bottom Chart Example
See that the price action above starts with a bearish move. Suddenly, a bearish gap appears on the chart separating the price action. Three candles later we see an opposite bullish gap. None of the candles from the formed Island overlaps with the price action.
This way we confirm the authenticity of the candle pattern. You can go long with the opening of the first candle after the second gap as shown on the image.
When you find these three signs on the chart, you have confirmed the pattern.
#2 – Island Reversal Pattern Target
In order to find the size of the pattern you need to measure the distance between the lowest candle of the general price action and the lowest candle of the Island pattern.
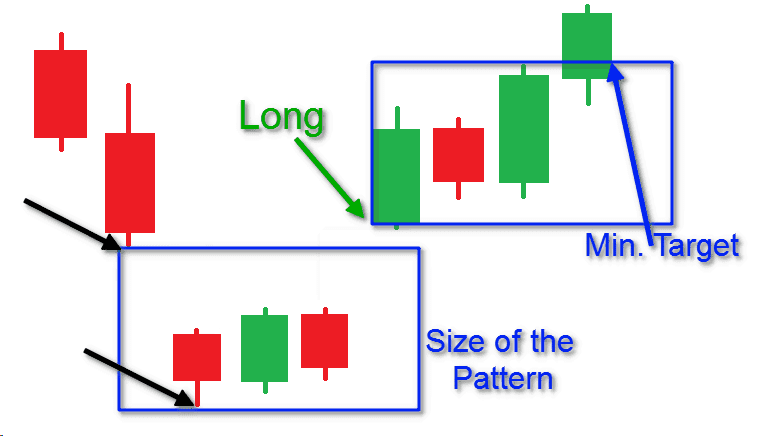
Island Reversal – Minimum Target
The first rectangle above illustrates the size of the pattern. The two black arrows show the lowest point of the general price action and the lowest point of the Island pattern. We have built the rectangle based on these two points.
After we create the rectangle, we apply the height to the beginning of the candle after the second gap. This way the top of the rectangle provides the minimum target for the island pattern.
After reaching the minimum target, you can always extend your target based on the price action. You can find a support level and place your stop beneath this level.
You can then stay in the trade until you see three candles go against you or the support area is broken.
If the stock keeps trending in your favor, you should keep adjusting the stop upwards.
#3 – Stop Loss with the Island Reversal
When you spot the pattern and you open a trade, you need to immediately place a stop loss. The proper location of the stop is below the lowest point of the pattern (island bottom). This way you will be protected in case the price goes contrary to your trade and overlaps with the pattern.
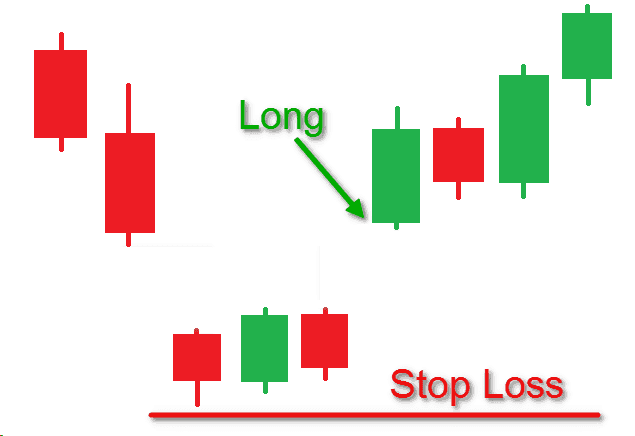
Island Reversal – Stop Loss
Since the stop is below the pattern and you trade the size of the pattern, the win-loss ratio is based on the minimum target (0.9 : 1).
This is absolutely acceptable since the pattern has a high success rate.
We should discuss one more case here. If you decide to extend the target of your trade, you should apply additional stop loss management rules. In case the price keeps increasing, you should constantly adjust your stop loss in the direction of the price increase.
Full Island Candlestick Pattern Strategy
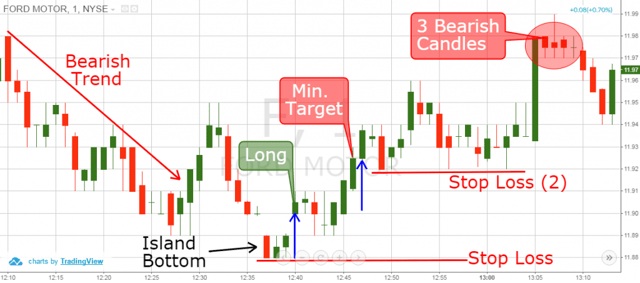
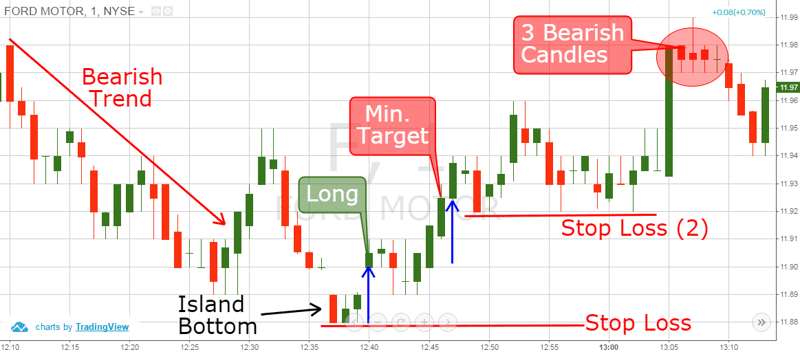
Island Reversal – Trading Strategy
Above you see the 1-minute chart of Ford from February 24, 2016.
The image above starts with a bearish decline.
After the bearish gap, we see that the price action completes three candles separately. When the three candles are completed, the price action creates a bullish gap, which is opposite to the bearish pattern.
At the same time, there are no overlapping elements between the price action. Therefore, we confirm the presence of an authentic island bottom candlestick pattern on the chart (black arrow).
We buy Ford based on the island bottom formation and place a stop loss right below the low of the formation.
The next step we take is to measure the size of the formation. The first blue arrow on the chart takes the lowest point of the island pattern and the lowest point of the price action around the pattern. Now we have the size of the Island figure. We apply this size starting from the moment of confirmation and our respective entry point. The blue arrow illustrates the minimum target for the setup.
7 minutes after we go long with Ford, the price completes the minimum target on the pattern. See that there is a correction of the bullish move before the target was completed. However, the contrary move doesn’t reach our stop loss order and we stay in the trade.
When the target is reached, we can close our trade. However, we also have the option to stay in the trade and extend our target. In case you decide to do this you would need to adjust your stop loss. See the bottom that comes right after the target was completed. This looks like a proper location for our adjusted stop loss order (Stop Loss 2).
A new price boost comes afterwards and our gains are extended nearly twice. However, a big correction brings the price in the area of our adjusted stop loss order. See that the price makes three attempts to break the bottom; however, our stop loss order is properly placed and contains the price action.
After the three tests at $11.92, the price has a strong rally, which nearly triples the gains from the minimum target.
Right after the bullish candle, the price action closes three bearish candles in a row. This gives us an exit signal from our trade and we close our Ford trade.
Conclusion
- The Island candle pattern consists of one or few candles, surrounded by gaps from both sides.
- The gaps need to be opposite to each other so the candles will look like a separate island above or below the price action.
- There are two types of Island candle patterns:
- Island Top – when the pattern is above the price action
- Island Bottom – when the pattern is below the price action
- In order to confirm an Island pattern and to enter a trade you need to find three symptoms on the chart:
- The stock creates a gap.
- Few candles later the stock gaps in the opposite direction.
- The separated candles do not overlap with the price action.
- The minimum target of the pattern equals its size.
- A stop loss should be settled below the island pattern when entering a trade.
- The target could be extended to a situation where you find three opposite candles. In this case you should always adjust your stop loss based on simple price action rules.
Trading Island Reversals in Today's Markets [2026 Update]
The mechanics of the island reversal have not changed since this article was written, but the gap landscape has. A few practical notes for trading the pattern in 2026:
Earnings and news gaps are bigger. With more volume concentrated in the opening auction and options-driven positioning, post-earnings gaps frequently exceed several percent on large caps. That produces more candidate islands — but also more gaps that fill within a session or two. Wait for the second gap to hold through at least one full session before treating the island as confirmed.
Extended-hours trading blurs some gaps. A stock that trades heavily in the pre-market can 'walk' to its new price rather than gap cleanly, which weakens the island structure. The cleanest islands still come from genuine overnight repricings — earnings, guidance changes, FDA decisions, or macro shocks.
Volume confirms the trap. The power of the island comes from trapped traders: buyers stranded above an island top, shorts stranded below an island bottom. High volume inside the island and on the second gap means more trapped participants and typically a stronger follow-through move.
Practice before you commit. Because islands are rare, most traders have little live experience with them. Replaying historical gap events in a simulator lets you rehearse the entry, target, and stop rules covered above without waiting months for the next clean setup.
Related Reading
Continue building your knowledge with these TradingSim guides:
Frequently Asked Questions
What is an island reversal pattern?
An island reversal is a chart pattern where price gaps in one direction, trades for one or more sessions in a cluster isolated by the gap, then gaps back in the opposite direction. The isolated candles form an 'island' separated from the prior trend by two gaps, signaling a potential trend change.
Is an island reversal bullish or bearish?
It can be either. An island bottom forms after a downtrend with a gap down, consolidation, then a gap up, and is bullish. An island top forms after an uptrend with a gap up, then a gap down, and is bearish. The direction of the second gap defines the signal.
How reliable is the island reversal pattern?
Island reversals are relatively rare but tend to be meaningful when they appear on higher volume, because the two gaps trap traders on the wrong side. Reliability improves when the pattern forms at a clear support or resistance level and when the second gap holds without being filled quickly.
What is the difference between an island reversal and an abandoned baby?
The abandoned baby is a strict three-candle candlestick pattern whose middle candle is a doji isolated by gaps on both sides. An island reversal is a broader chart pattern: the island can contain several candles of any type and can span days or weeks.
What timeframe works best for trading island reversals?
Daily charts are the classic timeframe because true overnight gaps are required to form the island. Intraday charts rarely show clean islands since gaps mostly occur between sessions, though 24-hour futures markets can print them around major news.








 Trading Discipline