The 1-3pm Bloodbath: A Killer Late-Day Shorting Strategy
Jul 27, 2021
Written by: John McDowell
✓ Reviewed by Al Hill, Co-Founder of TradingSim · Updated Mar 31, 2026
Breakouts are perhaps the most recognizable trading pattern in the market. Everyone sees them. Nonetheless, not all breakouts work. That is a fact of trading. And in the world of low-float, highly volatile stocks, certain criteria can lead to severe destruction when chasing breakouts at a certain time of day. It can be so destructive that FinTwit sensation @team3dstocks of #vwapboulevard fame calls this short setup the “1-3pm Bloodbath.”
We’ve already written the Ultimate Guide to VWAP Boulevard, and another post explaining the dangers of Kill Candles. However, the trilogy wouldn’t be complete without a thorough examination of the 1-3 pm Bloodbath. All three are contextually related in varying degrees to the world of momentum day trading. And for that reason, you should understand each one.
To that end, in this post we’ll do a deep dive into the strategy, offering some real-life examples that reveal what to look for, and some red flags in the setup. Before jumping in, check out this quick tutorial on how to find these setups inside TradingSim:
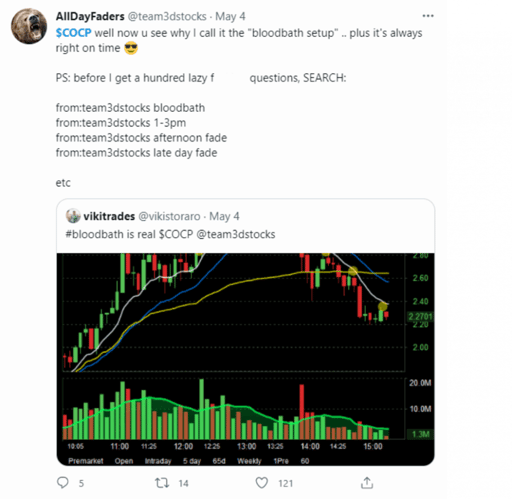
While the 1-3 pm Bloodbath is perhaps a bit more noticeable to the naked eye without tons of back-testing data, we still want to give credit to the man who put a name to the pattern. AllDayFaders (ADF), as he is known on Twitter, coined the term years ago.
ADF is very good about tagging his posts for those of us wanting to learn from his market wisdom. And a quick search on Twitter for “bloodbath @team3dstocks” will turn up a wealth of information on the subject.
To that end, here are the main criteria that ADF recommends for spotting the setup:
This all seems simple, right? And with a trained eye, it certainly becomes easier to spot these criteria. However, there are likely a few readers wondering what “low float trash” looks like?
In other words, how do we know what’s capable of running, versus what’s likely to fail? Let’s have a look at that.
What Is Low Float Trash?
When ADF makes reference to “low float trash,” he’s simply calling out the typical practices of unprofitable companies. These “companies” must employ dodgy market manipulation in order to raise cash to continue operating.
To understand this a bit better, you need to understand the concept of dilution. The folks over at DilutionTracker.com do a great job of explaining this. Here’s a good definition and example:
— Dilution Tracker (@DilutionTracker) May 26, 2021
So let’s put some of this into layman’s terms.
Small-float company XYZ needs to raise cash. They aren’t profitable, and they have a history of “promoting” the stock through PR releases and such. They might even do a reverse stock split in order to reduce the size of the float before the PR is released. This gives them the ability to manipulate the float easier.
Offerings
XYX has previously filed for a shelf offering with the SEC prior to the PR release and has a history of raising cash into price spikes.
Once XYZ releases some “positive” news, the stock gains momentum that day. Perhaps it runs 50% or more in the premarket, 100% in the regular session on millions of shares. But lurking behind the scenes is this potential offering of shares they have registered to dump into the market.
With that in mind, ask yourself a question. If you were company XYZ, wouldn’t you want the biggest bang for the buck? Of course, you would, so you drum up demand and then dump millions into the market as the demand is hot.
The result? Dilution. And, consequently, the context for why these big runners usually won’t sustain their upward momentum.
Repeat Offenders
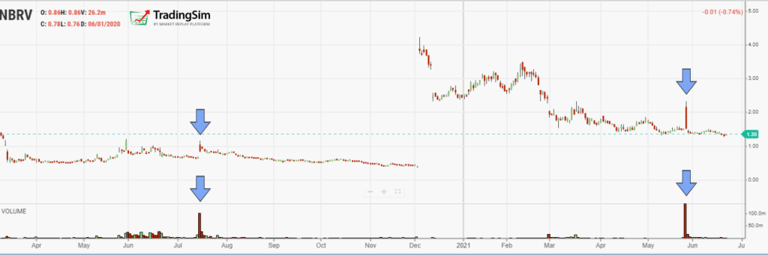
Using DilutionTracker’s example of NBRV, we notice on the chart as well that prior price spikes have resulted similarly. Not only that, but the company has recently completed a reverse split in December of 2020 just to stay listed.
The second set of arrows represents the day mentioned in the tweet above, May 26th. Notice that NBRV gapped in the premarket almost 100%, then proceeded to fade the rest of the day and close red. It has never had any trajectory but downward.
NBRV dilution example
And this is just one example of the effects of dilution. There are literally hundreds, if not thousands of companies like this one employing the same tactics to stay afloat.
To that point, if you’re going to play these tickers, it would benefit you to look left on a daily chart and see the typical results. Not to mention, having a grasp of how to understand filings with EDGAR, or by subscribing to a service like DilutionTracker, or BamSEC.
Avoiding Filings
One other thing worth considering is that institutions may not want to carry their positions over and register new “holdings” with the SEC if they are making a play on these tickers. AllDayFaders mentions this in one of his tweets, and it could very well be another point of consideration for why these stocks sell off dramatically near the close of the day.
1-3pm Bloodbath Criteria
The criteria are pretty straightforward for the 1-3pm Bloodbath setup. However, there are some caveats to watch out for, which we’ll cover in some of the examples later. And, ultimately, it takes practice, practice, practice to spot these in real-time.
Let’s recap the basics from AllDayFaders:
You could probably add to this criteria an open shelf offering, or lack of real news, etc., to really spice up the probabilities. Anything to portend the coming demise of whatever manufactured momentum is present.
Typically the prettiest patterns play out after #vwapboulevard or some overhead resistance has been reached or breached. If this area of long term resistance doesn’t provide the failed follow through in the morning, then ADF says to wait for the retest and fail in the afternoon.
Read my rules on lowfloats. $XBIO didnt gapup big enough so u shouldnt have been short at the open anyway. 2nd, volume forecast warned before the squeeze (as usual), so what do my rules state? wait for shorts to get squeezed & comeback for #vwapBoulevard or 1-3pm #bloodbath setup https://t.co/atwBxyGfUi
On that token, ADF does warn to “AVOID stocks that run intraday without gapping big. Those tend to be headaches. Wait for the 1-3pm bloodbath setup on those.”1
And with that in mind, let’s look at some examples.
1-3pm Bloodbath Example #1: COCP
COCP is a great place to start because it was such a violent move at the end of the day. But let’s look first at the criteria it met.
According to Finviz.com, the float was 66 million. Check. It had also run 93% in the premarket after announcing Coronavirus drug “progress” the day before. Check.
Here was the headline reference on MarketWatch:
COCP PR on May 3, 2021
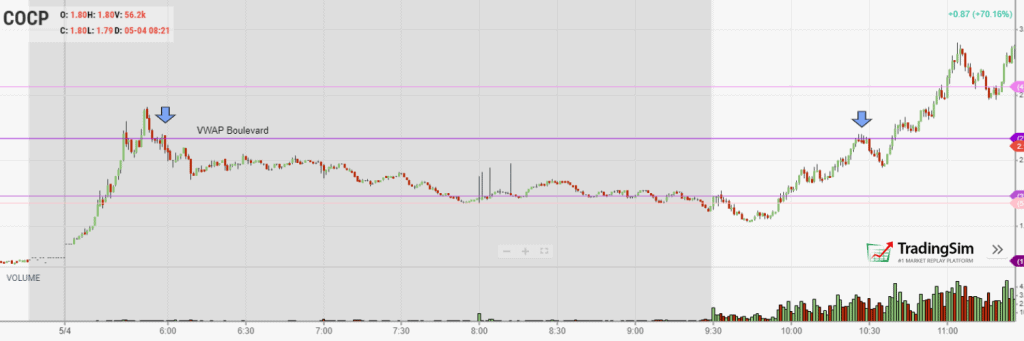
So, we had a catalyst. And COCP ran straight into a #vwapboulevard area just above $2.17 before 6 am, as can be seen on the chart below:
COCP premarket levels
While #vwapboulevard provided a great shorting opportunity in the premarket, it retested this area shortly after the open. The result was not as favorable for shorts this go-around. ADF often warns that if #vwapboulevard doesn’t break down soon after 10 am, wait for the 1-3 pm Bloodbath.
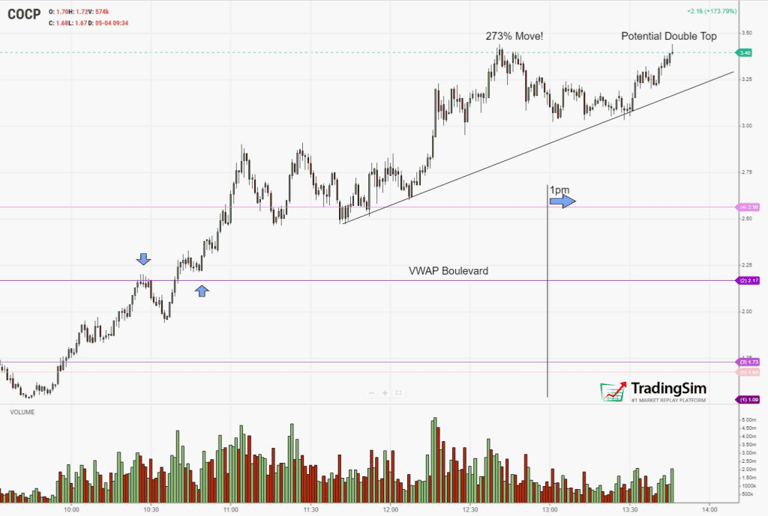
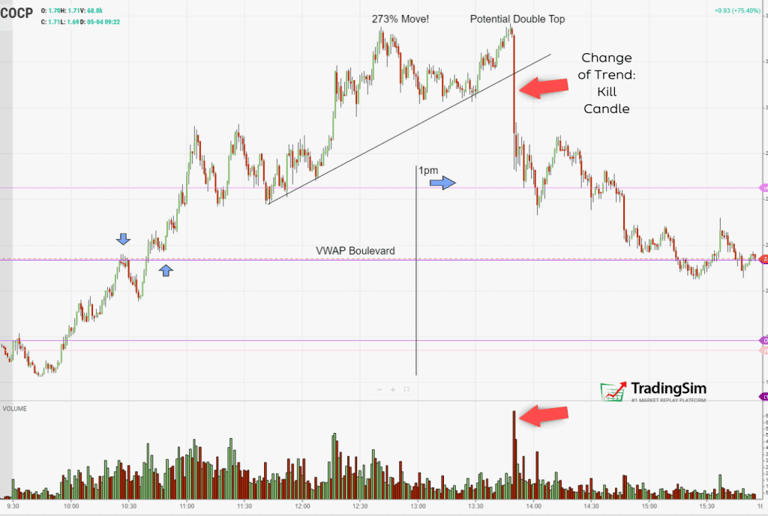
In fact, that area became support for a big push all the way to a 273% gain by midday. At this level, volume was weak on a second push for new highs at $3.40. We were also beyond 1 pm.
COCP double top at 273%
What happens next should give caution to any breakout trader when a stock is this extended late in the day.
Trend Change with Kill Candle
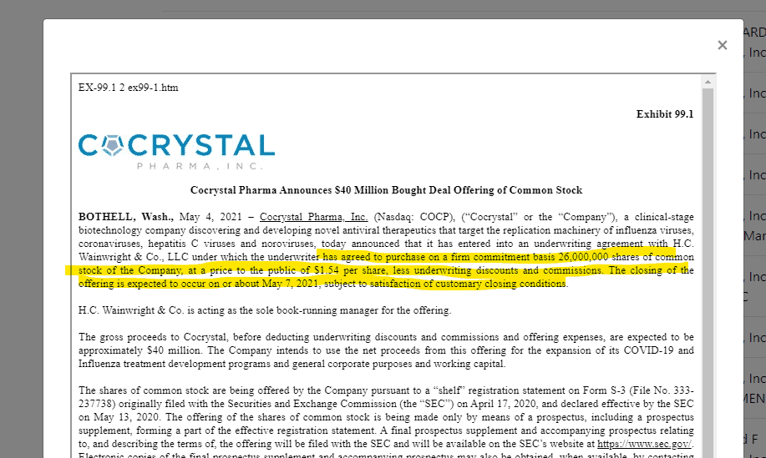
At this point, we are looking for a change of trend, perhaps a change of character in the stock as well. This is provided by a surprise news release that COCP is announcing an offering at a much lower price of $1.54. You can read the fine print for yourself:
The shelf offering dated back to April of 2020 and would be executed 3 days later according to this announcement. Clearly, $1.54/per share is much lower than the current trading price of $3.40. More than 50%. Yikes!
You can only imagine what happens next:
COCP 1-3pm bloodbath
As soon as the news is announced, like an estocada to the heart of the bulls after being teased all day, the blood runs swiftly. Destruction. Devastation. Violence, as AllDayFaders says.
You may be asking, “how can I anticipate something like this?” The answer is simple if you are a bull. In the wise words of professional trader, Nate Michaud:
“Know what you own.”
If you’re going to day trade the world of low float stocks, you need to be aware of the type of company you’re buying or selling. What offerings do they have open? What is the past history of their big runs? Hence the name, “low float trash.”
The rest boils down to pattern recognition. Once you’ve seen enough 1-3 pm Bloodbaths, you’ll figure it out.
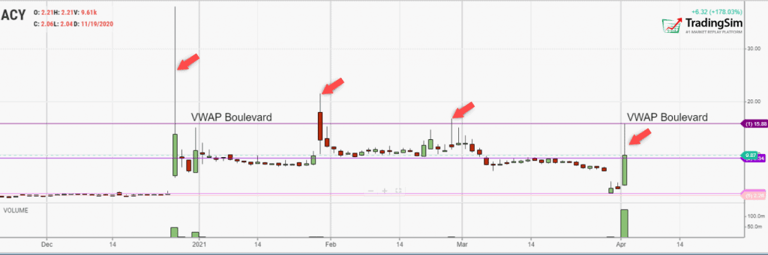
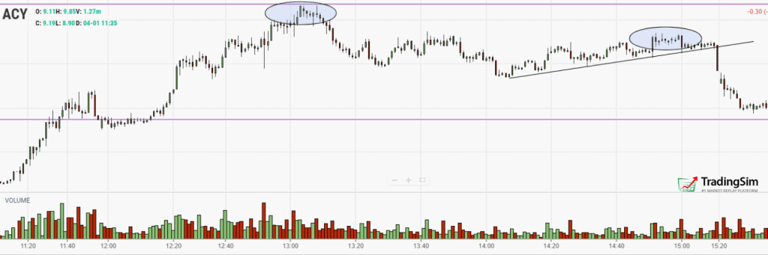
1-3pm Bloodbath Example #2: ACY
For this example, let’s start by having a look at the daily chart to see what happens to ACY when it has these big runs. Notice that for each time it has a big lift in price, it typically retreats.
ACY daily chart
This is less surprising after doing a little homework to discover that ACY is bankrupt, literally. The news was released just before April 1, 2021. Evidently, someone felt this was bullish enough to have a run on bears on the morning of April 1.
To that end, the premarket gapped wildly, retreated, then squeezed for the better part of the day until it ran into #vwapboulevard at around, you guessed it, 1pm.
It then put in a mediocre rally and finally gave up the ghost around 3 pm, denoted by the second circle in the image below.
ACY Intraday 1-3pm Bloodbath
All the boxes were checked for this ticker. The float is 1.20m. It was running more than 200% on the day. And, to top it all off, it ran into perfect resistance at VWAP Boulevard from the daily chart. Not only that, but the timing was perfect.
A little bear flag at the end of the day to trap bulls, and it turns into nothing more than a plank walk. Bulls go head-long overboard.
ACY lost nearly 50% of its value from the highs in a matter of a few hours.
Red Flags to Watch Out For
As with any setup, you want to wait for confirmation as much as possible. There is no such thing as a 100% effective strategy. Outliers, traps, and misreads will occur from time to time.
On that token, there are a few scenarios to watch out for when playing the 1-3pm bloodbath short.
Beware of any “saves” in the price action
Don’t fight a continuing uptrend
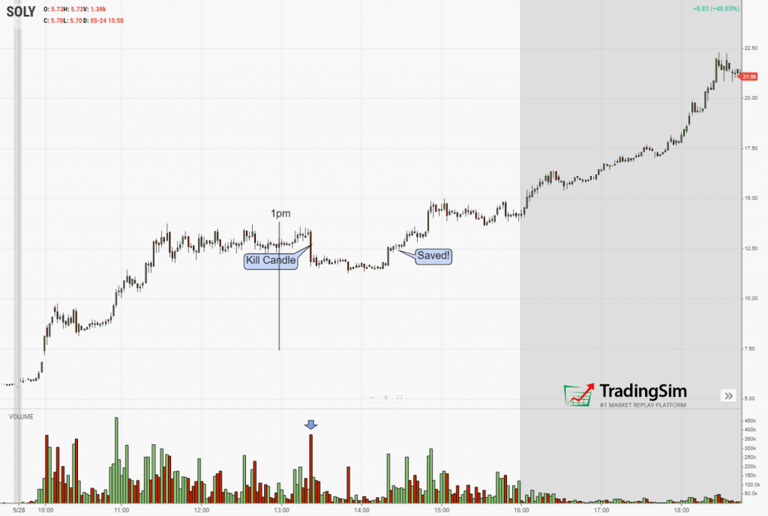
1-3pm Bloodbath Failed Example: SOLY
Notice in this example you have a stock with a low float of 11m shares that had gained 145% by 12 pm. It sure fits the criteria for a possible late-day fail. It was even hitting resistance on the daily chart for this day.
Despite all of that, what we see below is that SOLY never materialized beyond its initial kill candle around 1:30 pm. The supply that entered the market wasn’t enough to overcome the underlying demand, and bulls were able to overcome the pressure and eventually squeeze the shorts well into the after-hours trading period.
SOLY Bear Trap
AllDayFaders calls this particular turn of events, the “you gon’ learn today” bear trap setup. In fact, when he sees this, it becomes a signal for him to flip his position long, likely because of the nature of the impending squeeze.
Here he is discussing this move on Twitter:
if u need a refresher on what the "you gon learn today" bear trap setup is… review this old tweet & SAVE the charts I listed.
Keep this in mind when trading the 1-3 pm Bloodbath, and be willing to be wrong and stop out at the very least.
Lastly, make sure all of your criteria are met. If a stock isn’t up significantly, ideally over 100%, it may not work. Likewise, if the float is too big, it will be harder to manipulate the price of the stock. Thus the bloodbath may never materialize.
How To Practice This Strategy
As with any strategy, it takes pattern recognition. And recognizing patterns means studying a lot of charts.
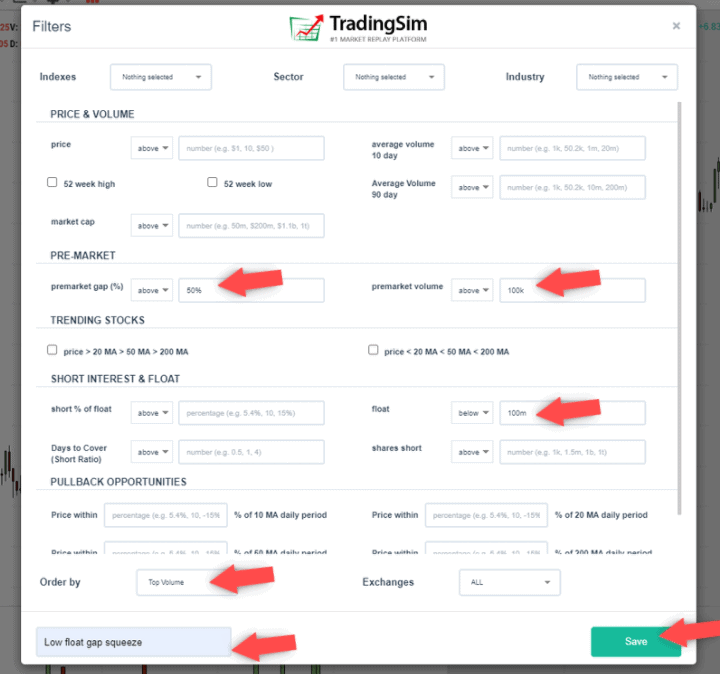
There are a handful of replay services available if you know of a specific ticker to look for. However, if you like to search for intraday stocks and filter your results according to price, float, gap%, or more, we recommend giving our new scanning tool a try.
Here is an example of a filter you might use to scan for intraday runners:
Notice the criteria set for low float stocks, premarket volume, gap%, etc. This should turn up a number of results for you to practice with. Also, as the day wears on in replay mode, you can fast forward to 1 pm and see what is hitting the live replay scanners.
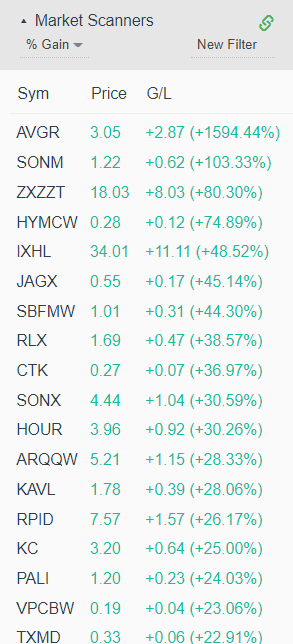
Here is an example of what the scanners would have been picking up while replaying SOLY short back on this day in May 2019:
With enough of these under your belt, our hope is that you can eventually put real money to work.
Conclusion
A big thank you to AllDayFaders and the many members of the FinTwit community who give their nuggets of wisdom out for free. We hope you find this tutorial helpful in your trading. Please feel free to reach out to us and provide feedback on how we can better serve you.
John McDowell is the Lead Content Strategist at TradingSim. His journey into day trading began in 2016 after conversations with a retired hedge fund manager. John is passionate about teaching and educating traders, curating content that helps others succeed in the stock market.
VWAP Boulevard: The Ultimate Day Trading Strategy for Low-Float Stocks [#vwapboulevard]
VWAP Boulevard has become one of the most popular day trading strategies in the finwit community lately. Discovered and popularized by Twitter phenom @team3dstocks, thousands of traders are now using...
The Kill Candle Shorting Strategy Explained [Updated May 2026]
The Kill Candle. It just sounds menacing, doesn’t it? And for good reason. If you’ve ever been caught in one on the long side, you understand the pain. What Is A Kill Candle? Day trading legend Bao...
Edge in Trading: How to Find One When You Don’t Know Where to Start
Finding consistency as a trader isn’t easy. Much less, knowing where to get started. You hear it said all the time, “if you want to find longevity as a trader, you must study.” But where do you...


 Day Trading Indicators


