20 Moving Average Pullback Strategy: Rules & Practice [Updated April 2026]
Apr 26, 2026
Written by: John McDowell
✓ Reviewed by Al Hill, Co-Founder of TradingSim · Updated Apr 26, 2026
The 20 moving average is an extremely popular indicator in the world of trading. It’s use is ubiquitous no matter the time frame or the type of stock, commodity, currency, or other issue being traded. Because of this popularity, many traders use it for special strategies in the market. One of those strategies is the 20 Moving Average Pullback.
For a quick overview of how to use moving averages, check out our post here.
Also, have a look at our brief video below explaining how to search for the 20 Moving Average Pullback in the TradingSim scanner:
20 Moving Average Pullback Overview
A rose by any other name smells as sweet. The 20 Moving Average Pullback is no different.
Popularized by great traders like Linda Raschke as the The Holy Grail, or similar to Jeff Cooper’s 50 moving average Expansion Pivots, pullback strategies are simply opportunities to jump on board as a stock pauses during an uptrend.
Cooper says it best as he describes it as “one of the toughest predicaments for traders.”1 That is, knowing how to enter a stock that has left the train station without you. This is where the moving averages come into play.
Intraday Examples
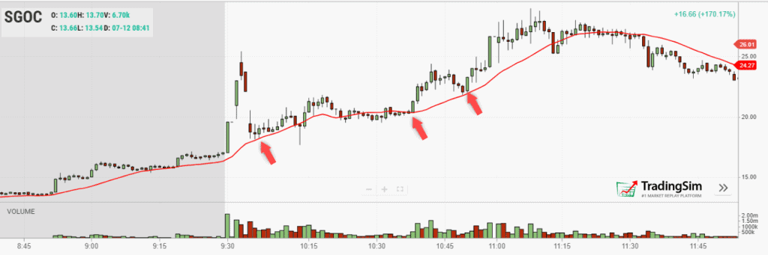
The best way to understand this concept is visually. So let’s have a look at an intraday example of a 20 moving average pullback on stock SGOC.
20 moving average pullback SGOC
Notice in the example above that SGOC “left the train station” in a hurry off the open. However, with some time to consolidate, it found its footing along the orange 20 moving average.
Then, after trying to break away a second time, it pulls back nicely again around 10:50am that morning. Offering yet another opportunity to go long at the 20 moving average.
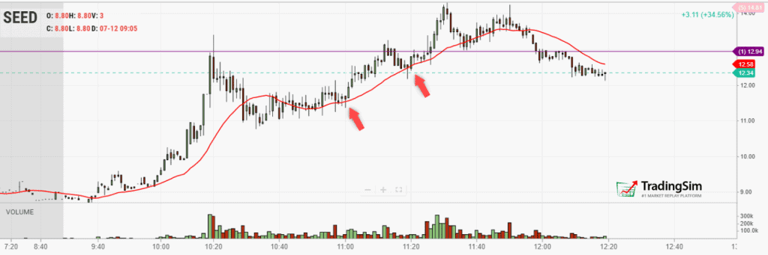
Here is another example with SEED intraday on the 1 minute:
SEED 20 moving average pullback
Take note of the prior uptrend, the big move, a pullback and consolidation that we’d call a Volatility Contraction Pattern, then a launch party right off the 20 moving average. Twice!
Even the second entry would have been good for a $2+ move in less than 15 minutes.
Daily 20ma Pullback Example
Daily charts can also provide a lot of “bigger picture” ideas for short term traders, even day traders. Think about it this way, if the 20 moving average can provide explosive opportunities on an intraday chart. What if you could anticipate reversals on the daily chart and either swing or day trade those big moves?
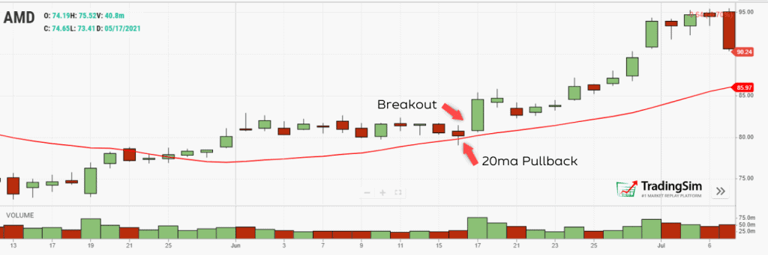
Here’s a great example with AMD on the daily. Notice that AMD was trending upward and above the orange 20 moving average.
AMD daily 20ma Pullback
The 20ma provided support with a close just above it on the daily chart the day before a breakout. This is exactly what we are talking about it.
The question then becomes, “How do we anticipate these moves?”
Let’s look intraday to see how you could have found this opportunity by searching for stocks nearing the 20 moving average.
Scanning for Pullbacks
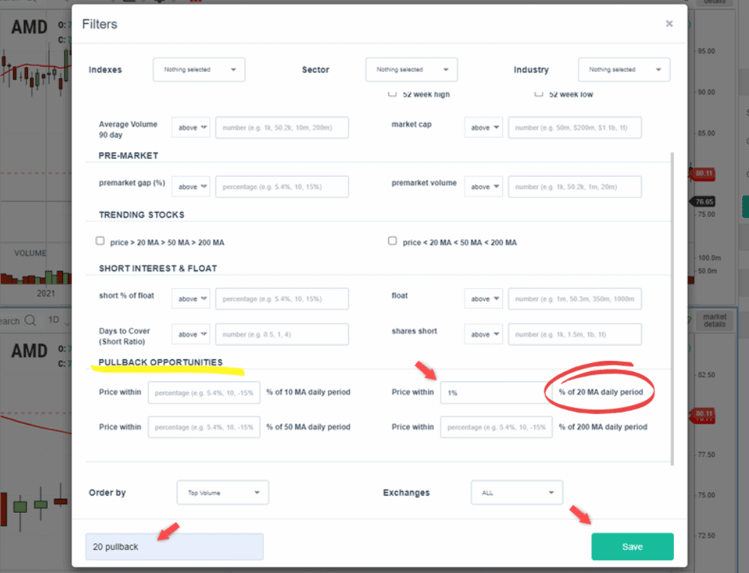
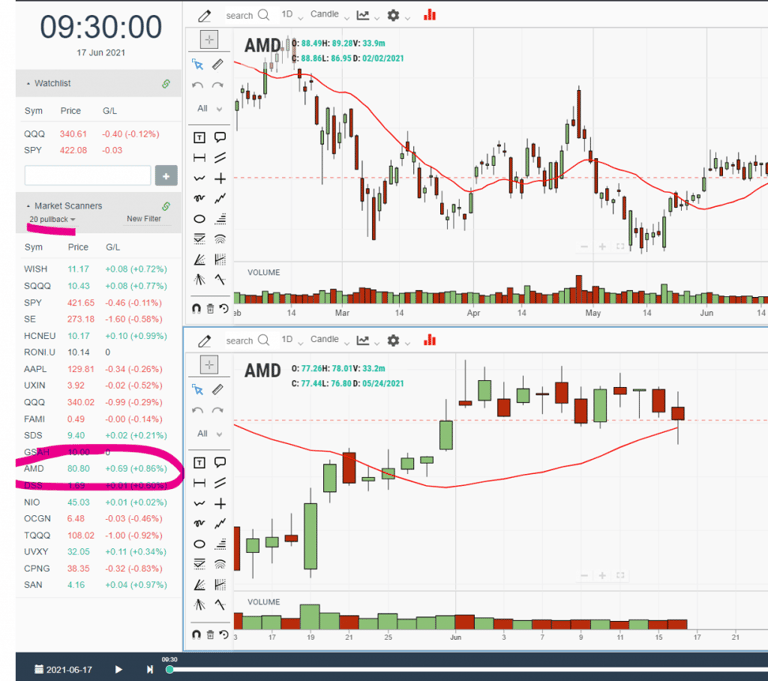
First, take a look at the scanning filter we set to find stocks on this morning that had pulled back to within 1% of the 20 moving average:
Scanning for pullbacks
After running the scan, we notice on our list that we have a number of stocks within 1% of the 20 moving average. This allows us to narrow our results. Here we have AMD showing up on the list!
AMD on list of pullbacks
After identifying AMD, we then have the opportunity to test our intraday strategies for a potential breakout of this tight base it has been forming on the daily chart.
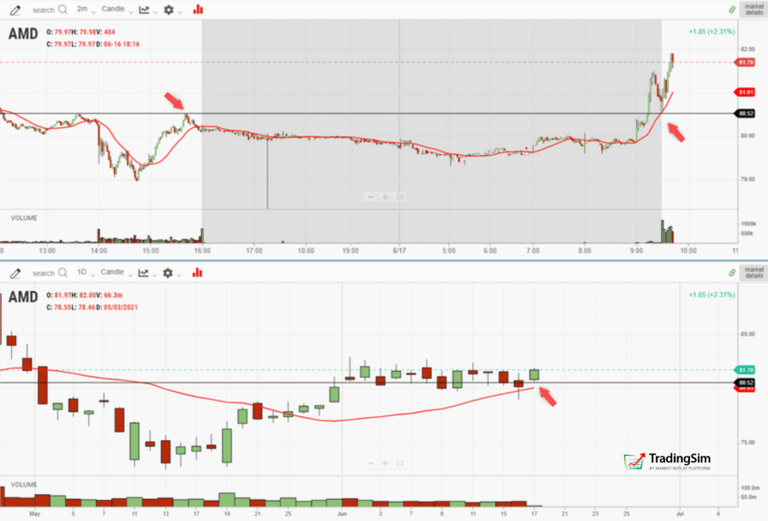
AMD cleared the prior day close in a premarket gap the next day. So the stage for momentum was set. It then retreated off the open and found support on a 20 moving average pullback on the 2-minute chart.
A perfect opportunity to go long!
AMD breakout
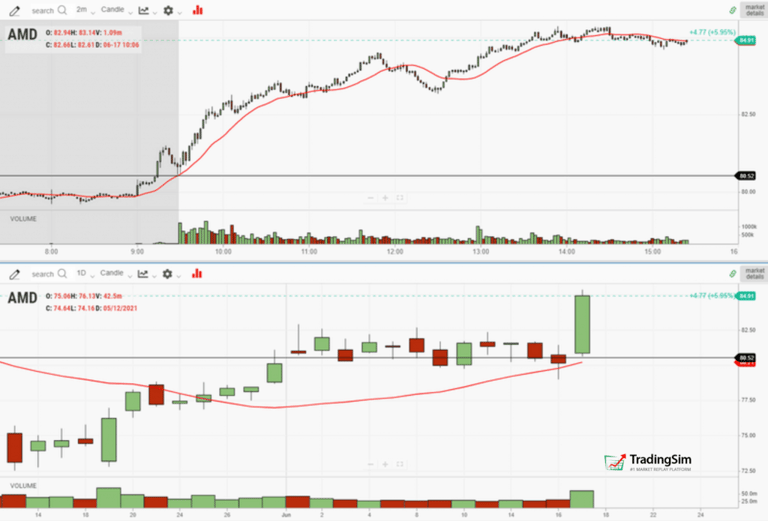
By later that afternoon, AMD rose a solid 6% into the close!
AMD 6% gain
As you can see, with the right criteria, pullbacks can be really explosive opportunities, for day trades or swing trades.
Practicing the 20 Moving Average Pullback Strategy
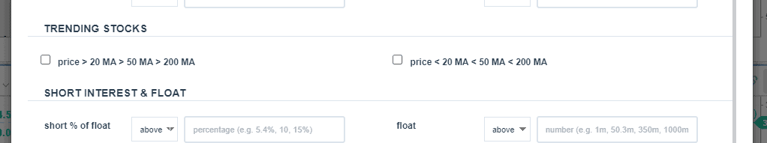
Just as we’ve shown, all it takes is perfecting your chart eye in the simulator to find the right criteria for pullback plays. We have added filters for the 10, 20, 50, and 200 moving averages if you want to try more moving average pullbacks.
Not only that, but we’ve added “trending” criteria if you want eliminate stocks in correction.
Trending Stock Filter
Our hope is that you’ll practice enough of these to know your probability for success, the right entry criteria, and proper risk management before you employ real money in the markets.
20-Moving-Average Pullback: Quick Answer (Updated April 2026)
The 20-moving-average pullback is a trend-following entry technique. In an uptrend, you wait for price to pull back to the rising 20-period moving average (typically the 20 EMA on intraday charts, or 20 SMA on daily charts), let buyers defend the line, and then enter on the bounce in the direction of the prevailing trend. The pattern works because the 20 MA is the most-watched short-term trend line in the market — institutions, algos, and retail traders all use it as a re-entry zone in healthy trends.
Bias: trend-following (long in uptrends, short in downtrends).
Setup trigger: price tags the rising 20 MA after pulling back from a swing high.
Entry: bullish reversal candle (hammer, engulfing, or close above prior bar's high) at the 20 MA.
Stop: below the swing low formed on the pullback, or below the 20 MA itself if the candle is tight.
Target: previous swing high or 1.5×–3× risk depending on trend strength.
The Four Conditions That Make a 20 MA Pullback Tradable
The 20 MA must be sloping in your trade direction. A flat or curling 20 MA means the trend is dying. Use a strict slope filter — the 20 MA today should be above the 20 MA five bars ago for longs.
Price must have made a higher high before the pullback. Trends are higher highs and higher lows. If the prior swing high failed to break, the pullback is into resistance, not support.
Volume must be lighter on the pullback than on the trend impulse. Light volume on the pullback tells you sellers are not aggressive — this is profit-taking, not distribution.
A reversal candle must form at the 20 MA. Don't anticipate. Wait for a bullish hammer, bullish engulfing, or close above the prior bar's high before triggering the entry.
Entry, Stop, and Target Rules
Component
Rule
Trigger
Reversal candle closes at or above the rising 20 MA after a pullback.
Entry
Long on the close of the trigger candle, or on a break of the trigger candle's high.
Stop
Below the swing low formed on the pullback, or 0.5× ATR(14) below the 20 MA — whichever is closer.
Target 1
Previous swing high or 1.5× risk.
Target 2
Trail behind the 20 MA itself; exit on a daily close below it.
Position sizing
Risk 0.5–1% of account per trade. With a tight stop, you can size up safely; with a wide stop, size down.
Time stop
If price hasn't moved 1× risk away from entry within five bars, exit at break-even.
EMA vs. SMA: Which 20 MA Should You Use?
The 20 EMA reacts faster to recent price than the 20 SMA, which gives it two effects:
Use the 20 EMA on intraday and short-term swing charts (1-min, 5-min, 15-min, 1-hour). The faster reaction tracks momentum better and produces fewer "MA gets left behind" trades.
Use the 20 SMA on daily and weekly charts. On longer time frames, smoothness wins. The SMA gives clearer support and resistance lines that institutions actively trade against.
If you're unsure, plot both. When the 20 EMA and 20 SMA converge into the same zone, that confluence makes the level even more meaningful.
The Three Failure Modes to Avoid
Trading the first pullback in a brand-new trend. The first pullback often fails because the trend hasn't established higher-low structure. Wait for the second or third pullback in the move — they have a much better hit rate.
Anticipating the bounce. Buying as price approaches the 20 MA, before any reversal candle confirms, is the most common way new traders lose on this pattern. Always wait for the trigger.
Holding through a daily close below the 20 MA. One closure below the 20 MA on a daily chart often invalidates the trend regime. Have a clear exit rule and follow it.
Practice the 20 MA Pullback in the TradingSim Simulator
The 20 MA pullback is a high-repetition setup — you'll see it many times per week on liquid stocks and futures. Use the TradingSim simulator to drill it:
Sessions 1–3: Replay 20 historical sessions on liquid mid-caps and the e-mini S&P. Mark every 20 MA pullback you spot, regardless of trade direction. Goal: pattern-recognition speed.
Sessions 4–7: Take simulated long positions only when all four conditions (slope, prior high, light pullback volume, reversal trigger) are met. Track the win rate.
Sessions 8–10: Add the trail-behind-the-MA exit. Compare your average winner to the trades you closed at first profit target.
Session 11+: Run the same drill on micro futures (MES, MNQ) on the futures simulator before risking live margin.
FAQ
Why is the 20 moving average so popular?
The 20 MA is the consensus short-term trend line on intraday and swing-trading time frames. It's plotted on more charts than any other moving average length except the 50 and 200, which means it acts as self-fulfilling support and resistance — price reacts at the 20 MA because everyone is watching it react.
Should I use the 20 EMA or the 20 SMA?
The 20 EMA on intraday and short-term swing charts (1-min through 1-hour). The 20 SMA on daily and weekly charts. When in doubt, plot both. When they converge into the same zone, that confluence is meaningful.
Where do I put the stop on a 20 MA pullback?
Below the swing low formed on the pullback, or 0.5× ATR(14) below the 20 MA — whichever is closer. Risk should be calculated from the entry to the stop, not from a fixed-percent rule.
Can I trade the 20 MA pullback on a 1-minute chart?
Yes, but only on the most liquid futures (ES, NQ) and only with momentum confirmation from a higher time frame. The 5-minute chart is generally the cleanest intraday time frame for this setup.
What invalidates a 20 MA pullback setup?
A daily close below the 20 MA in an uptrend (or above it in a downtrend), a flat or curling MA slope, or a pullback that breaks below the prior swing low without buyers stepping in. Any of these tells you the regime has shifted.
John McDowell is the Lead Content Strategist at TradingSim. His journey into day trading began in 2016 after conversations with a retired hedge fund manager. John is passionate about teaching and educating traders, curating content that helps others succeed in the stock market.
Exponential Moving Average Guide for Beginners [Updated April 2026]
When starting out in trading, there are a barrage of indicators thrown at you, all with promising strategies tied to them. The exponential moving average is sure to be one of them. Along with the...
How to Spot a Healthy Pullback Opportunity while Trading Stocks
Pullback opportunities are great for adding to or initiating positions while trading. However, not all pullbacks are created equal. In this post, we’ll show you a handful of ways to qualify a healthy...
Trend Trading Explained + Chart Examples and Video Scanning Guide [Updated April 2026]
Trend Trading Overview Trend trading is the practice of riding a security during a strong move up or down.[1] Now, what one person calls a trend can vary from trader to trader. For example, a penny...


 Day Trading Indicators


