This question seems to be on a lot of investors' minds lately. Inflation is no longer transitory according to the Federal Reserve, growth stocks are taking a beating from their 2020-2021 exponential gains, and many geopolitical events are weighing on supply chains. Will all of these factors culminate in a stock market crash of 2022?
Perhaps it could. Perhaps it won’t.
Rather than worry too much about whether the market will crash or not, as an investor, it is your job to protect your portfolio in the event that it does crash. Will you be a dollar-cost averager? Will you be a short-term day trader of volatility? Will you buy puts and hang on for dear life?
There are many ways to trade a stock market crash, and we can glean a lot from prior crashes. So, with that in mind, let’s examine what might indicate a stock market crash in 2022 by taking a look back at history.
What Is a Stock Market Crash?
The answer to this gets a bit subjective. Many believe that a market crash occurs when the market loses value very quickly, and this can be true. There are a few “flash crashes” throughout history that have seen massive corrections in a short amount of time.
However, a stock market crash doesn’t have to happen over night or in a mere matter of days like the Covid Pandemic Crash. It take many weeks or months to develop. And for that reason, a stock market crash is more likely synonymous with a bear market than anything else.
In other words, when we say the market crash of 2008, what we’re referring to is the lengthy bear market of 2008. Granted, many bear markets do seem quite scary as valuations begin to plunge 20%, then 40%, then 50% or more. In fact, some companies never recover from stock market crashes.
Regardless of whether you want to call it a stock market crash or a bear market, it is simply a period of prolonged price devaluation in the market of more than 20%.
When Did the Stock Market Crash?
The stock market has crashed quite a few times in the past 100 years. In fact, if we go back to 1929, there are at least 21 stock market crashes, including the Covid crash.
According to theBalance.com, the data looks like this:
- 2020: down 36% over 32 days
- 2007-2009: down 57% over 1.4 years
- 2000-2002: down 49.1% over 2.5 years
- 1987: down 33.5% over 101 days
- 1980- 1982: down 27.1% over 1.7 years
- 1973-1974: down 48% over 1.7 years
- 1968-1970: down 36.1% over 1.5 years
- 1966: down 22.2% over 240 days
- 1961-1962: down 28.0% over 196 days
- 1957: down 20.7% over 99 days
- 1948-1949: down 20.6$ over 363 days
- 1946: down 26.6% over 133 days
- 1940-1942: down 34.5% over 1.5 years
- 1939-1940: down 31.9% over 229 days
- 1938-1939: down 31.9% over 229 days
- 1937-1938: down 54.5% over 1.1 years
- 1934-1935: down 31.8% over 1.1 years
- 1933: down 29.8% over 95 days
- 1932-1933: down 406% over 173 days
- 1930-1932: down 83.0% over 2.1 years
- 1929: down 44.7% over 67 days
So you can clearly see that there is the occasional stock market crash over time. However, one glance at a long-term chart of the S&P 500 will tell you that these stock market crashes are eventually overcome. Even the worst of crashes eventually rallies.
How Often Does the Stock Market Crash?
On average, the S&P 500 corrects itself at least once every 2 years, give or take a few months. However, these are usually small corrections of 10% or so. Likewise, you may see a 20% correction on average every 7 years. This isn't clockwork, though. Just on average.
However, the bigger crashes of 30% or more typically only happen every 12 years on average. Therefore, a crash isn't as common as one would think. Not only that, but they don't last more than a few years usually, up to 5 years at worst.
What is important is to study some of the reasons why the stock market crashed during these times. If we study the past, it might help us to understand or anticipate the future.
Why Did the Stock Market Crash in 1929?
1929 was the beginning of the Great Depression. But what were the factors that led to the stock market crash of 1929 and beyond?
According to history.com, there were a handful of reasons behind the crash. However, there is one that is most notable. Here are some of the burdens that forced the market lower in 1929:
- Low wages
- Extreme debt levels
- Struggling agricultural sector
- Excessive bank loans with no liquidity
While all of these weighed heavily upon the market in October of 1929, they aren't the only reason that the ensuing years led to a greater depression in the economy. In fact, there was a considerable rally in the market after the initial shock and recession of the 1929 stock market crash.
Despite the rally, the generally accepted nail in the coffin that led to the broader depression was tight monetary policy. Despite a lack of spending (demand) in the economy, the Federal Reserve had raised interest rates due to the rapid rise in stock prices over the course of the 1920s.
Milton Friedman argued that the persistent tightening by the Fed into the early 1930s limited any effective intervention that they might have had to stave off a broader decline in the market and economy.
At the same time, there was a boom in housing construction during the mid-20s, which led to excess housing supply. All of this coupled with stock prices well above their earnings ratios, led to one of the worst stock market crashes and bear markets in history.
How Does the Stock Market Crash?
It behooves us to study history to understand how the stock market crashes. As we just discussed in the panic of 1929, there are many factors that play into a stock market crash. We discuss these in our post explaining bear markets as well, but it's worth reiterating.
- Extreme price valuations
- Lack of aggregate demand in the economy
- Reduced money supply
- High interest rates
- Cyclical profit-taking
- Unforeseen events
Not all crashes in the market are the same. For example, the "Black Monday" crash of 1987 dropped the market 20% in a single day due to a "computer program-driven trading" model that went awry, according to Investopedia. Likewise, the covid pandemic caused a rapid stock market crash in 2020.
So, not all market crashes are created equally. Some will recover quickly if the underlying economic and monetary forces are still in balance. However, the market crashes that tend to last are the ones with considerable economic and financial headwinds.
For that reason, if the yoke of unlucky stars begins to align, it becomes a matter of time before the market rolls over. And it is important to learn how to spot the signs of a stock market crash before it actually happens.
When Is the Next Stock Market Crash?
Well, if you were to ask Michael J. Burry or Peter Schiff, it's right around the corner. But, they've been saying that for quite a while. At least Peter Schiff has. Burry isn't quite as a stalwart on the bearish side and more of an active trader than Schiff, but they do seem to have a similar read on the market.
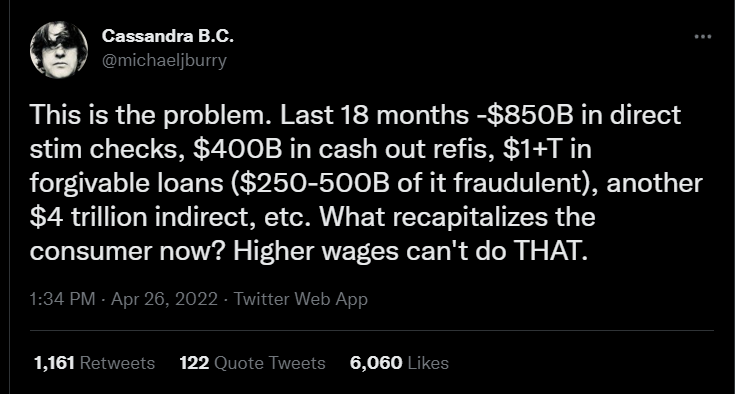
Just as we saw earlier that lower wages brought on less aggregate demand in 1929, there appears to be a similar concoction of economic issues affecting the current market due to the high cost of goods and services due to inflation. Despite higher wages, those wages purchase much less.
While this is no indication of whether we are entering a stock market crash, investors should always consider the technical aspect of the market, like the price cycle and technical analysis. Is there something we can glean from that? Here is a look at the normal price cycle for stocks:
The price cycle could last many years or even decades in a bull market. So investors must ascertain how to protect their investments during any drawdowns.
How to Protect 401k from Stock Market Crash
If you find yourself at the top of the price cycle in a multi-year bull market, it may be time to take some proactive measures. Here are 5 strategies you can use in order to protect your 401k or other investments from a stock market crash.
- Short the Market
- Buy inverse ETFs
- Invest in hard assets like gold or real-estate
- Raise cash
- Dollar-cost average
Let's take a look at each one of these in the next section.
How To Prepare for a Stock Market Crash
In order to protect your portfolio when the market is topping, you can initiate a short position by using put options, or simply outright shorting the indexes or prior leading stocks.
We don't recommend doing this without testing your strategies in our simulator first. Study up on short strategies like the head and shoulders pattern and the double top, then go to work protecting your investments.
If you don't feel comfortable shorting the market, you can simply buy an inverse ETF of the market. These go up when the market goes down. Here is an example of the QQQ Nasdaq etf and its counterpart, the SQQQ.
Using this strategy requires less complication with options. Just buy the SQQQ when you think the QQQ is going down.
You can also sell your profitable investments and go to cash, gold, silver, or real estate until the headwinds in the market shift. However, if you decide to stay the course for the long haul, you might want to employ a dollar-cost averaging strategy.
To do this, you simply continue your inflows into the portfolio while the market is in a correction. This keeps your average cost low for when the market eventually rallies -- assuming that it does.
How To Trade a Stock Market Crash
We are big proponents of practicing the markets. If you're going to manage your own money, you need look at charts and practice strategies before you put your hard-earned cash to work. To that end we recommend a few strategies for identifying market tops.
The head and shoulders pattern is a classic example of distribution in the market. It is easily recognizable as an outline of two shoulders with a head on top. It looks like this:
If you're interested in learning more about this strategy so that you can practice it in the simulator, be sure to check out our recent post how to trade the head and shoulders pattern.
The Double Top pattern, on the other hand, lacks the second shoulder component. However, it is still considered a distribution pattern, just like the head and shoulders.
For this pattern you want to see a large distribution event, followed by a pullback in the market, then a rally back to the highs. This rally must eventually fail near those recent highs. It denotes an opportunity for large shareholders to exit their positions once again, then begin the price markdown phase. It looks like this:
Whichever pattern suits you best, be sure to spend time in the simulator recognizing this pattern and practicing your entry criteria. Once you know your outcomes for success, it's just a matter of putting real money to work using the same strategy!
We hope this helps you with your understanding of when and how the next stock market crash could occur. While no one has a crystal ball, it is always a good practice to stay on top of current market and economic conditions. It is also important to understand some technical analysis so that you can make educated decisions regarding your portfolio.


 Basics of Stock Trading


