Today we are going to talk about a very common chart formation. It is a reversal chart pattern, which appears at the end of trends. If you notice an upside down W formation in stock charts, then you can consider yourself familiar with the well-known double top chart pattern.
The double top is a chart pattern with two swing highs very close in price. This pattern can be seen in all time-frames. There are a few requirements to classify a chart pattern as a double top:
Two peaks that are near equal in price
Equal distance in terms of time between highs
Volume decreases on the second top
Double tops have an enormous amount of “cause” or breakout potential as the price of the stock has moved back in forth within a defined range. So, when the stock finally breaks out, there is an expansion in volume and price movement. Breakouts can occur to both the upside and downside. If you enter a breakout of a double top chart pattern, you will want to keep a close stop above/below the support and resistance level.
Double Top Confirmation Signal
Every chart pattern has a confirmation signal. The double top chart pattern is no different.
The pattern has a trigger level, which is used for confirming the pattern and for opening positions in the direction of the reversal breakout. The signal line is located at the bottom, between the two tops of the pattern. When this line is broken, we have a reversal confirmation signal and a nice opportunity to go against the primary trend.
The image below illustrates the double top breakout, and the breakout confirmation trigger.
Double Top
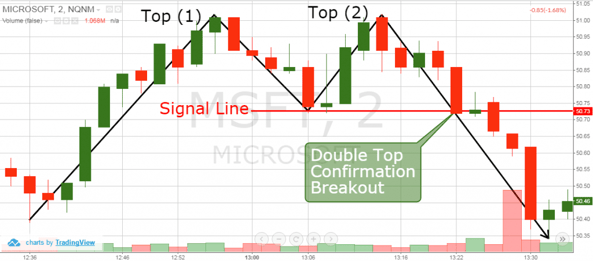
Above, you see a standard double top chart pattern of the 2-minute chart of Microsoft from January 15th, 2016. After a rally to top 1, MSFT had a minor correction prior to creating a second top.
The bottom between the two tops is the signal line which is used to confirm the pattern. After creating the second top, the breakout through the signal line is the confirmation signal of the pattern. In this case, the proper moment to short MSFT based on the double top strategy is with the closing of the long bearish candle, which breaks the signal line.
As you see, after the double top confirmation breakdown, the price continued lower, reaching $50.37 per share.
Double Top Price Target
After the confirmation of the pattern, your minimum target is equal to the size of the formation. In other words, when a stock breaks out of a double top formation, the price target is the range of the formation added to the breakout level.
Double Top Price Target
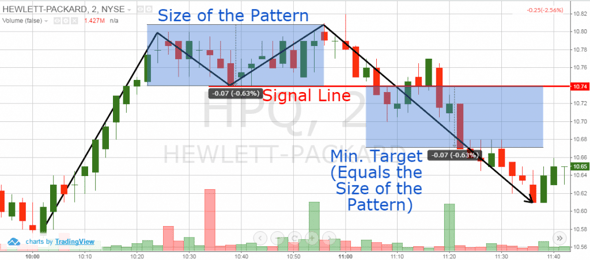
Above is the 2-minute chart of Hewlett-Packard from Jan 14, 2016. The image displays another double top pattern example, where we measure the size of the figure and its minimum target.
The black lines on the image follow the price action, which confirms the double top. The blue horizontal rectangle is the range of the formation. Once the price broke the signal line, I used the range to calculate the price target of the pattern.
Notice that the second top is slightly higher than the first one. For this reason, we take this top to measure the size of the pattern. We stretch the blue field area from this top to the signal line. The range between these two levels is the size of the pattern. It appears that this double top formation is $0.07 (7 cents) long.
Now that we know the size of the figure after the double top is confirmed we need to calculate our minimum target.
Simply take $0.07 (7 cents) and deduct this value from the signal line shown on the image. Notice that the two blue areas are absolutely identical. The reason for this is that the minimum target of a double top equals the size of the formation. Since the signal line is located at $10.74 per share, then the minimum target of the pattern is at $10.74 – $0.07 = $10.67. In this manner, the pattern on the chart provides an opportunity to short HP for a profit of 0.63%.
Many traders claim that when you trade double tops, you should place your stop loss above the lower top. Personally, I do not agree with this rule. The reason for this is that if you place your stop above the lower top, in many cases your win-loss ratio is less than 1:1.
Since we know that the double top pattern success rate is 65%-70%, we would be walking into a losing situation with this kind of odds.
For this reason, I believe the stop loss should come closer to the entry price. For example, you can put your stop loss at another smaller swing point or candlestick high, which comes after the second bottom. If the price move after the bearish bottom is consistent with no corrections, then simply measure the distance between the second bottom and the trigger line, and place your stop loss in the middle.
I think this is an optimal risk management solution for the double top chart system. This way, you will get at least 1.8: 1 win-loss ratio, which makes the pattern system profitable. Have a look at this double top pattern example, which compares the two risk management systems.
Double Top Price Target – 2
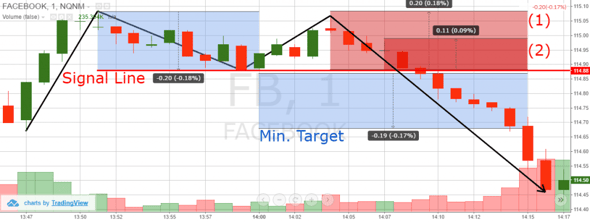
Above you see a standard double top chart pattern of Facebook. The chart frame is 1-minute from March 30th, 2016.
The black lines indicate the double top figure. The red ray is the signal line of the pattern. The two blue areas on the chart are the size of the formation and the respective minimum target. The two red areas are the two stop loss options we have.
In the first option, the stop-loss order is located above the second top. As you see, this is $0.20 (20 cents) above the entry price, which is a 0.18% price move.
However, the target is located $0.19 (19 cents) below the entry price and this is 0.17%. In this manner, the win-loss ratio which we get with the first stop loss option equals 0.17: 0.18.
As you see, in this case, you will risk 1 and will get less than 1, which simply does not make sense without a win ratio of 85%+.
Therefore, I suggest using the second stop loss option. On the way down from the second top to the signal line, the price created only one candle which is not bearish – it is a doji.
Therefore, I use this as a top (a price action level), where I can place a tighter stop. Furthermore, this level is approximately the mid-point between the top and the signal line, which conforms to the other rule we have when choosing a stop loss level.
When placing the stop loss, we risk only $0.11 (11 cents), which is 0.09%. Since we have the same target, we now get the following win-loss ratio:
I believe this option is definitely better than the first one. After all, if the price increases through the midpoint of the second top and the signal line, it will rarely resume pursuing the minimum target of the pattern.
Double Bottom Chart Pattern
The double top chart pattern has its identical twin – the double bottom chart pattern. The difference between the two patterns is that the double bottom is a full mirror image of the double top. This means that all we have stated thus far is applicable for the double bottom pattern in the opposite direction.
Below is an image of the double bottom formation.
Double Bottom Chart Pattern
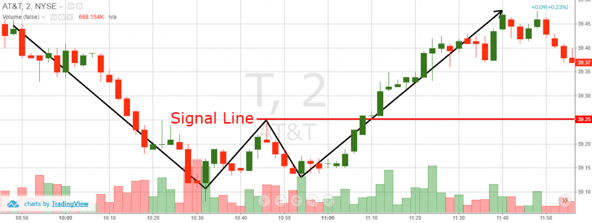
Above we see the 2-minute chart of AT&T for Mar 30, 2016. The image illustrates a classical W Bottom chart pattern. The red horizontal ray is the signal line of the pattern. When AT&T breaks this line in a bullish direction, we get a long signal for a minimum target equal to the size of the pattern. As you see, the double bottom really works the same way as the double top pattern!
Now that you are familiar with the double top chart definition and the double bottom formation, I will now show you how to trade them successfully.
Double Top and Double Bottom
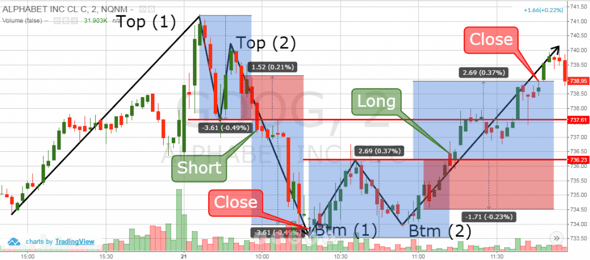
Above you see the 2-minute chart of Google from Mar 21, 2016. The image displays two trading cases – a double top and a double bottom chart pattern.
After a decent price increase, Google creates a top. Then there is a corrective move followed by a new price increase which develops into a second top. The red horizontal line on the bottom between the two tops is the signal line.
After creating the second top on the chart, GOOG decreases through the red signal line. This breakout gives us a confirmation signal of the pattern and a great short opportunity.
The first two blue areas on the chart are the size and target of the double top chart pattern. The first red area is the risk we are taking on this pattern and the respective stop loss location. The stop loss exposes us to a risk of 0.21%. At the same time, the minimum target calls for a profit of 0.49%. In this manner, we get a win-loss ratio of: 2.33: 1
0.49 : 0.21 = 0.49/0.21 : 0.21/0.21 = 2.33 : 1
After we short Google, the price continues its decrease. 20 minutes later, Google completes the minimum target of the double top pattern and we close the trade with a .49% profit.
The decrease which brings us the .49% profit creates the first bottom of the next pattern on the chart. After a bullish correction and a new decrease, the price action creates a second bottom on the chart.
We notice the double bottom potential on the chart and we build our signal line. It should be placed on the top, which is located between the two bottoms of the pattern. The second two blue areas on the chart measure the size of the double bottom and its respective target.
A new increase in the Google price leads to a breakout through the signal line, which confirms the pattern. Our double bottom pattern technical analysis shows us a little bottom below the entry price, which looks like a great location for our stop loss. In this manner, the risk we are taking in this trade equals 0.23%. At the same time, our target is 0.37% profit. In this manner, our win-loss ratio equals 1.61: 1 win-loss ratio.
After we go long on the signal line breakout, the Google price continues its increase. 34 minutes later Google reaches the target of the pattern and we close our trade with a 0.37% profit.
The result from these two trades equals 0.86% profit for less than 1 hour of “work”. The risk we took equals 0.44%. The average win-loss ratio from the two positions equals:
The double top is a reversal chart pattern with two swing highs, which are very close in price.
The double top can be found in all time frames.
The bottom between the two tops indicates the double top’s signal line.
When the price breaks the signal line after creating the second top, we get a confirmation of the pattern.
The price target of the double top pattern in length equals the size of the formation.
The risk you are taking in a double top trade should be less than the size of the pattern in length. This way you will get more than 1:1 win-loss ratio, making your double top strategy profitable.
The identical twin of the double top is the double bottom pattern. All the rules we discussed are fully applicable for the double bottom too but in the opposite direction.
Alton Hill is the Co-Founder of TradingSim with over 18 years of trading experience. He completed the Design Thinking Bootcamp at Stanford’s D.School and brings expertise in Product Development to create the best trading simulation experience. His strategy focuses on trend-following systems, targeting high-volatility stocks with strong primary trends using the 15-minute chart.
How to Trade Symmetrical Triangles- Winning Strategies
To practice the symmetrical triangle example detailed in this article visit https://www.tradingsim.com. Symmetrical Triangle Definition A symmetrical triangle is the most common triangle chart...
The Harami candlestick pattern is usually considered more of a secondary candlestick pattern. These are not as powerful as the formations we went over in our Candlestick Patterns Explained article;...
Ascending Triangle Pattern – Chart Examples and Guiding Principles
What is an Ascending Triangle Pattern? An ascending triangle is just that, a triangle that’s on the rise. The pattern is a continuation pattern of a bullish event that is taking a breather as the...


 Trading Strategies


