When you review your historical trades, you will notice that given a better entry price, your loser could have actually been a winner. It’s like anything in life timing is the key.
When day trading, you will have the natural inclination to go back and tweak your system, or look to pull in additional indicators to gain an edge, when in reality your timing and or execution are off.
In this article, we are going to explore how to enter and execute a trade, as well as three methods for how to improve your trade entry and execution. Simply addressing these three items can improve your trading performance, without having to completely alter your system.
Let’s ground ourselves a little before we get into the details of the article. For starters, this article is targeted for day traders that buy the dips and sell the highs.
For breakout traders, you will use the same methodology; however, you will need to track how far and for how long the stock goes against you before continuing in the direction of the primary trend.
For swing traders, the same rules also apply; however, your numbers will be larger on all fronts due to the fact you are likely trading using 60-minute or daily charts.
#1 – Analyze Your Historical Trades
Depending on your trading performance, this could potentially be a painful process, but one that is necessary. What we are trying to do is establish a baseline of when a stock truly hits its bottom or its peak after you entered the position. We of course will want to assess the bottoms for long entries and peaks for short entries.
For your long entries, I would expect your analysis to look like the following:
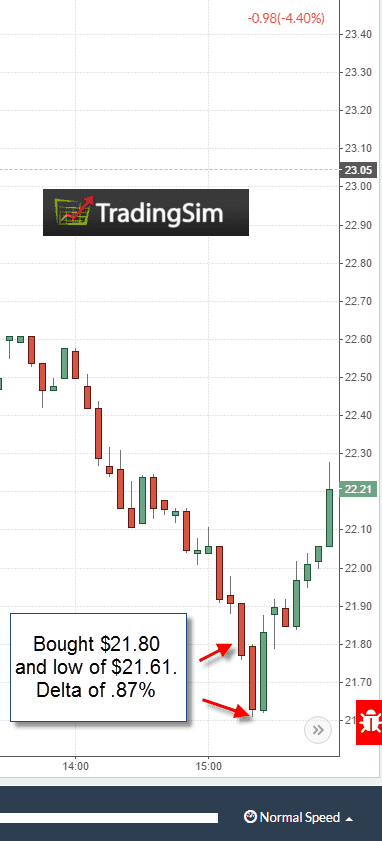
Trading Low
In the above example, you would have bought at $21.80, but the low didn’t come in until $21.61. This would give you a delta of ~.87%.
Let’s take a look at an example on the short side.
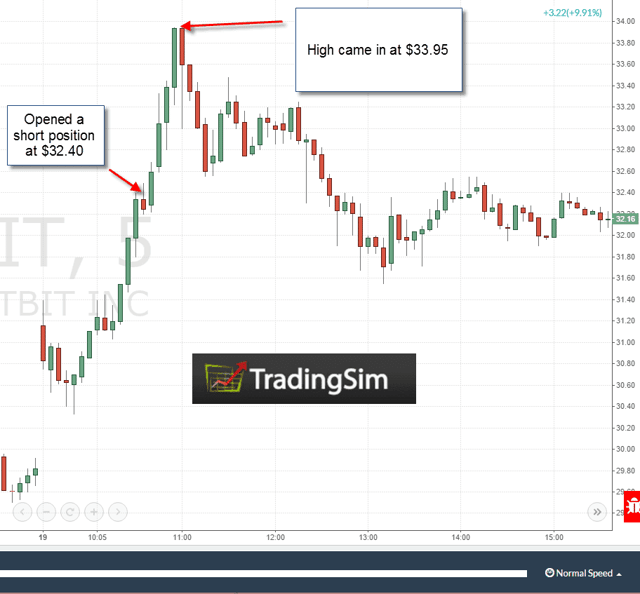
Trading High
Notice that the short entry was a bit premature, which resulted in a 4.5% loss, prior to the start of the down move.
Now, I’m not suggesting that you mock up every trade on a chart, but you do need to document your entry price against the actual price when things started to go your way.
The more trades you include in your analysis the better. You should come up with a list similar to the following:
| 0.02 |
| 4.5 |
| 3.8 |
| 1.2 |
| 0.7 |
| 0.45 |
| 0.33 |
| 0.87 |
| 0.23 |
| 0.08 |
| 0.22 |
These values represent how close your entry was to the actually start of the move you were looking for.
Now that we have the list of values, which if you are a day trader, should consist at a minimum of 250 traders or more, we need to do some basis statistical analysis.
We need to find the median of the trading results in order to sift through all the data.
Do not go with the averages, because the outliers are going to distort the final numbers. In the above example, after ordering the numbers from least to greatest, our list now looks like this:
| 0.02 |
| 0.08 |
| 0.22 |
| 0.23 |
| 0.33 |
| 0.45 |
| 0.7 |
| 0.87 |
| 1.2 |
| 3.8 |
| 4.5 |
As you can see, .45% is the number in the middle of our data set and would represent our median value. If we had an even number of trades, we would take the average of the two numbers in the middle to identify our median. For more on how to calculate median values, please take a look at this video from Virtual Nerd.
To see how to calculate the median using excel, please take a look at this video from Statistics How To.
Again, your data set needs to be 250 trades or more; I am just showing a short list to quickly illustrate the point.
So, what is this data showing you? If you are .45% off on your entry price, then what are you to do? Should you go out and immediately adjust your system to account for .45% on every trade?
No! The purpose of this analysis is to show you that you are generally off by .45%, which means you are pulling the trigger too quickly.
Again, do not make any changes to your trading system. In this example, what the trader should do is recognize that once their buy or sell triggers are reached, don’t take the trade. At this point, the trader should begin to closely monitor the trade to identify the potential turning point, knowing that at .45% the change in trend they are looking for is likely to start.
This is an imperfect trading approach, as it’s more art than science, but determining the median will develop patience in your trading approach. Having a certain level of patience is critical to learning to control your emotions when engaging with the market.
#2 – Evaluate Time
The second element you need to account for is time. What I mean by this is how long did it take for the trade to either bottom out or peak after you entered the position.
You should be able to assess this based on your entry time stamp and the time stamp of when the stock peaked.
Your analysis on the chart should look something like the following:
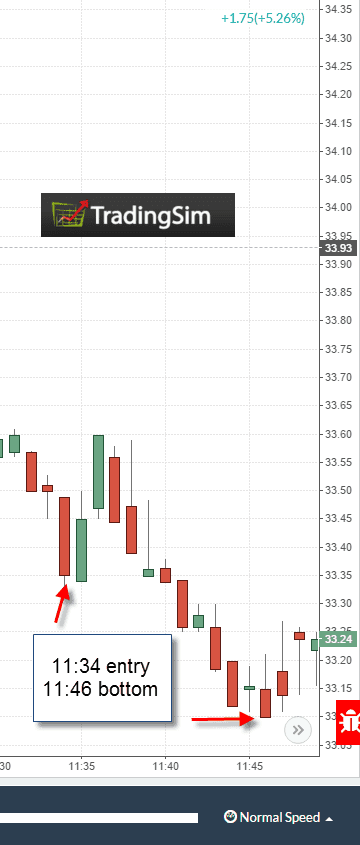
Time Delta
In the above example, we are using the 1-minute chart, but if you have access to tick charts, then great. Whatever the lowest time frame available on your platform is what you should use to calculate the time of the low or high. Your entry of course is time stamped, so no need to figure that one out.
Okay, now that we have all of the time deltas between your entry and the final high or low, you should get a range like the following:
| 1:24 |
| 2:05 |
| 2:17 |
| 2:34 |
| 3:10 |
| 4:34 |
| 6:45 |
| 8:54 |
| 10:11 |
| 11:30 |
Since we are using an even data set, we will take the two numbers in the middle (3:10 and 4:34) and divide by 2, which gives us a median value of 3 minutes and 52 seconds.
This means that on average you are 3 minutes and 52 seconds early to the party. As you can see in day trading, minutes can literally mean the difference between large gains, small profits or a loss.
Similar to price, timing should also give you an indication of the level of patience required of you to improve your trade entry.
#3 – Trade Execution
Trade execution is actually the easiest part to cover in this article. In any business, you have to know exactly what you are paying for in terms of goods or services, in order to determine your margins. Why should trading be any different?
To this point, I only use limit orders for placing trade entries. If you use market orders, then you are in the dark with how close you will be to your target entry point. Based on the example we have covered today, where the trader is only off by .45%, a market order on a stock with a large bid/ask spread could make or break our entry.
Bringing it all Together
Where does this leave us? In this example, we know that on average we jump the gun by .45% and are 3 minutes and 52 seconds early. These are now your guideposts for future trades.
Again, you should not adjust your system in any way, because this baseline would no longer be applicable. Therefore, on a go-forward basis, once your trade trigger is hit, you need to take a deep breath and let the trade develop as you know that both price and time still have a bit of work to do.
Remember, if you can improve your entry price, you will reduce the number of times your stop loss orders are triggered. So, this is more than analysis, you can keep more money in your pocket.
The Tradingsim platform can allow you to quickly place hundreds of trades in a matter of a few days using real tick data. To see how we can help improve your trade entry and execution, please visit our home page.
Much Success,
Al


 Swing Trading Strategies


