✓ Reviewed by Kunal Vakil, Co-Founder of TradingSim · Updated Mar 29, 2026
I have personally been studying how to measure trading performance for many years. It’s one of those topics that many traders either avoid or spend little time researching. Most traders, simply think of performance in terms of dollars made and loss.
The bottom-line in terms of dollars is always the ultimate score; however, along your trading journey, effectively measuring your day trading performance is the key to consistent long-term gains.
Trading performance can be expressed in many forms and complex algorithms, but it’s essentially the mechanism used to evaluate a trader’s return and risk tolerance or lack thereof. All types of traders can be measured from day traders, to swing traders and everything in between.
The challenging thing with measuring performance is it can include a ton of numbers and measurement approaches, which leads to the next section of this article.
Trading Performance Reports
These reports are supposed to provide you with key trading performance statistics; however, most are just a data dump.
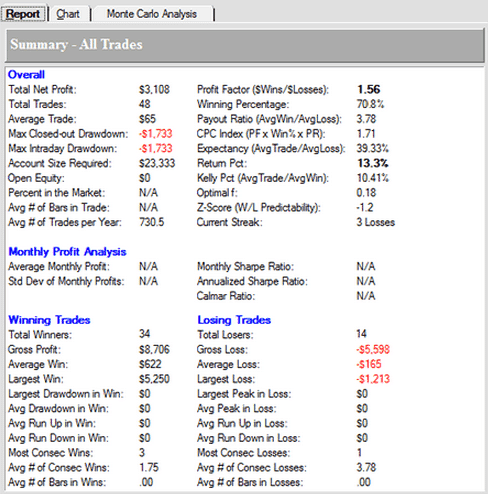
Most reports will look something like the one below:
Trading Performance Report
Conventional wisdom would tell you that with so many numbers present on a page, you should be able to zone in on your problem. My conversations with traders have shown me the exact opposite.
Traders become disenchanted with all the ratios and formulas, because the majority of us are not statisticians at heart, and we begin to focus on what I call the big 5:
How many winning trades
How many losing trades
Net Profit
Largest Winner
Largest Loser
Depending on where you are in your trading career, you may just focus on the first three items in the aforementioned list.
The problem with these reporting systems is not that they aren’t accurate or that they are not trying to help you. The problem is, they provide way too much information.
Trading Performance Graphs
Most active traders and day traders are visual learners. Why else would we fill completely comfortable sitting in front of flashing screens for hours at a time?
After reviewing the trading performance report, your next likely move is to look at your performance graphs.
Trading Performance Graph
As always, a picture is worth a thousand words. From a basic line chart, you can tell how consistent you are at making profits.
Do you look at your chart and see a huge drop or rise in equity? Do you see your performance constantly hover around a certain account value, but you are unable to have a breakout moment when trading?
While the graphs are the visual representation of your trading activity, what value do they really add? How do these graphs help you figure out what to address in your day trading system?
What is Good Performance?
This question haunted me for many years. As soon as I would get into a good rhythm, I would began thinking, “I wonder how much this trader is making.” Or I would see an article on a top trader that has put up 50 winning day traders in a row, or a trader that turned $50,000 to $1,000,000 in less than 2 years.
On an intellectual level, I knew that these results were either undocumented or the unicorn of trading performance. For some reason though, I was unable to prevent myself internally from wondering, is there more? Could I have made more money this year, or last week.
This is a perpetual cycle that traders go through where they feel that if only they could be as better as the next trader, somehow everything in their professional trading career would magically align.
Let me dis-spell this myth once and for all. The only trading performance you need to concern yourself with is your own.
Please take a moment to digest that concept.
How much money should you be making in a week? Ask yourself. How much money should you be able to return in a year swing trading? Ask yourself.
Once you reach this point in your trading career and trading psychology, you are now ready for the breakthrough that has been eluding you for so many years.
So How do You measure Performance?
While there are a host of graphs, formulas and complicated algorithms to measure your trading performance, I am here to tell you there are 2 numbers that matter the most.
#1 – R
R
R is the profit factor which takes the total of your winning trades divided by the absolute value of your losing trades to determine your profitability. I like calculating in terms of R, because it allows me to see the amount of money I am making relative to my losses, regardless of the number of trades. So, if I have a winning percentage of only 40%, buy my winners are much larger than my losers, I will still turn a profit. For example, take a look at the below table to further illustrate this point:
8000
Winner
3500
Winner
5400
Winner
-2500
Loser
-4500
Loser
3000
Winner
-800
Loser
-734
Loser
-2000
Loser
-1500
Loser
10 Total Trades
4 Winners
19900
6 Losers
12034
R=
1.65
As you can see, in this example, even with more losers than winners, you are still 65% more profitable on your winning trades and therefore able to land in the black. If you get nothing else out of this article, stop obsessing over your win/loss percentage – focus on your R.
#2 – Maximum Draw Down
Maximum Drawdown
Maximum draw down represents how much money you lose from a recent account high before making a new high in your account. For example, if you just had a high of $100,000 and then pull back to $85,000 before exceeding $100,000, then you would have a maximum draw down of 15% ($85,000/%100,000). The maximum draw down is probably the most valuable key performance indicator you should monitor when it comes to trading performance. As I have discussed in previous articles, the line between traders that blow up their accounts and the top 10% of traders is the ability to minimize your draw downs.
Bringing it All Together
To this point in the article, you have probably heard of these topics in one form of another. Well now it’s time to take the conversation to the next level. In order to measure your performance you need to first determine how many trades you need in a cycle.
For me, it’s 10 day trades based on my level of trading activity. Your number of trades can be higher or lower.
Next we need to start tracking your R and maximum draw down over your preferred trading cycle.
At the end of each cycle, you will want to document the value of R and the maximum draw down values.
Establish Your Baseline
What you will notice is you will begin to establish your baseline as a trader after your first 5 to 10 cycles. In your first cycle, you may have a .35 for R and a 25% for draw down. Don’t think of the numbers as good or bad, remember it’s all relative and unique to your trading journey.
As you continue to establish your baseline, a couple of things will happen.
One, you are conditioning your mind to think in shorter durations. As traders, we tend to lose ourselves in a trade hoping to either hit it big or we become emotionally attached. This is a by-product of losing a grip on the concept of time, meaning we have tons of it. It’s really simple, when you break it down.
If I tell you that you have 5 days to live, I’m pretty sure you will be able to quickly determine how you are going to spend your time over the week. You will likely want to see your family and hit a few bucket item lists. Now imagine if I asked you what you wanted to do over the next 30 or 40 years?
This is much harder to articulate and often will lead to more questions than responses.
Trading is no different. If I tell you that you only have 10 trades to measure your performance, you will sharpen your pencil a bit more on each trade and it will help you focus on your cycle.
Plot Your Progress
All you need to do now is plot two simple graphs: one for R and one for maximum draw down.
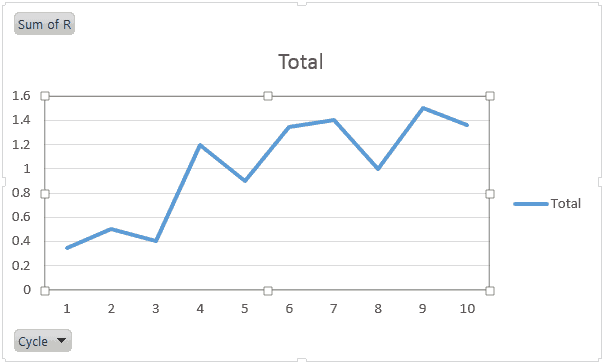
For your R values, you want to see the line begin to trend up and to the right over each cycle. A graph up and to the right tells you that you are making more money on each winning trade versus your losers. It will not be in a linear fashion as trading is not a simple endeavor.
R-Cycle
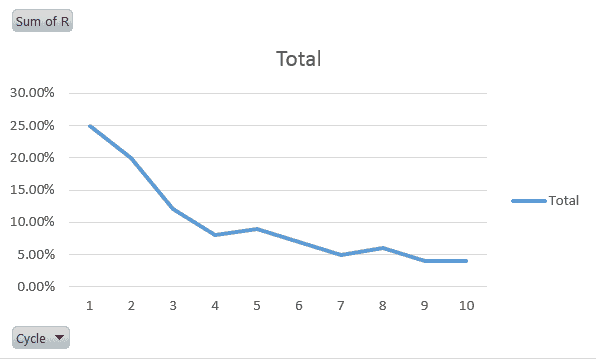
Secondly, you will want to plot your draw downs for each trading cycle. For the draw down view, we want the exact opposite as the R graph. We would like to see the draw down percentage trend lower over each subsequent trading cycle.
Draw down
Compete Against Yourself
Compete Against Yourself
Whether traders want to realize it or not, in order for you to make a profit, someone else has to be on the other end of the trade. Now that doesn’t mean they will lose in the end, but studies have shown that 85% – 90% of day traders fail at turning a consistent profit.
So, instead of running someone else’s race and worrying about their returns, compete with yourself. Stop asking how much money you should be making or what is a realistic return, start defining that based on your abilities.
Once you establish your baseline, do everything in your power to exceed your baseline. Continue to drive your R up and to the right, while pushing your draw down into the ground. Having this level of focus on each trading cycle will ultimately catapult you into the small percentage of winning traders.
In summary
Stop obsessing over the dozens of trading performance indicators and reports. You need to establish very basic trading performance metrics centered around profitability and measure these in short sprints.
To this aim, the TradingSim market replay platform allows you to quickly go through dozens of cycles in order to quickly establish your baseline without risking your money. Please take a moment and visit our homepage to learn how to measure trading performance with our trading simulator.
Alton Hill is the Co-Founder of TradingSim with over 18 years of trading experience. He completed the Design Thinking Bootcamp at Stanford’s D.School and brings expertise in Product Development to create the best trading simulation experience. His strategy focuses on trend-following systems, targeting high-volatility stocks with strong primary trends using the 15-minute chart.
Definition of Overtrading If you look across the web, you will find many articles that cover the topic of overtrading; however, the information is related to a company selling more than it can...
Sharpe Ratio – 6 Things You Need to Know [Updated May 2026]
In this article, I will cover the Sharpe ratio indicator and if it’s something you can use to track your trading performance. While this ratio is often used for institutions, you can also use it to...
Performance of China Steel and US Steel – Who is Winning the Battle
Steel, is often said to be one of the metals or commodity that is essential to a country’s economic growth. Considered to be the lifeblood of a healthy and a wealth creating manufacturing country,...


 Trading Discipline


