

8 min read
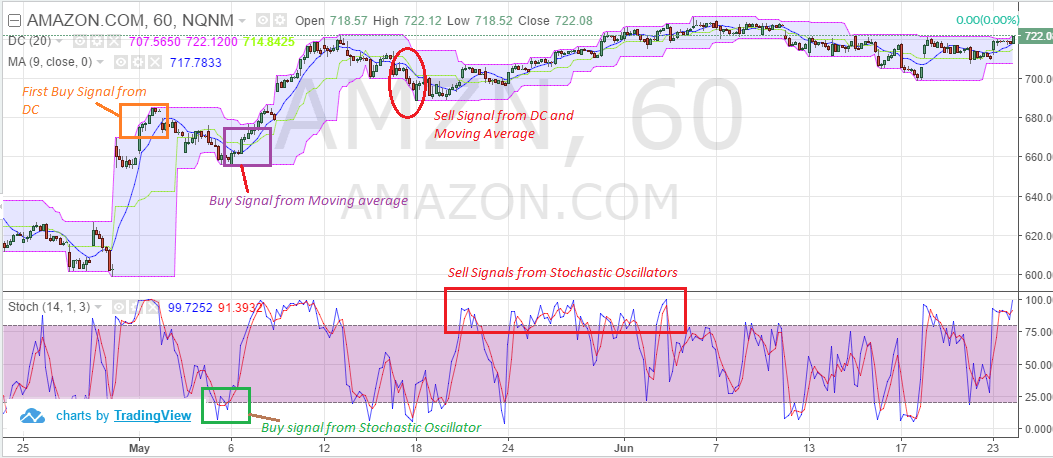
Awesome Day Trading Strategies
4 min read
Day Trading the Three Bar Reversal Pattern [Updated June 2026]
The 3 bar reversal pattern is one of the more common trading setups. The reason it’s so common makes it an easy target for newbie traders when they...
7 min read
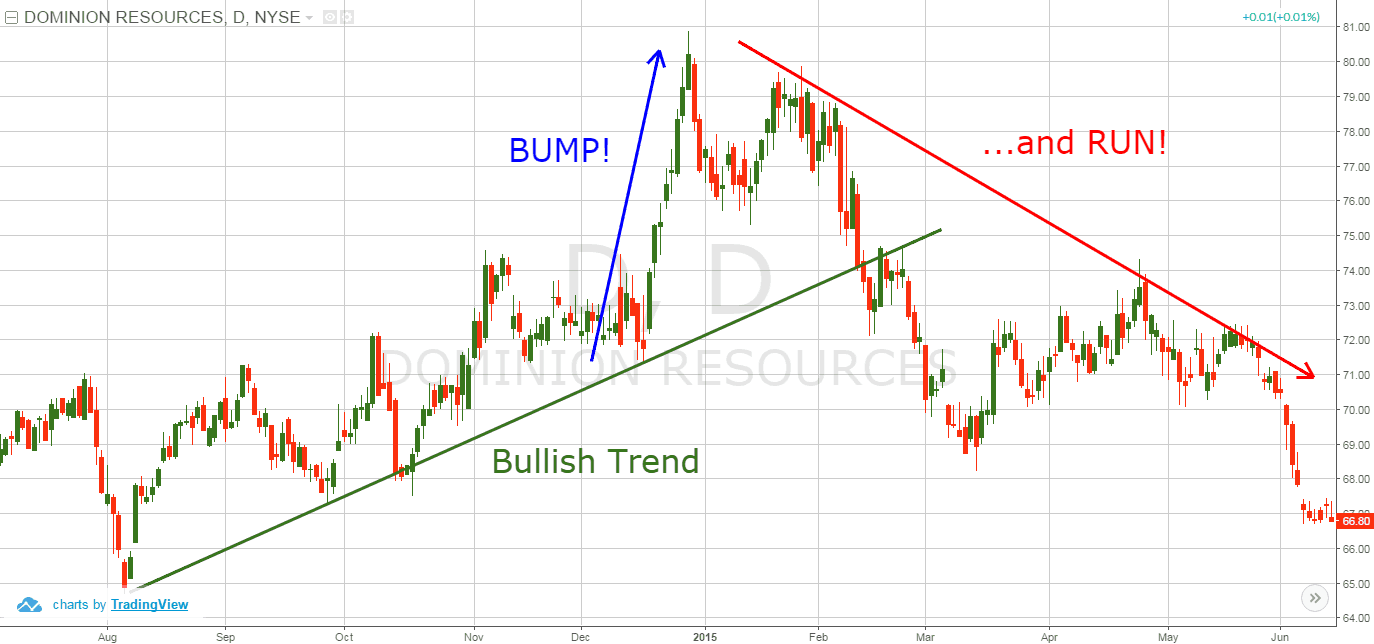
5 Tips for Confirming and Trading the Bump and Run [Updated June 2026]
The bump and run chart pattern is a rare formation. So, to make things simple, we will walk you through 5 easy steps for identifying the pattern.
7 min read
How Well Do Pre-Market Futures Define the Day’s Range? [Updated June 2026]
One of the biggest advantages of futures trading is the fact that the futures markets are open nearly 23 hours a day. This continuous market allows...
13 min read
4 Simple Scalping Trading Strategies and Advanced Techniques [Updated June 2026]
Today we are going to cover one of the most widely known, but misunderstood strategies – scalp trading, a.k.a scalping. If you like entering and...
12 min read
The Best Small Account Strategy for Exponential Gains [Updated June 2026]
The best small account strategy for exponential growth. Sounds promising doesn’t it? Most of us are in this same boat, wanting to grow what little...
6 min read
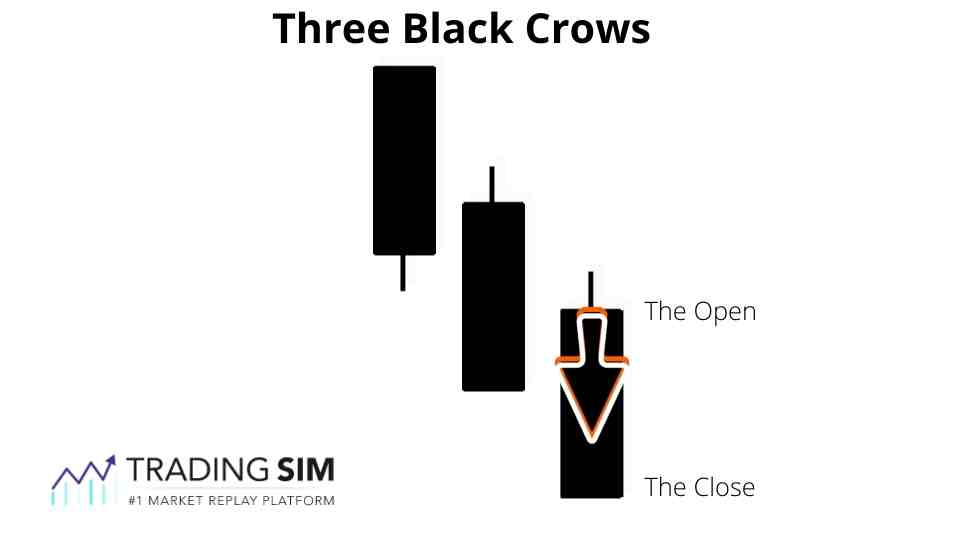
Three Black Crows Candlestick Pattern Tutorial [Updated June 2026]
Three black crows sounds ominous -- like a murder of crows circling a meal. And when it comes to stock trading, this candlestick pattern usually does...