To practice the symmetrical triangle example detailed in this article visit https://www.tradingsim.com.
Symmetrical Triangle Definition
A symmetrical triangle is the most common triangle chart pattern. It is comprised of price fluctuations where each swing high or swing low is smaller than its predecessor. This coiling price movement creates a structure of a symmetrical triangle. As a symmetrical triangle is forming, trading activity diminishes along the way until the apex of the triangle is reached.
Many technicians believe that if a stock is rallying prior to a symmetrical triangle, the stock will eventually breakout to the upside. Conversely if a stock is falling prior to a symmetrical triangle forming, the stock should continue lower. Both of these assumptions are wrong. Symmetrical triangles provide little, if any indication as to which direction the stock will ultimately breakout. Remember from the above definition, there is a lack of volume and price movement which creates a coiling pattern, therefore it is simply impossible to assess which way a symmetrical triangle will inevitably breakout.
Symmetrical Triangle Breakout
There are two key components to a symmetrical triangle breakout: price and volume. For a breakout to the upside, you want the stock to close decisively outside of the triangle formation with a pickup in volume. Breakouts to the downside also require a decisive price break of the formation, but the volume does not need to display a significant increase in activity. If you notice a pickup in volume on a breakdown, odds are it is a false signal and the stock will likely reverse to the upside.
Symmetrical Triangle Breakout Chart Example

Symmetrical Triangle
Above you see a classical example of a symmetrical triangle on a chart. If we draw a horizontal line through the right edge of the triangle, we will divide its angle into two equal parts. This is the requirement we need in order to confirm this pattern on the chart. Also, notice that the lower level of the triangle starts later than the upper level. In a real symmetrical triangle on a piece of paper, the two sides need to be equally long. However, on a chart this is impossible. The reason for this is that the stock price is unable to draw a top and a bottom at the exact same time. After all, the x-axis on every stock trading chart refers to time.
Also, notice that the initial symmetrical triangle breakout on the image is bearish. The price first breaks the lower level of the formation. However, the price then switches directions and breaks the upper level of the triangle with a big bullish gap which comes with the new trading day. This is a normal outcome when trading triangles – especially the symmetrical triangle. After all, the direction in which the triangle will break is unknown before the appearance of the triangle. For this reason, if you see the price peeking through one of the levels, this doesn’t mean that you have a breakout. In many of the cases it might be better to wait for the price to develop, before concluding that there is a breakout.
Trading the Symmetrical Triangle Pattern
As I said above, the trick is to catch the right breakout. After identifying the right breakout, you then need to define the target and risk of the trade.
Identifying the Real Breakout
A great trading tool for spotting real breakouts is the volume indicator. The reason for this is that real breakouts usually happen during high trading volumes and high volatility. The fake breakouts appear during low volumes and they look more like a range rather than a breakout. Since the levels of any triangle are inclined, a ranging move sometimes brings the price outside the frames of triangles. This way traders get lured that there is a breakout on the chart. Let me show you how to spot real symmetrical triangle breakouts with the help of the volume indicator.
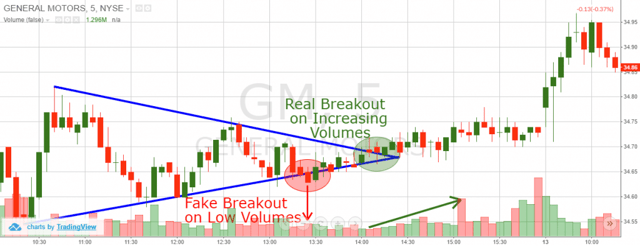
Symmetrical Triangle Pattern
Above is a 5-minute chart of General Motors from May 12, 2015 where a symmetrical triangle developed over an entire trading day.
In the red circle we see a fake breakout. Notice that the volumes during this breakout are relatively low and stay low over the next few periods. Later on we see a bullish breakout when the trading volumes are increasing. This is the real breakout that should be traded.
Symmetrical Triangle Target
Every chart pattern you trade should “tell” you what your target is for the trade. The reason for this is that chart patterns have a target, which is well known to the more experienced traders. Remember this: When you trade chart patterns, your minimum target equals the size of the pattern itself. This is an important rule which should always be in your mind when you trade chart formations. The symmetrical triangle formation is no different.
In order to measure the symmetrical triangle size, you first need to extend the shorter side to match the length of the other side. The size of the third side of the triangle (which is missing) is the size of the price move you should pursue. If you are getting confused, the image below will help you understand the size of the symmetrical triangle chart pattern.
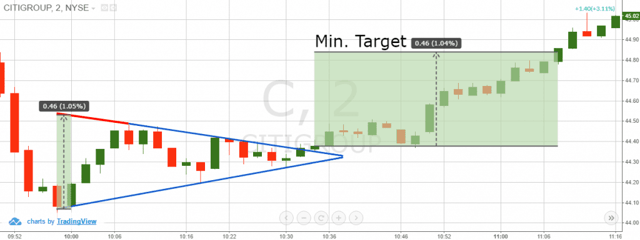
Symmetrical Triangle Price Target
Above is the 2-minute chart of Citigroup from April 14, 2016. The blue lines on the chart form the symmetrical triangle. However, I have added an extension of the upper level – the red line on the chart. This way, we can measure the third side of the symmetrical triangle. Have a look at the arrow on the green area between the two sides of the triangle. Its length is $0.46 (46 cents). We take this length and we apply it right after we identify the breakout in the formation. This is the minimum target we should pursue when trading the pattern. In this case it appears that we have a symmetrical triangle reversal scenario.
Symmetrical Triangle Risk Analysis (Stop Loss)
Since we know how to distinguish the real breakout from the fake breakout and we already know our symmetrical triangle target, it is time to discuss the risks of the trade.
You should always know the amount you are willing to risk before placing any trade. If sometimes you need to risk more than you set into your trading plan, simply do not take the trade and move forward to a better one. It acts the same way with the symmetrical triangle stock pattern.
The proper location of a stop loss when trading symmetrical triangles is below the opposite side of the breakout.
However, this level is inclined, right? The more you move the stop to the left, the bigger the distance is between the stop and the entry price.
So, where should we place the stop? Here you need to apply some simple price action rules. Have a look at the price action in the symmetrical triangle. If the real breakout is bullish, place the stop below the lower level of the triangle, under a bigger price bottom. If the breakout is bearish, place the stop loss above the upper level of the triangle.
At the same time, try to pursue a win-loss ratio of at least 2:1. Have a look at this image which will explain to you where to place your stop when you trade symmetrical triangle patterns:
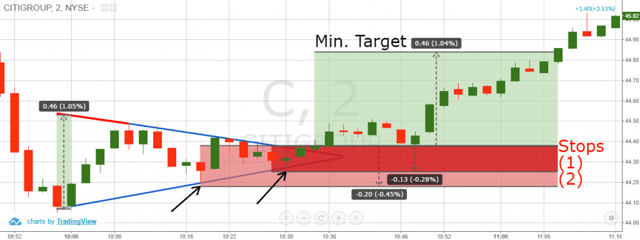
Symmetrical Triangle Stop Loss
This is the same 2-minute chart of Citigroup. This time, I have included two stop loss points on the chart. Notice the two black arrows below the lower level of the triangle. They identify the last two bottoms, which are part of the support line of the symmetrical triangle. These two levels are great points to place your stop loss.
Our minimum profit target is $0.46 above the entry price, which is a 1.04% target. The first stop loss is 0.28% below the entry price and the second stop loss is 0.45% below the entry price. If you choose stop loss (1) you will get the following win-loss ratio:
1.04 : 0.28 = 1.04 / 0.28 : 0.28 / 0.28 = 3.71 : 1 win-loss ratio
This fulfills our 2:1 minimum win-loss ratio. If you choose the second stop loss order, you will get the following win-loss ratio:
1.04 : 0.45 = 1.04 / 0.45 : 0.45 / 0.45 = 3.22 : 1 win-loss ratio
I will recommend you to use the second stop loss alternative in this case. The reason for this is that it is more secure and it still fulfills the 2:1 win-loss requirement of a good trade.
Full Symmetrical Triangle Trading Strategy
Now we will combine all the information we discussed above into a profitable symmetrical triangle trading strategy. We will enter the market on a real symmetrical triangle breakout, placing a stop beyond the opposite side of the triangle.
We will hold the trade until the price moves with a size equal to the size of the triangle. After this target is completed, we will close 50% of the trade. If the trend continues, we will hold the other 50% until the price breaks another swing point on the chart.
I know all this sounds a bit confusing, so have a look at the image below which illustrates this strategy.
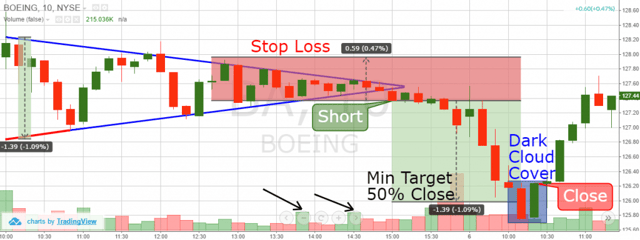
Symmetrical Triangle Trade Example
Above you see the 10-minute chart of Boeing from Apr 5 – 6, 2016. The image displays a symmetrical triangle with a downside target.
The blue lines frame the scope of the triangle. The red line is an extension of the lower level, which help us to place the minimum target on the chart. The two black arrows identify two relatively larger volume bars.
The second big bar matches with the bearish breakout of the symmetrical triangle. Therefore, we assume that the breakout is genuine and we short Boeing based on our symmetrical triangle trading strategy.
The best place for a stop loss order is as shown on the image above. This is the place above the third top of the triangle, above the upper level. This way we have a 1.09% target while risking 0.47%. Let’s now calculate the win-loss ratio:
1.09 : 0.47 = 1.09 / 0.47 : 0.47 / 0.47 = 2.32 : 1 win-loss ratio.
With the target and the risk identified, we take in this trade we manage to attain 2.32 : 1 win-loss ratio. This fulfills the 2:1 minimum, which makes the trade potentially favorable. After a 30-minute consolidation, Boeing’s stock price begins decreasing. Eight periods after the price starts decreasing, Boeing hits our minimum target accounting for a total decrease of 1.09%. Since our minimum target is accomplished we close 50% of the trade.
Now we have the other half of the trade open in order to catch a potential continuation of the bearish trend. However, with the next candle, the BA price closes a dark cloud cover candle pattern, which is shown in the blue square on the chart. This candlestick pattern has a strong reversal potential.
Based on the development of this reversal pattern, we close the other 50% of the trade.
Let’s calculate the profit results now:
We catch 1.09% with the first half of the trade, which we close after the minimum target reach. This means that the first part of the trade brings profit equal to:
1.09% / 2 = 0.60%
Now let’s calculate the second half of the trade. We don’t manage to catch a further price decrease and we realize a safe exit based on the dark cloud cover pattern. This way we avoid the bullish force which comes right after we close the trade.
The total price move during the second half of the trade equals to 0.89%. However, this is still only half of the trade. For this reason, we divide this percentage by two.
0.89% / 2 = 0.45%
So, the total profit from the trade equals to 0.60% + 0.45% = 1.05%.
Conclusion
- The symmetrical triangle is a chart pattern, where a horizontal line through the rightmost edge divides the angle into equal degrees.
- The breakout direction of the symmetrical triangle is unknown. For this reason, we should be able to distinguish a real breakout from a fake breakout.
- A great way to identify the real breakout is to use a volume indicator. Real breakouts usually appear during high trading volumes. When the breakout happens during low volumes, the move will likely not hold and reverse.
- The minimum target of every symmetrical triangle is as big as the size of the triangle itself.
- In order to define the size of the triangle, you should extend the shorter level, so it will be the same size as the other level. The distance between the ends of the two levels is the potential size, which the price is likely to accomplish after the triangle’s breakout.
- When you enter a trade based on a symmetrical triangle breakout, you should put a stop below the opposite level to the breakout. Also, you should conform the stop with one of the tops/bottoms on this level.
- When the minimum target is reached, close only 50% of the trade in order to strike for a further price move in your favor. Then use a simple price action rule to close the other half of the trade.


 Chart Patterns


