In this article, I will discuss how to combine spinning tops with other candlestick formations and volume candles to pinpoint market reversals and continuation patterns. Before we dive into the details of the setups, I first want to ground you on the construct of a spinning top.
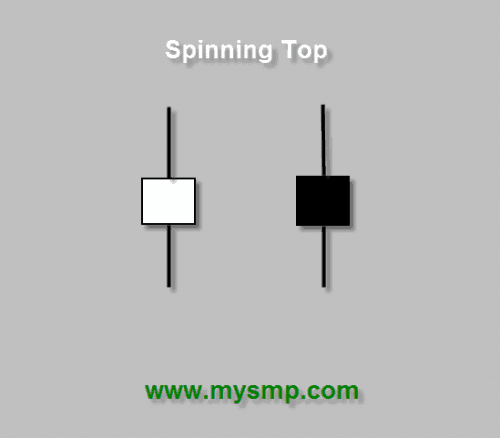
A spinning top or (Koma) is a candlestick which the body of the candlestick is smaller than the lower and upper wicks.
This candle represents a neutral position in which neither bulls or bears can gain control during the trading session. The color of the real body is irrelevant as the body of the candle is so small. If a spinning top arises after a strong uptrend or downtrend, it is an early sign that the trend could be reversing. Traders should wait for more confirmation that the trend is changing before taking a short or long position.

Spinning Top
Chart Examples of Spinning Tops
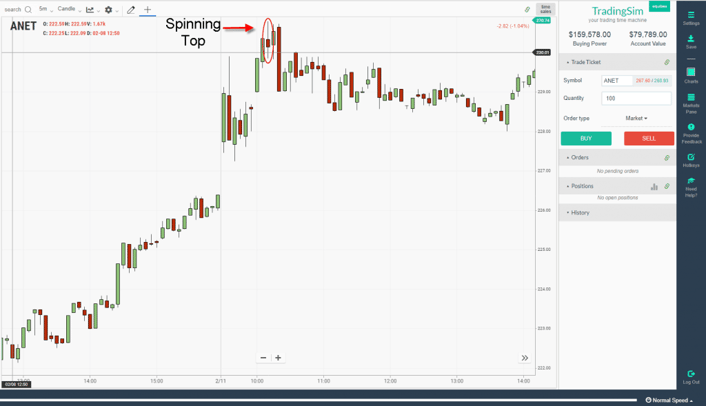
Spinning Top
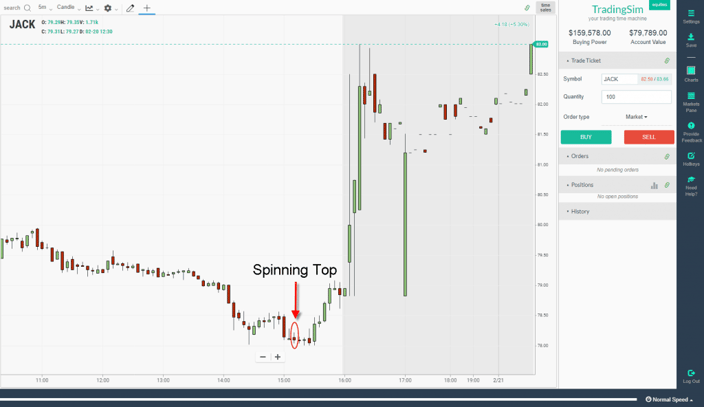
Spinning Top – Example
As you can see in both examples, the spinning top preceded a move lower and also a move higher.
The spinning top candle is almost hard to identify because it does not stand out relative to the surrounding candlesticks. Are you able to spot these candles on the chart?
Where Things Get Difficult
If you look across the web, you will see many examples, like the ones listed above where the spinning top triggers a strong counter move that you can just jump on board.
So, our work here is done, right?
Wrong.
Trading is challenging, and there isn’t one perfect system, indicator or candlestick that is infallible.
The spinning top candlestick is not immune to mistakes as well.
Spinning Tops that Fail
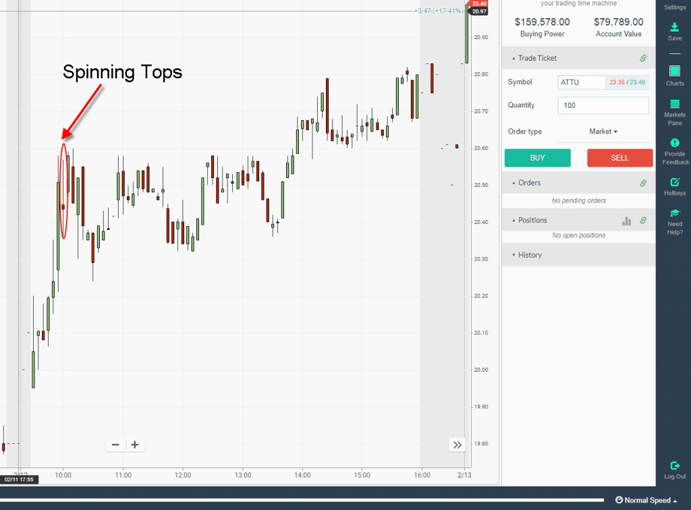
Failed Spinning Top
Let me clue you in on a little secret. Most spinning tops fail to predict a market turn. In the above example, do you see what happened?
After the candlestick emerged, the stock had a lame push lower and then resumed the uptrend higher into the close.
Remember, the spinning top is neither bullish nor bearish. So, if you spot one on a chart, it’s likely just a breather in a broader continuation.
How to Increase the Accuracy of Signals
Now that I have completely soured you on the candlestick let’s review some tactics which can increase the accuracy of its signals.
I am not going to get into some crazy quants conversation -it’s not that complicated.
It’s always better to keep things simple, and that includes trading.
#1 Method – Three Soldiers
Three soldiers are candlesticks that are all the same color, with decent size bodies. This means if a stock is selling off, there are three red candles of decent size that are pushing the stock lower.
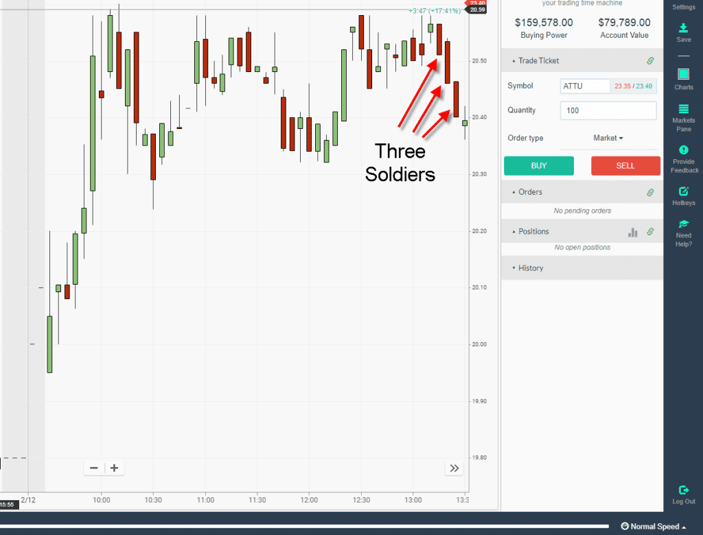
Three Soldiers
So, where do spinning tops come into play?
Well, if you have been following closely, you will notice the spinning top after the last soldier. Did you see it?
Guess what happened next?
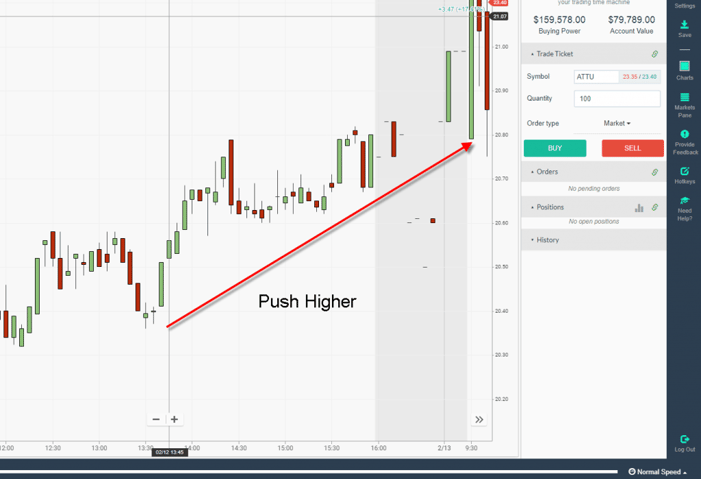
Push Higher
Hope you guessed it since we showed the chart earlier. The stock pushed higher.
Now, for this to work you need to keep a few items in mind:
- There needs to be a primary trend in place
- You need three or more red soldiers
- The stock can exceed the high of the spinning top for longs (opposite for shorts).
#2 – Volume Candle
Another method that works nicely is the combination of using volume candles to identify when a trend is set to change.
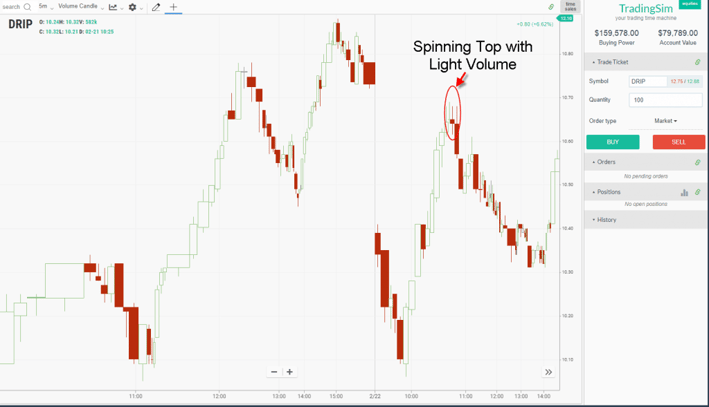
Volume Candle – Spinning Top
If you are not familiar with volume candles, please check out our article here.
In short, these candles show both price movement but also incorporate volume which determines the width of the candle.
In the above example, you can see how the candlestick was narrow relative to the volume candle that preceded the gap down. This light volume eating into a gap with a fat volume candle above increased the likelihood of the stock rolling over and that’s exactly what happened.
Now again, the volume candle provides you a quick method for identifying when the market is likely to turn with spinning tops without needing a complicated trading algorithm or custom indicators.
Trading with Spinning Tops
Now that you understand how to identify the candlestick and where to select high probability trades, we now need to talk about how to enter and exit a position.
Entry
The entry on the trade is above the top of the candlestick for longs and below the candlestick for shorts.
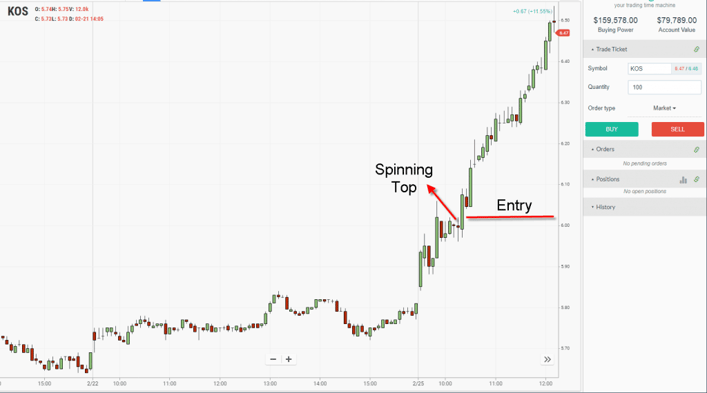
Entry
In the above example of the stock KOS, the stock developed a spinning top after a strong move on the open.
The stock then broke above the high of the candlestick and began the next leg higher.
The high of the candlestick is your entry point for the trade. Again, a candle doesn’t always represent a potential trend reversal; it can also be a short-term breather of a bigger continuation pattern as in this example.
Stop
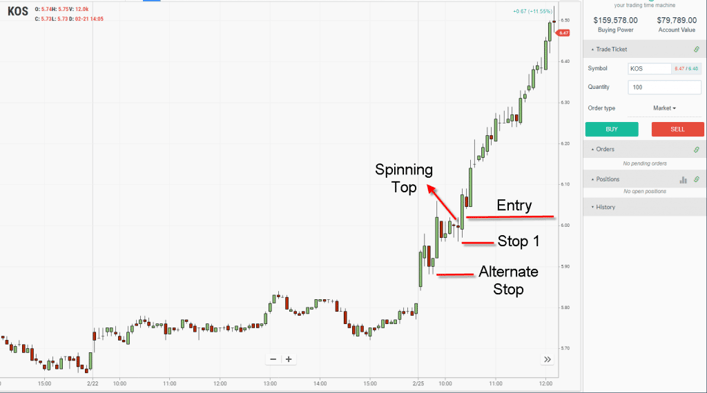
Stop
If you can look past my crooked lines, you will see two stop levels.
The first stop level is directly beneath the low of the candlestick. This will be the most conservative stop level, and if the stock continues to chop, you could be stopped out.
The second stop, which is labeled alternate stop, is where you could place a stop beneath the most recent swing low. This stop will expose you to more risk but will give the stock more room to move in the event there is further consolidation prior to the continuation breakout.
There is no right or wrong answer; it just comes down to how you calculate your risk and reward on each trade.
Profit Target
There are a host of methods to determine your profit target and will depend on your trading style. For me, I like to use pivot point levels and Fibonacci extensions to determine when to exit my position. To learn more about profit targets with pivot points, please check out our article here.
How Can Tradingsim Help?
If you are interested in trading spinning tops, you can do so within Tradingsim. You can practice with over three years of real tick data at multiple replay speeds to determine which pattern works best with the candlestick.
To learn even more about candlestick, check out this awesome video from YouTube here.
Spinning Tops in Today's Markets: A July 2026 Note
The mechanics of the spinning top have not changed since this article was written, but the context around them has. With algorithmic activity dominating intraday volume, lone spinning tops on lower timeframes produce more noise than they once did. The two accuracy filters described above — combining the pattern with support and resistance and confirming with volume — matter even more now. Most experienced traders treat a spinning top strictly as a heads-up to prepare, never as a standalone entry signal, and require the following candle to confirm direction before committing capital.
Frequently Asked Questions
What does a spinning top candlestick mean?
A spinning top has a small real body with upper and lower shadows of similar length. It signals indecision: neither buyers nor sellers controlled the session, which often precedes consolidation or a potential reversal.
Is a spinning top bullish or bearish?
On its own, neither. Its meaning depends on context. After a strong downtrend at support it can precede a bullish reversal, while after an extended rally at resistance it can warn of a bearish turn. Confirmation from the next candle is essential.
What is the difference between a spinning top and a doji?
Both show indecision, but a doji has virtually no real body because the open and close are nearly equal, while a spinning top has a small but visible body with roughly symmetrical shadows.
How do you trade a spinning top candlestick?
Wait for the pattern to form at a meaningful level such as support, resistance, or a moving average, then enter only after the next candle confirms direction, placing a stop beyond the spinning top's high or low.
Do spinning tops work on intraday charts?
Yes, but they generate more false signals on very low timeframes. Pairing them with volume analysis and key price levels, and practicing the setup in a simulator first, materially improves their reliability.
Related Reading on TradingSim








 Candlesticks