In this article, I am going to discuss the concepts centered around range-bound trading. There are approximately 7 key topics to discuss, so please make it through the entire article.
Overview of Range Trading
Range trading is where a trader seeks buying and selling opportunities within a defined boundary of highs and lows. [1] Ranges can materialize on any timeframe and with all types of securities.
Defined Range
Ranges are Not Exact
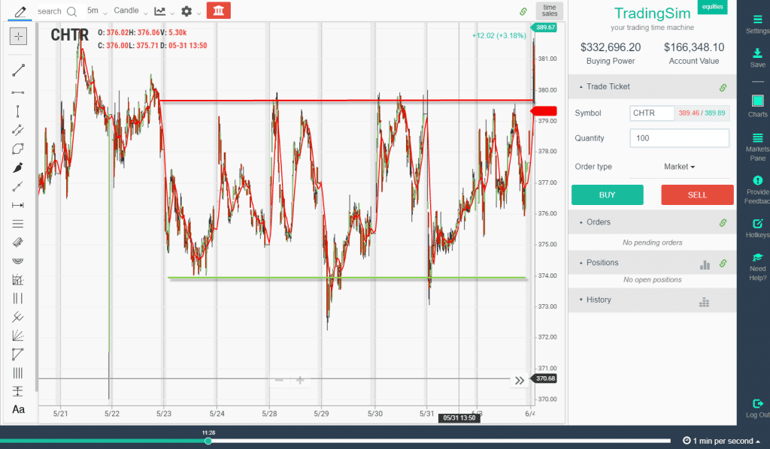
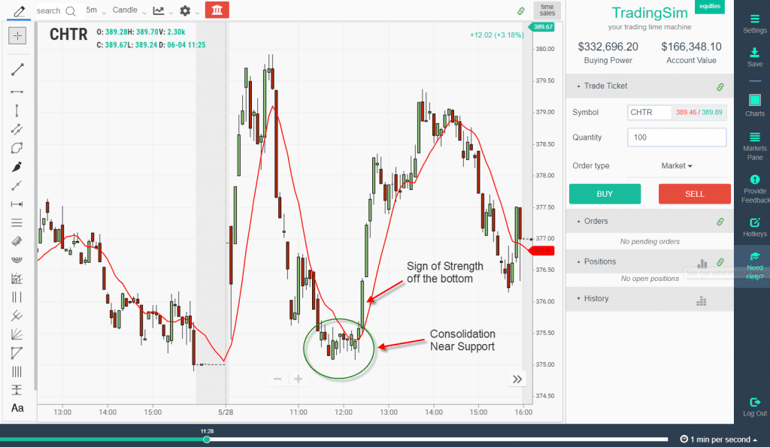
As you can see in the chart above CHTR traded in a range with a high in the low 380s and low in the mid 370s.
One of the key items to call out in this chart is the fact the high and low ranges are not exact. Meaning the candlestick may breach the high and low zones by a tick or two, but this does not mean the trading range is invalid.
Range Trading Indicators
If you are going to trade in ranges, oscillators are going to be your best friend. This is because oscillators are in a constant dance, shifting from overbought to oversold levels.
Ultimate Oscillator
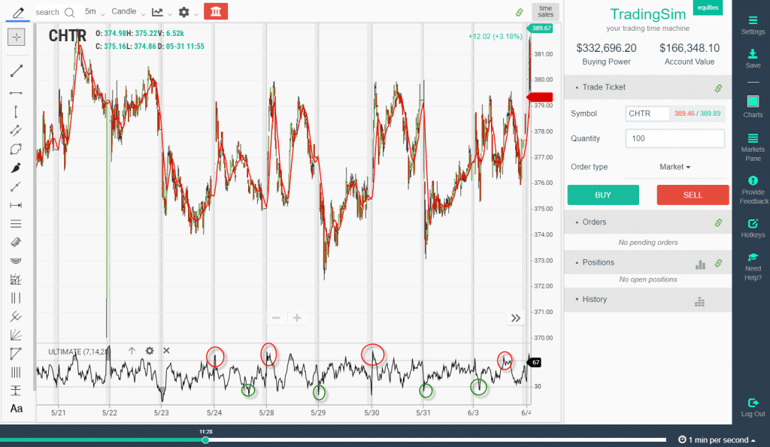
Above is a chart with the ultimate oscillator at the bottom. Each high in the range can literally be traced to an overbought reading in the ultimate oscillator. Conversely, each low is linked to the oversold readings with green circles.
Stochastics Oscillator
Stochastics Oscillator
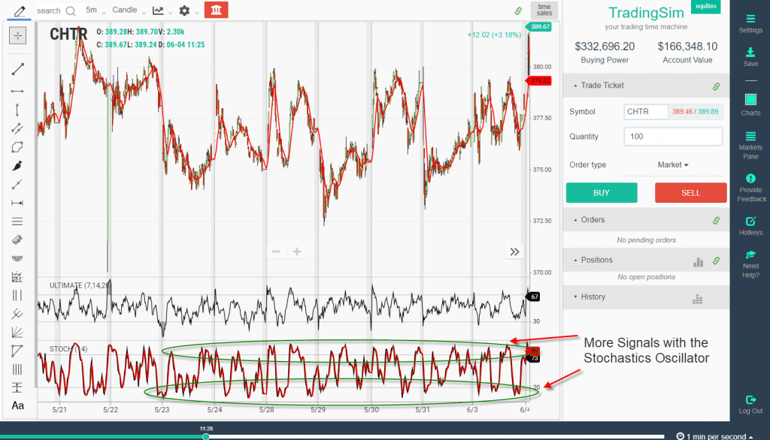
The next chart has another oscillator, the stochastics oscillator. As you can see, the stochastics produces far more signals within the trading range than the ultimate oscillator.
This is because the ultimate oscillator factors in more input periods into its calculation – three to be exact (7,14,28).
Different Indicators – Different Results
This is the challenge when applying oscillators and other technical indicators to charts. You are simply going to receive different buy and sell signals.
So, how do you handle this paradox?
The easy way; pick one indicator and master it. Learn how stocks trade within a range and how your chosen indicator is able to lead these buy and sell signals.
Price Action – Old School Way of Trading Ranges
If you are not big on oscillators, another option is to analyze the price action within a trading range. Let’s zoom into the action on CHTR to further dive into this method.
Sell Signal
Price Action Sell Signal
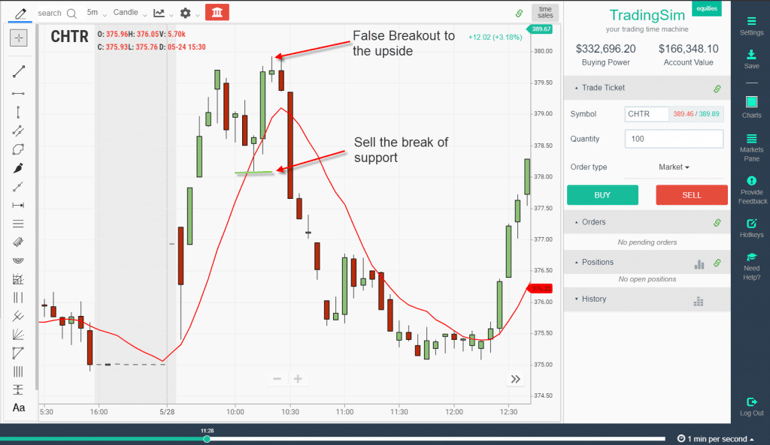
In the above chart, you can see how CHTR poked its head over the recent swing high by a hair. The stock then reversed on a dime and broke the recent swing low before the failed attempt higher.
The subsequent selloff resulted in the stock falling back to the low of its trading range.
Buy Signal
Buy Low of Range
As CHTR hit the bottom of its trading range, the stock began to consolidate. Things then took a turn for the bullish after the stock was able to shoot out of this consolidation range with strength.
The entry is right on the break with a stop right below the range. Guess where you should place your target? That’s right, the top of the range.
Great Risk-to-Reward Ratio
What gravitates traders to ranges is the risk-to-reward ratio. As a trader, you will constantly hear gurus and educators speak of a 3 to 1 ratio when trading securities. [2]
Calculating this ratio can be tricky when the market is moving at such a rapid pace and each strategy or chart pattern requires a different calculation.
As we stated in the above example, you wait for a reversal sign and then place your stop right above or below the recent swing point. Your target is then the top or bottom of the range.
Where Can Things Go Wrong?
Up to this point, the picture for range trading has been rosy. Well if you have placed even just ten trades, you will know that there is no perfect system.
At the end of the day, you have to protect your position with stops in order to avoid taking unnecessary losses.
Range Trading in the Morning
If you are day trading, the one time of day you need to demonstrate extreme caution is in the early morning. This is because stocks will make strong moves with volume on the open. This is due to the pent up energy from any news releases or earnings announcements from the previous night or before the open.
These extremes can push stocks beyond their ranges with ease and even if it’s for a temporary period of time, it increases your risk on the trade.
Morning Trades
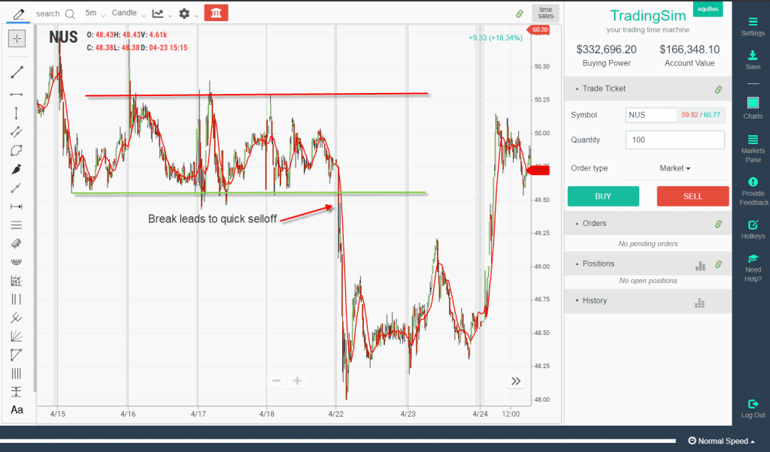
In the above chart, anyone range trading NUS that entered a long position on the open would have been caught in the selloff.
As you can see the stock inevitably rebounded, but what if it didn’t rebound? What if the stock just continued lower throughout the entire day and then gapped down the next day again.
Not to say a break like this couldn’t happen later in the day, but the odds are increased in the morning that things can get rapidly out of hand.
Range Trading Penny Stocks
Now, I’m not going to start bashing penny stocks. For the 100th time, I don’t trade them, but that doesn’t mean other people can’t have a wildly successful career with these types of securities.
However, I do want to touch on range trading these volatile securities.
Let me be the first to say when you nail trading ranges with penny stocks, it’s a beautiful thing. This is because the ranges are so huge. Now with this increased level of reward, there is also more risk.
The other challenge with range trading penny stocks is their level of volatility. If the stock were to break the range, there is a possibility it will not look back.
The problem with this is if you are short and the stock gets going, it can place you in an unfortunate position.
Let’s look at a chart example to further illustrate this point.
Penny Stock Breaking Range
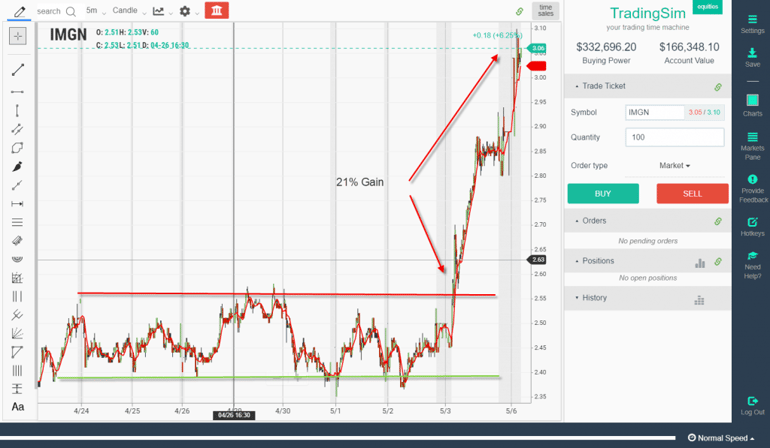
The above chart is of the penny stock IMGN. The stock was in a clear trading range and ultimately broke out to the upside. Unlike the other patterns mentioned in this article where the stock may go against you 2% to 3%, IMGN screamed 21% higher.
Again, please do not take this example as a scare tactic. I am merely demonstrating that the moves at times can be sharp and unpredictable.
Therefore, if you are range trading penny stocks, stops are mandatory, not optional.
How Tradingsim Can Help?
If you are interested in range trading but don’t know where to start, give Tradingsim a try. You may find trading breakouts or another pattern better suits your need, but you won’t know until you test it out.
External References
- Heikin Ashi Trader. (2018). How to Trade A Range. DAO Press. pg. 10
- Get a Grip on Risk/Reward Ratios. (2019). mytradingskills.com


 Day Trading Videos


