Parabolic reversals can be a very tantalizing setup in day trading. These patterns offer an edge to the disciplined trader looking for a sharp trend changes. But how do we know when to time the reversal? Where should our entries occur for the least amount of risk and the highest reward?
In this post, we’ll discuss in detail many of the topics covered in our YouTube tutorial on Part I of “How to Trade Parabolic Reversals.”
What Are Parabolic Reversals?
Parabolic reversals are just that: a stock that goes climactic or parabolic on a chart, and then reverses.
Think of it like an airplane at an airshow that races across the runway at high speed, then gradually increases its angle of ascent. Eventually it goes straight up!
But if you’ve been to an airshow, you know that the engine can’t sustain the upward momentum for very long. Eventually, gravity takes hold and the plane stalls, then begins to plummet back to earth.
This is exactly how we define the strategy in day trading. When the momentum of a stock reaches a fever pitch, it is often time for a breather.
What Is NOT a Parabolic Reversal?
As the name suggests, the stock must go parabolic.
We’ll get into the rules for identifying parabolic reversals in a moment. But for all intents and purposes, if a stock is not accelerating its trend in such a way that becomes parabolic or climactic, then it’s safe to say it hasn’t gone parabolic.
That isn’t to say that the stock won’t reverse. There are plenty of reversal patterns for stocks that haven’t “gone parabolic.” We cover those in other posts like head and shoulders patterns, spotting the backside of a trade, and more.
Generally speaking, though, if a stock is simply trending upward orderly and within a channel, it hasn’t gone parabolic.
Visual Comparison
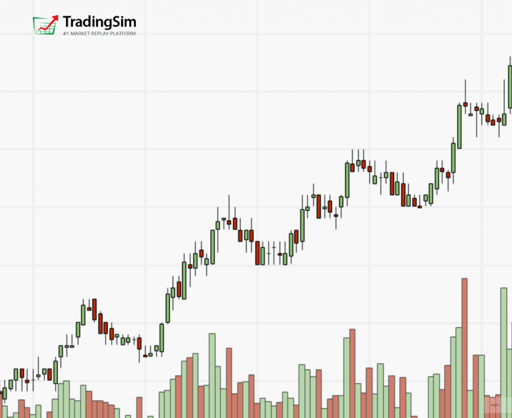
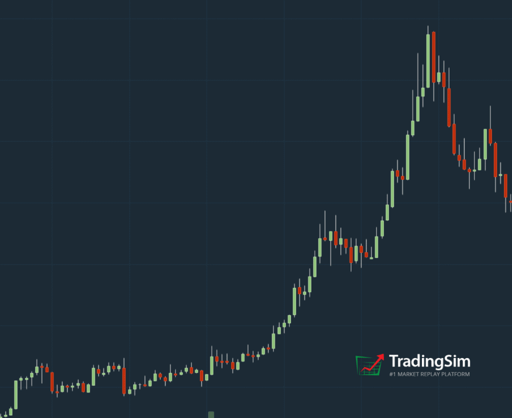
For a quick and general representation, which of these do you think is parabolic, and which is not?
Trending Stock
Parabolic Stock
Once you’ve seen enough examples, the parabolic character becomes apparent. This is important, for reasons we’ll touch on next.
3 Reasons To Trade Parabolic Reversals
Parabolic Reversals give traders an edge. It isn’t an easy edge, but with practice, it can be a profitable edge.
When a stock enters a climactic run, it signals that exhaustion may be near. In essence, what goes up fast, comes down fast.
Climax runs typically provide opportunities for strong hands in the market to unload larger amounts of shares into weak hands who are chasing the stock higher.
Likewise, shorts provide the fuel for the parabolic run because they shorted too early and are forced to cover — pushing the stock higher.
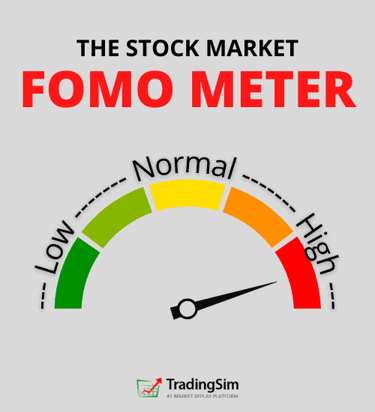
1. Prevents FOMO
On that token, for the astute trader waiting for his proper signals, the parabolic nature of the stock denotes a change in trend is coming. Waiting for the right confirmation can lead to a fast reversal, and fast profits.
This can save the “fomo” trader from the headache of chasing a trending stock higher and higher. We discuss how dangerous this can be in our post on averaging down/up.
Trying to time the top of a reversal is dangerous business without confirmation. If you’ve heard of the old adage “death by a thousands cuts,” then you understand the point.
2. Good Risk vs. Reward
Our job as traders is to identify opportunities in the market that provide us with the best risk to reward ratio we can find. For obvious reasons, we want a higher reward and a lower risk.
Parabolic reversals, when identified and traded correctly, can provide that opportunity for us.
3. Great For Contrarians
Many traders have a contrarian mindset. In other words, they like to take trades counter to the “crowd” or the “trend”.
For this reason, the parabolic reversal strategy offers a fantastic opportunity for these traders to capitalize on an extremely high-time-value trade.
As mentioned before, what goes up quickly usually comes down quickly.
3 Reasons It’s Difficult to Catch a Reversal
1. FOMO
You’re probably thinking, “if parabolic reversal strategies help prevent fomo, why is “fomo” also reason they’re difficult to trade?
The answer is human nature.
We are all prone to fear and greed. And it is for that very reason you need rules, patterns, and strategies to rely on when trading in the markets.
Veer from those rules and you get burned. Therein lies the difficulty of trading parabolic reversals. They are tantalizing.
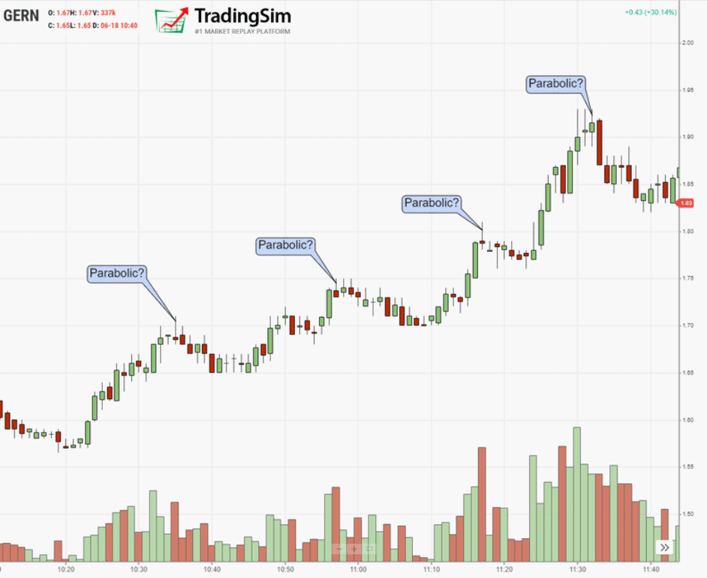
Let’s look at the example we gave above, and consider how many times we might believe the time was right to enter that trade:
The dilemma is identifying the key components of a reversal and waiting for that strategy to confirm. As we see in the above example, the stock didn’t go parabolic until the final overthrow of the orderly channel.
2. No Reversal
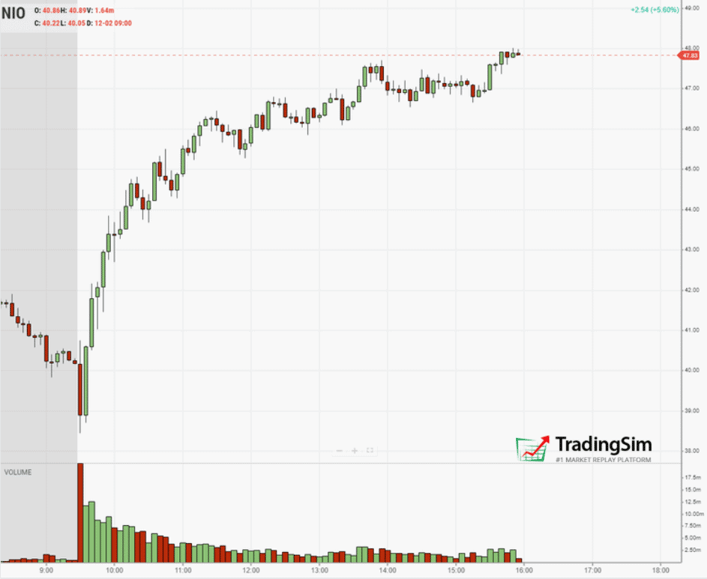
There may be times when you’re completely confounded because the stock simply continues higher. Usually there is some “leveling off” that takes place in this instance. Yet, the anticipation of a reversal is thwarted.
Notice how NIO launches off the open in parabolic fashion, but continues to put in higher highs and higher lows. By the end of the day, it closes at the highs.
NIO never reverses
Understanding the fundamentals of a parabolic reversal and being disciplined to wait for them can prevent taking trades like this.
3. False Signals
This is similar to the FOMO description above. When we aren’t waiting for the proper climactic action on a chart, we can be thrown off by every “red candle” that shows up at the highs.
Anyone who has studied candlestick patterns is already conditioned to see these patterns in the market.
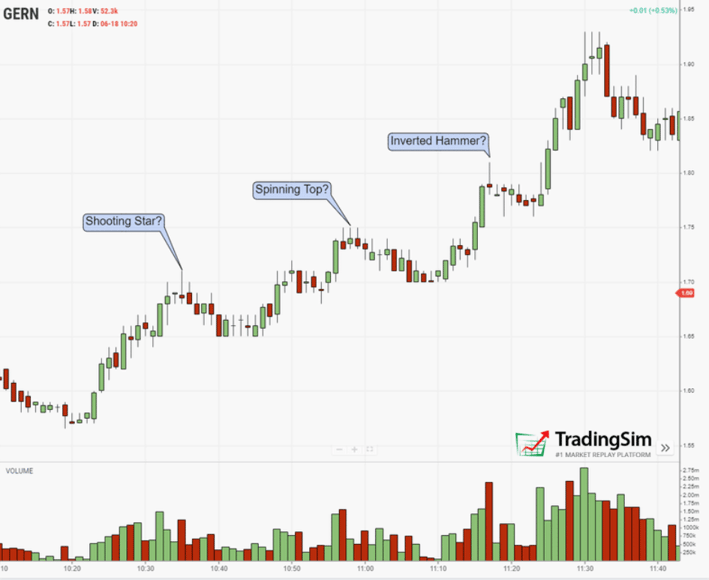
Going back to the GERN example above, let’s see how many “reversal candles” we can find at the highs.
GERN reversal candles
You might be thinking, “but the stock did reverse at these points.” And that’s true. Very true. To be clear, intraday scalpers could play these countertrend “mean regression” moves.
However, if you’re looking for the bigger picture reversal to work, it is worth waiting for the climactic confirmation.
Why Do Parabolic Reversals Work?
Stocks can’t go straight up forever. Nor do they typically go straight down forever.
There are really four reasons behind the move that can give us confidence the trade will work.
Profit Taking
Shorts Covering
Bag Holding
Supply / Demand Imbalance
At some point, like we mentioned above, successful traders are going to take profits on their long positions. In order to do this, they need plenty of “liquidity” or enough demand to sell those shares into weaker hands.
In order to understand that, we need to know that climactic price action has two buyers: early shorts who are finally getting squeezed and covering, and buyers who are finally tempted to buy the stock at the highs for fear that they are missing out.
When this occurs, the disciplined traders take advantage of the opportunity by dumping their shares into these covers and late buys.
Likewise, other disciplined traders capitalize on the imbalance by recognizing the exhaustion. They also spot the “bag swap” on the chart, signaling their opportunity to go short.
Then, as bag holders realize they have bought at the very top, they begin selling their shares. This creates the quick drop we often see that matches the speed of the climb on the front side.
Rules for Trading Parabolic Reversals
As with any strategy, their are rules for determining the proper entry. Parabolic reversals are no different. To this end, we’ve broken down the rules into three categories:
5-Minute Chart
1-Minute Chart
Confirmations
5-Minute Chart
On the five-minute chart, you want to see three things, plus a “bonus.”
Clear uptrend/downtrend
Stock extension from the 9ema
Preferably 3 large 5-minute candles minimum Bonus: A confirmation candle
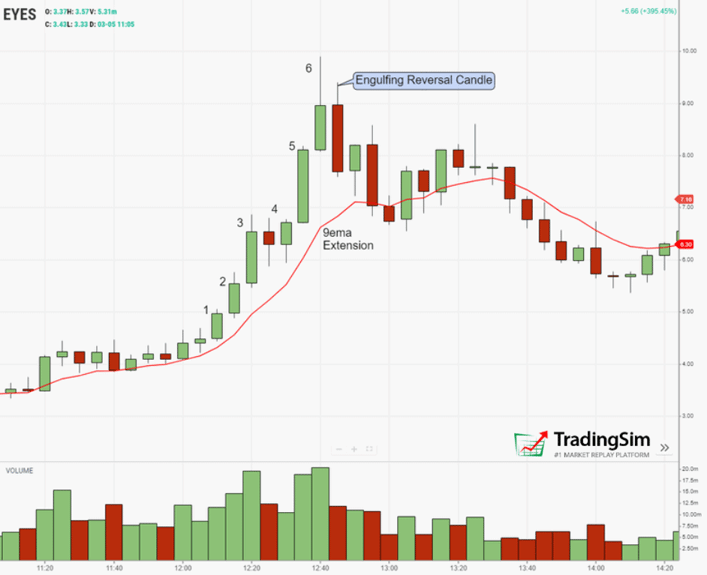
Let’s look at the EYES example from earlier, but on a 5 minute chart to see if we can spot any expanding candles on the parabolic extension:
EYES parabolic extension 5-minute chart
Here we see the three parabolic candles, followed by another exhaustive move higher.
We then get our “bonus” engulfing candle after a huge extension from the 9-period exponential moving average.
All boxes checked!
1-Minute Chart
Multiple time-frame analysis is key to confirm any strategy. Now that we see the confirmation on the 5-minute chart, let’s discover the rules for the 1-minute.
Clear uptrend/downtrend
Trend acceleration
Reversal Candlestick Pattern
Preferably extended from the 1-minute 9ema
New 1-minute low
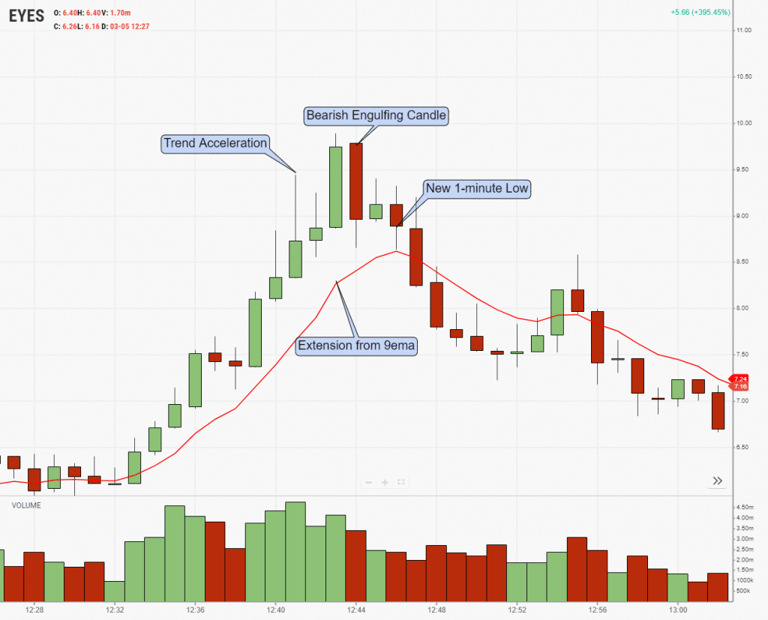
Zooming into the 1-minute, what confirmation can we find on the EYES chart, now?
EYES 1-minute parabolic confirmation
All ducks appear to be in a row: the accelerating/climactic trend, a bearish engulfing reversal candle, 9ema extension, and a new 1-minute low.
Confirmation Checklist
Now that we have the 5-minute and 1-minute charts confirmed, what other criteria can we look for to give us confidence on this trade?
Here are a handful to look for:
Climactic Volume
Daily resistance/support level
Strong moving average on higher time frames (i.e. daily 20ema)
Let’s take a few of these and show what they may look like in our EYES example.
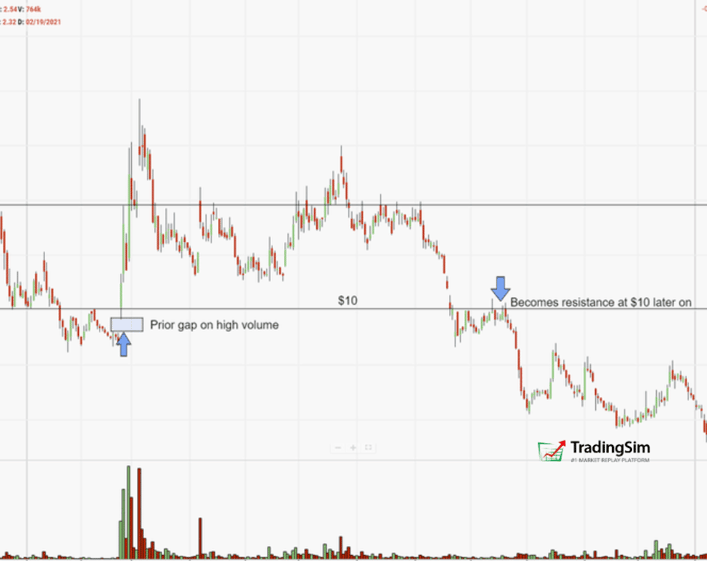
In our example above EYES topped out right around $10. Let’s see what we can find on the daily chart that might have tipped us off to this level.
EYES daily chart overhead resistance
What we see when looking left is that $10 was a very significant level for this stock historically. Drawing lines like this can help us anticipate potential areas of resistance as we view the intraday action approaching these levels.
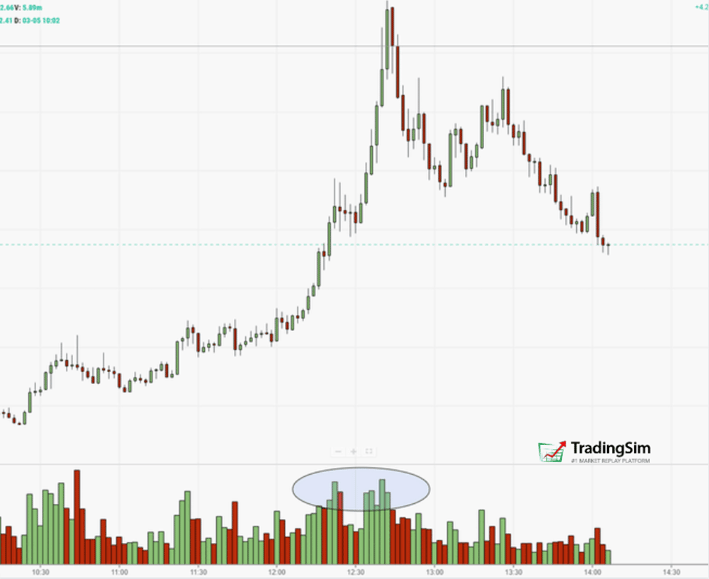
Climactic volume is also an important piece of the puzzle. Why?
It goes back to “why the parabolic reversal works.” We want to see those shorts exhausted, retailers buying with fomo, and strong hands dumping loads of their shares.
Climactic Volume on EYES reversal
As we would expect, the volume signature associated with the parabolic highs are extreme. This gives us the confidence to take our entry, along with the other criteria being met for the setup.
Entry
As all the stars align and our setup is confirmed, the best entry is to take the 1st 1-minute low. (Or first 1-minute high if playing a climactic bottoming pattern).
EYES 1-minute parabolic entry confirmation
Reviewing a previous image, we see our entry on the second red candle off the highs. This gives a point of low risk.
Stop losses can be set at either the High of Day, or into the body of the first red candle. This will depend upon your size and risk tolerance.
Common Questions on Parabolic Reversals
There are a handful of considerations for trading parabolic reversals that we haven’t touched on yet. For example, you might be wondering how extended the stock needs to be from the 9ema.
As a general rule, we find the following statistics helpful:
At least 2-3% extension from the 5-minute 9ema
(EYES was 48% extended at the peak!)
At least a 4R trade back to the 9ema on the 5 minute
If unfamiliar with what 4R means, it simply represents the risk/reward ratio of 1 risk unit to 4 reward units.
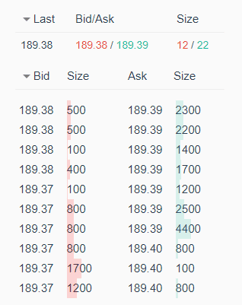
While this strategy can work any time of day, you may find a few early entry exceptions if you are keen on reading the Level II order flow and see a very large “wall” of orders stacking up on the Ask.
Level II Market Depth
As you can see, the orders on the Ask far outweigh those on the Bid (demand). Thus we interpret this as selling pressure entering the market at the top.
Otherwise, you might rely on at least 4 of your criteria being met before entering the trade.
How To Practice Parabolic Reversals
Deliberate practice is the key to success in day trading. You should not be “pushing buttons” with real money trying to trade parabolic reversals until you have successfully traded this strategy 20 times or more in a simulator.
This strategy requires discipline, and can often be a “one shot” opportunity during a very volatility moment.
We suggest trading in the simulator for some time and keeping a checklist of your parabolic reversals. Identify some of these key points in your journal:
what criteria were met
emotions during the trade
confirmations that were not checked
considerations outside of current criteria
success rate
Overtime, we hope you’ll have success with this pattern. And be sure to check out our Part II of Aiman’s YouTube lesson on reversals!
The Red Dog Reversal: A Powerful Strategy for Day or Swing Trading
The Red Dog Reversal is named, endearingly, after Scott Redler. Red Dog has been his nickname in some circles for years — perhaps dating back to his bartending days. Redler is loved in the trading...
Mean Reversion Definition Reversion to the mean, or "mean reversion," is just another way of describing a move in stock prices back to an average. This could be a moving average, a volume-weighted...
The 3 bar chart pattern is one of the more common trading setups. The reason it’s so common makes it an easy target for newbie traders when they do their scans. The problem with the 3 bar reversal...


 Awesome Day Trading Strategies


