In this article, we will cover four important things to consider when assessing an oversold market. The analysis will cover things from both a fundamental and technical analysis perspective.
What does it mean when the market is oversold and who determines it?
For starters, what time frame are you trading? A chart could be extremely oversold on a 1-minute chart, but appear strong as ever on a daily.
Also, for fundamental analysts, oversold can be based on several financial ratios, so which one is right?
Now that we understand that we are no closer to figuring out the meaning of oversold, let’s dive into four things to keep in mind.
#1 – Fundamental Analysis and P/E Ratios
Financial analysts live and breathe by the price to earnings ratio. It’s a really simple number to calculate.
You take the current market value by share and divide it by the earnings per share. This is the first step in the process.
You next need to compare this value to the P/E ratio with the stock’s sector.
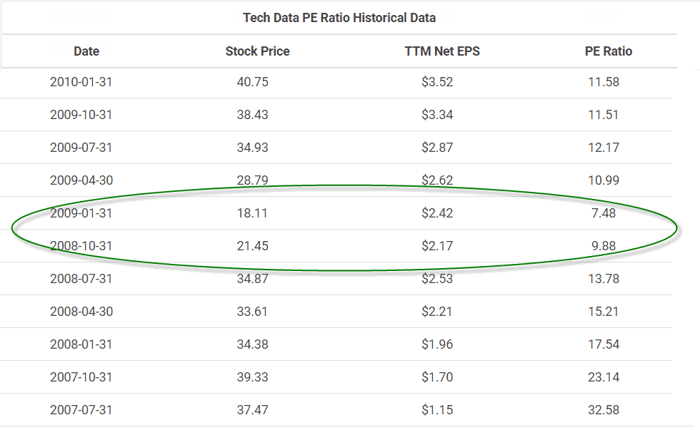
PE Ratio Table
Above is the P/E ratio for the technology sector from 2007 through 2010 courtesy of macrotrends.com. Take a look at the numbers inside of the green circle.
The ratio dropped below ten which was an indicator to value investors the technology sector was considerably undervalued, which is another way of saying oversold.
This low reading was during the height of the mortgage crisis, and we know that after this selloff, we have had one of the strongest bull runs in the history of the market.
P/E Ratios by Sector
A key point to note is that each P/E ratio is not made equally. For blue chip stocks, a P/E ratio under 10 is the norm.
If you attempt to trade based on one stock’s P/E ratio without an understanding of the broad market and the specific sector, you are likely assessing the stock with a blind spot.
#2 – Technical Analysis and Oscillators
In technical analysis, an oversold market occurs when an indicator reaches low levels or price action pushes too far.
For the indicator, identification of an oversold level is straightforward as you can see these low readings printing clearly on the chart. Oscillators are the most popular indicator to display an oversold reading.

Oversold Conditions
In the above chart, you can see the slow stochastic with an oversold reading below 20.
Now, when assessing the broad market, you are going to want to review major indexes like the Nasdaq or S&P 500. In addition to oscillators, you are also going to want and look at the broader chart patterns.
#3 – Oversold Does Not Guarantee a Bounce
A common misconception with technical analysis is an oversold market guarantees a bounce.
Stocks that are often depressed just continue lower or flatten out before bouncing back. There is a phrase called catching a falling knife which speaks to this type of trading.
This is what makes buying oversold markets challenging because you have to determine when to get off the bus.
Oversold and Drifting Lower
This is the SPDR Gold Shares (GLD) ETF. In this next chart, you can see that the RSI was below 20 for 27 sessions and the price continued to slide lower, falling over 7.5%.
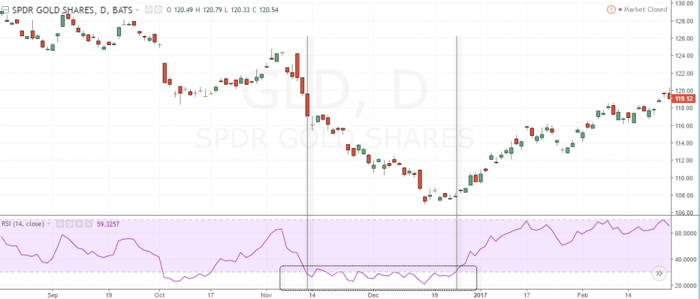
Example of GLD chart with oversold RSI
#4 – How to Trade Oversold Markets
Stay Out
One method for trading these oversold markets is to stay in cash. Now, you may think, well how do I make money if I am not in the market?
Well, the benefit is you are not losing any money. Please remember that in the market a defensive position is also a form of smart investing.
Scale In
If you must trade the selloff, an option is to scale-in to your position. The odds of catching the exact bottom are slim to none. Scaling in allows you to also protect your capital as you are not going all-in right away. If the security is not showing any strength, you can continue to stand on the sidelines before attempting to make another purchase.
How Can Tradingsim Help?
If you are thinking about trading stocks or the overall market during selloffs, you are going to need to practice. This is where Tradingsim can help. We have a market scanner that displays oversold stocks for every day over the last 2 years.
You can then use your indicator and strategy of choice to learn what works for your trading style.


 Intro to Chart Patterns


