The Top 10 Financial Ratios You Should Care About as an Investor
Mar 11, 2019
Written by: Al Hill
✓ Reviewed by Kunal Vakil, Co-Founder of TradingSim
Investors use financial ratios to investigate a stock’s health before investing.
These ratios help assess the valuation of a company and are a primary tool for fundamental analysis. In this post, I will describe the 5 main pillars of ratios and then the 10 most popular financial ratios.
Whether you perform fundamental analysis or are a technician, it always helps to be aware of these ratios.
Sections of a Financial Statement
The starting point for any financial ratio is financial statements. These statements have various sections such as:
Assets and Liabilities
Sales Revenue
Gross Profits
Operating expense
Operating profits
Net profits before taxes
Net profits after taxes
Stock dividends
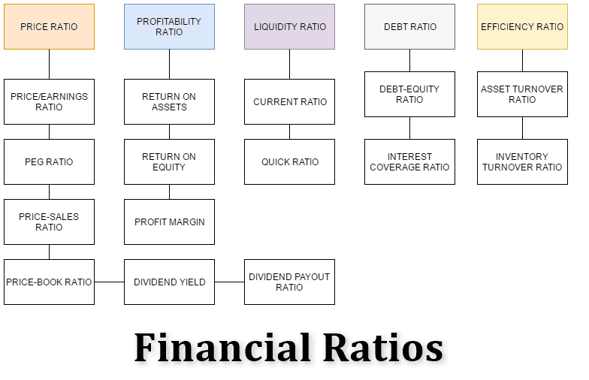
5 Major Pillars of Financial Ratios
Before we dive into the top 10 financial ratios, let’s first discuss the five major categories of ratios: price, profitability, liquidity, debt, and efficiency.
As you can see there are 15 ratios beneath these categories. Well after we discuss the five main categories, we will highlight the top 10 financial ratios.
Types of financial ratios
#1 – Price Ratios
Price ratios determine the relative value of a stock. These ratios are ideal for comparing stocks within the same sector.
#2 – Profitability Ratios
Profitability ratios show if a company is making profits efficiently.
#3 – Liquidity Ratios
Liquidity ratios display if a business is able to meet its short-term obligations.
#4- Debt Ratios
Debt ratios determine the long-term health of a business and the effect of capital and financing structure of the business.
#5 – Efficiency Ratios
Efficiency ratios show how a business is utilizing its resources invested in fixed assets such as machinery, buildings, and equipment.
Top 10 Most Popular Financial Ratios
Now that we have discussed the main types of ratios, let’s dive into the top 10 most popular financial ratios.
1. Price to Earnings Ratio (P/E)
P/E ratio falls under the category of price ratio. The P/E ratio is the price of a stock divided by its earnings and tells you the price you pay for every $1 of earnings.
A lower P/E ratio is ideal as you are not overpaying for the company.
The ratio can vary between industries and there is no fixed number.
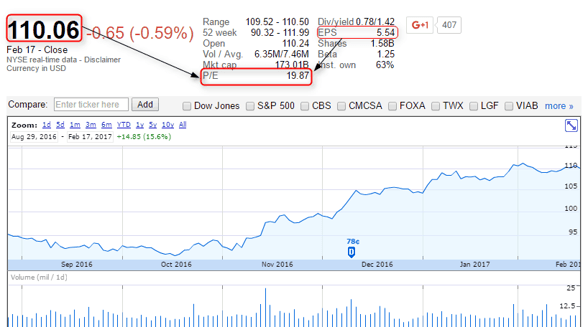
In the below example, Disney is reporting diluted earnings per share (EPS) of $5.54. The stock is also trading at $110.06. To calculate the P/E we take the share price of $110.06 and divide by the earnings by share of $5.54 to arrive at a P/E ratio of $19.87.
Please see the below image for further details.
Example of Walt Disney Stock with earnings of $1.62
2. Price to Earnings Growth Ratio (PEG)
The PEG ratio is based on the P/E ratio and further divides the P/E ratio by the potential earnings growth.
PEG ratio is understandably closely related to the P/E ratio and is part of the price ratio family.
Lastly, a PEG ratio of 1 or lower is better for valuation with a PEG ratio of 1 is said to infer that the company is at fair value.
3. Price to Book Ratio (P/B)
Price to book value shows the amount you have to pay to own $1 of equity. It is similar to Price/Earnings ratio except that book value per share is considered rather than the share price. Book value is already listed on the balance sheet and is also known as shareholder equity, which is the portion of the company owned by stockholders.
4. Return on Assets (RoA)
The return on assets shows how well a company is utilizing its assets to make money. For example, if a company buys equipment or a building, the RoA will show the efficiency of the assets. The return on assets is derived as dividing the net income by the average total assets, the values of which are derived from the income statement and the balance sheet.
5. Profit Margin
The profit margin is a ratio that calculates sales that flow through a company’s bottom line. Higher or increasing profit margins are of course preferred by shareholders and the value is based on dividing the net income by sales.
6. Current Ratio
The current ratio measures a company’s ability to pay its short-term liabilities using its short-term assets. The figure is represented as a number and it is generally accepted that a current ratio of 1.0 or higher indicates that the business has more short-term assets than debts.
A value of less than 1.0 indicates a business has higher debts than short-term assets. The current ratio will show the business vulnerability to any downturn in the economy or sector. The current ratio is calculated by dividing current assets by current liabilities, both these values are found in the balance sheet.
7. Quick Ratio
It is similar to the current ratio as it shows how well a company can meet its short-term debt or liabilities with the difference being that the quick ratio does not account for inventory as it is not considered immediately available like cash or an asset.
The quick ratio calculates the difference between the current asset and inventory divided by current liabilities.
Above all, a quick ratio of less than one means the company is facing problems paying back its current liabilities and thus should be avoided at all costs.
8. Debt-to-Equity Ratio
The debt to equity ratio falls under the debt ratio category and it measures the relationship between borrowed capital and capital contributed by shareholders.
You can calculate the ratio by dividing the total liabilities by the total shareholder equity.
A rising debt-equity ratio means an investment in the company becomes riskier as it is unable to meet its debt obligations.
9. Asset Turnover Ratio
You can calculate the asset turnover ratio by dividing sales by the average total assets. It is similar to the return on an asset but falls under the efficiency ratio.
This gives investors insight into how effectively the management team is running the company. The ratio measures how well the company is using its assets to make products. The asset turnover ratio is a multiple. So a ratio of 2 indicates that for every $1 in assets owned, the company generates $2 in sales.
To measure the asset turnover ratio, you need the sales and the average total assets, the values of which can be found in the income statement and the balance sheet.
10. Inventory Turnover Ratio
As the name implies, the inventory turnover ratio focuses on measuring how quickly a company can sell its inventory. Typically a higher turnover is favorable as it can point to slower backlogs or stockpiling of inventory.
You calculate the inventory turnover ratio by dividing the cost of goods sold by the average inventory. Both values are in the company’s income statement and balance sheet.
Inventory turnover ratio can vary, especially when you look at retail stocks. This is because retailers generally have higher inventory, especially during peak shopping periods.
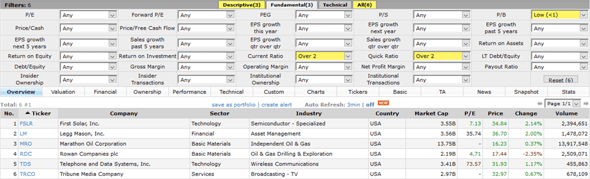
Using Financial Ratios in Stock Screeners
Stock screener based on some financial ratios (Source – Finviz.com)
The above image is of a stock screener which you can use to search through the thousands of securities to find the ones that match financial ratios that best match your trading style.
Trust me, it’s much better to use a scanning tool versus manually going through calculating these ratios by hand.
Should Technicians Care About These Ratios?
Day Traders
Well, this is a yes and no answer. If you are a day trader, you probably are not focusing on the 10 most popular financial ratios in this post. You will likely care about ratios such as the float of a stock. For these day traders, the lower float stocks imply a stock will become impulsive on a breakout.
Swing Traders and Long-Term Investors
As you move up in the timeframes you will notice these ratios play a more important role in your analysis. Why?
Think of the technicals as your clue of when to execute a trade but the fundamentals tell you what to invest in.
So, to quickly summarize: day traders should focus on the float, swing traders should be aware, and long-term investors should have these most popular financial ratios on speed dial.
How Can TradingSim Help?
If you are looking to combine both fundamental analysis with technicals, you can use TradingSim’s virtual stock simulator to practice executing trades based on the desired financial ratios.
Tags:
About the Author
Al Hill
Co-Founder & CEO, TradingSim
Alton Hill is the Co-Founder of TradingSim with over 18 years of trading experience. He completed the Design Thinking Bootcamp at Stanford’s D.School and brings expertise in Product Development to create the best trading simulation experience. His strategy focuses on trend-following systems, targeting high-volatility stocks with strong primary trends using the 15-minute chart.
Computational finance is commonly referred to as financial engineering. This branch of finance relies on several factors such as, mathematical finance, computational intelligence, and simulations....
The Growing Role of AI in Finance: Revolutionizing Investment Strategies, Risk Management, and Customer Service
Even though AI technology is still in its developmental stages, it has blown everyone away with its tremendous capabilities. Generative AI tools like ChatGPT and Google Gemini are being widely used...
What Is the Financial Stability Oversight Council?
What is the Financial Stability Oversight Council (FSOC)? The Financial Stability Oversight Council (FSOC) is the United States federal government institution set up in July 2010 following the...


 Basics of Stock Trading


