Know Sure Thing Indicator – How to Identify Divergences and False Signals
Feb 20, 2019
Written by: Al Hill
The Know Sure Thing (KST) indicator is a two-line indicator similar to the MACD developed by Martin Pring. The oscillator swings above and below zero, and accordingly gives trade signals to traders.
Buy Signals
If the Know Sure Thing crosses above the zero line, then a buy signal is triggered. If the KST holds above the zero line for an extended period, an uptrend is confirmed.
Sell Signals
Conversely, if the KST crosses below the zero line, then a sell signal is triggered. Also, if the KST remains below the zero line, then the downtrend is confirmed.
Now, let’s see how the Know Sure Thing indicator is calculated.
How to Calculate the Know Sure Thing Indicator
Four-Time Frames
The Know Sure Thing indicator uses four different time frames to gauge momentum. Below are the four different time frame calculations:
#1 – Rate of Change Moving Average 1= 10-Period Simple Moving Average of 10-Period Rate-of-Change
#2 – Rate of Change Moving Average 2 = 10-Period Simple Moving Average of 15-Period Rate-of-Change
#3 – Rate of Change Moving Average 3 = 10-Period Simple Moving Average of 20-Period Rate-of-Change
#4 – Rate of Change Moving Average 4 = 15-Period Simple Moving Average of 30-Period Rate-of-Change
Know Sure Thing Formula
Indicator Line
Know Sure Thing Indicator Line = (Rate of Change Moving Average 1 x 1) + (Rate of Change Moving Average 2 x 2) + (Rate of Change Moving Average 3 x 3) + (Rate of Change Moving Average 4 x 4)
Signal Line
Know Sure Thing Indicator Signal Line = 9-period Simple Moving Average of Know Sure Thing Indicator
How to Plot the KST
Let’s have a look at an example of how to plot the KST indicator.
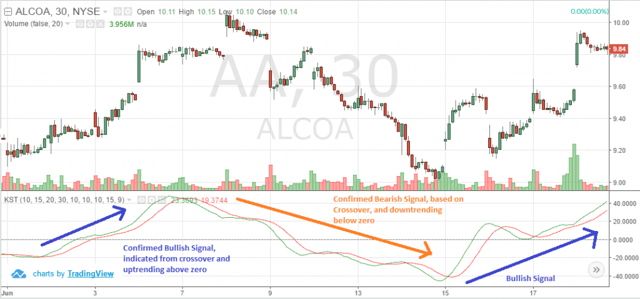
The below image is the 30-minute chart of Alcoa from June 1st to June 23rd.
With the default Know Sure Thing indicator line, there are 9 periods that have been selected-
KST (10, 15, 20, 30, 10, 10, 10, 15, 9).
Traders can choose their periods based on their preference and trading style.
Know Sure Thing Indicator
KST Buy Signal
In the above image, we have highlighted the bullish trends from KST with a blue line. We have identified the first cross over, where Alcoa has remained above zero. Accordingly, we enter Alcoa at $9.22 and the stock rallied.
The bullish trend holds until the price reaches $9.80 and the downtrend was confirmed as the KST began trending downwards and ultimately fell below zero.
Again, we got a buy signal on June 15th, 2016, and accordingly, KST has been rising above zero, confirming a bullish trend.
Remember, you cannot trade one indicator blindly on each buy and sell signal; however, you can see how the KST helps tell the story or a potential buy opportunity. You will want to, of course, use other signals to validate your decision such as trendlines,
Divergence with the KST Indicator
Like other technical indicators, the KST also has divergences.
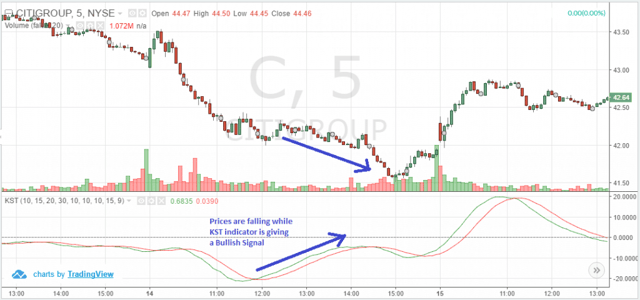
If the prices are falling while the Know Sure Thing indicator is rising, there is a bullish KST divergence. This indicates that the stock is likely to recover in the near future. The below chart example demonstrates how the bullish KST divergence works.
KST Bullish Divergence
This is the 5-minute chart of Citigroup from June 13th to June 15th. The blue line indicates where the KST is rising post a crossover. However, the price was falling during the same period, showing divergence.
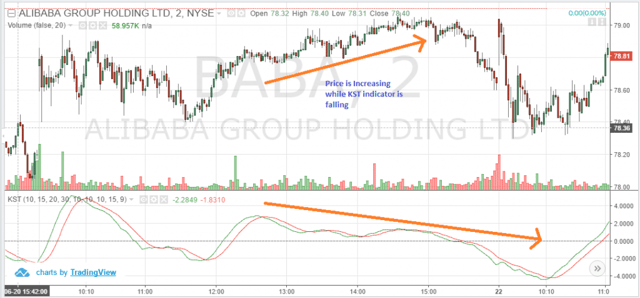
Similarly, if the stock price is rising while the KST indicator is falling there is a bearish KST divergence.
The stock could fall after the KST indicator has confirmed a bearish trend by falling below zero. The below example shows the bearish KST divergence in action.
Below is a 2-minute Alibaba chart from June 21 thru June 22, 2016. We have highlighted the divergence in orange.
The Alibaba stock was surging while the KST indicator was falling. Ultimately, you can see that the stock breaks down, thus confirming the bearish trend.
KST Bearish Divergence
Trading Morning Breakouts with the KST
The Know Sure Thing indicator can be an effective tool for intraday traders.
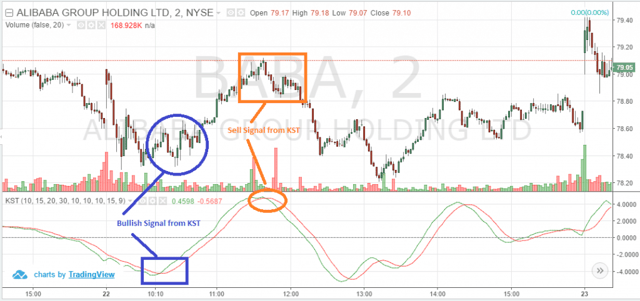
In the below image, we have selected an intraday 2-minute chart of Alibaba from June 22nd. We have identified several crossover signals. For instance, the KST indicator is signaling a bullish trend in the morning session at around 10:15 am.
A long entry could have been initiated at $78.50 and held until a crossover to the downside at $79.
This would have resulted in a 50 cent per share profit in less than two hours.
KST Morning Breakouts
Trading Double Bottoms with the KST
Now, let’s combine the Know Sure Thing indicator with a double bottom on the chart.
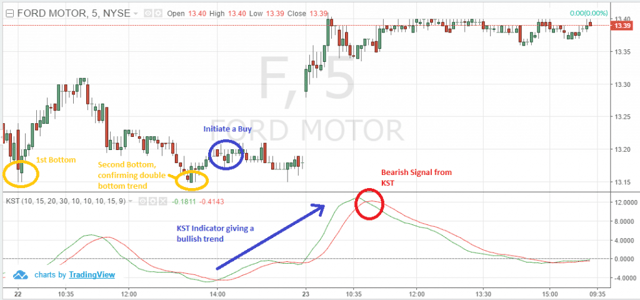
Let’s take a look at Ford’s 5-minute chart.
We have identified the first bottom in the morning session at nearly 9:35 am. We have confirmed the second double bottom at around 1:25 pm.
After half an hour, a bullish crossover develops in the KST confirming the bullish trend. Accordingly. We take a long position at $13.18. On June 23rd, Ford made a gap up and crossed $13.40. We get a bearish crossover from KST and sold our position at around $13.36.
In this example, you would have held a position overnight. I do not hold positions; however, you will need to determine if this makes sense for your trading style.
KST Double Bottom
Day Trading Ranges with the KST
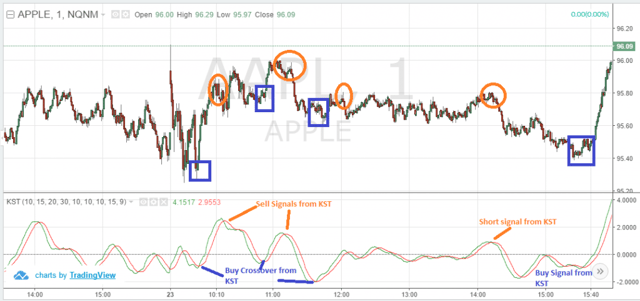
Now, let’s have a look at an Apple chart on a 1-minute interval. We have highlighted buy signals in blue and sell signals in orange.
For instance, in the below chart you could see that we received a buy signal from KST on June 23rd at $95.50. Then we receive a sell signal from the KST indicator after over half an hour and accordingly at $95.80.
These range-bound trading signals work best right after the first hour of trading into lunch.
KST Range Bound Trading
How to Avoid False Signals with the KST
KST gives false signals like any other indicator and hence day traders should use another method for validating setups.
Combining the KST with the volume indicator is an effective way of entering into strong trends.
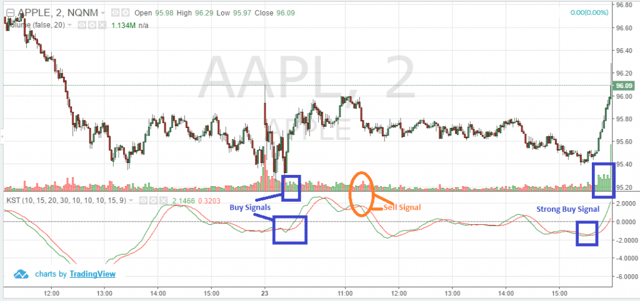
In the below image, we have selected a 2-minute chart of Apple from June 23rd.
We received a buy signal from the KST indicator in the morning session at approximately 9:58 am. This trend was confirmed with the volume increase along with price expansion. Hence, we open a position at $95.50.
We later received a sell signal at $95.77 from the KST in less than an hour. Therefore, we exit the position and book a small gain.
We then enter the waiting game for another trade signal to develop.
Near the end of the day, Apple displayed a strong buy signal from the KST as well as a huge increase in volume. Accordingly, we opened a long position at $95.45 and the stock rallied to the end of the day near $96.05.
KST False Signals
Conclusion
The Know Sure Thing (KST) Indicator is a two-line indicator similar to the MACD.
A buy signal is generated when the Know Sure Thing crosses above the zero line or makes a crossover above its signal line.
If the KST crosses below the zero line or makes a crossover below the signal line a sell signal is generated.
The KST Indicator signal line is calculated based on the 9-period Simple Moving Average of the KST Indicator.
The default setting of the KST indicator is KST (10, 15, 20, 30, 10, 10, 10, 15, 9).
If prices are falling and the KST indicator is rising, this is a bullish divergence.
If the stock price is rising while the KST indicator is falling this is a bearish divergence.
The KST indicator can be an effective tool for intraday traders.
The indicator is prone to giving false signals like any other trading tool.
The KST along with the volume indicator is one of the effective ways of knowing and validating trends.
Lastly, here is a link to a pdf written by Martin Pring which covers the KST and asset allocation.
How Can Tradingsim Help?
If you are thinking of using the KST indicator to trade, you can test drive your strategies in the most realistic market replay platform – Tradingsim.
You can practice using all of the strategies identified here with over three years of market data.
Andrews Pitchfork Indicator – 4 Top Trading Strategies
The Andrews pitchfork indicator, commonly referred to as ‘median lines,’ is one of the most versatile trading tools available. We will explore the basics of the indicator and strategies you can use...
If you are a fan of trading with moving averages and unfamiliar with the alligator indicator, get ready for a pleasant surprise. In this article, we are going to do a head-to-head comparison of the...
Price Rate of Change Indicator The price rate of change indicator (PROC) or simply, rate of change indicator (ROC) is a price-based technical oscillator that is displayed in the sub-window. The PROC...


 Day Trading Indicators


